. 2017 Dec 19;86(1):e00556-17.
doi: 10.1128/IAI.00556-17. Print 2018 Jan.

Acquired Protective Immunity in Atlantic Salmon Salmo salar against the Myxozoan Kudoa thyrsites Involves Induction of MHIIβ+ CD83+ Antigen-Presenting Cells

Affiliations

Acquired Protective Immunity in Atlantic Salmon Salmo salar against the Myxozoan Kudoa thyrsites Involves Induction of MHIIβ+ CD83+ Antigen-Presenting Cells

Laura M Braden et al. Infect Immun. .

Abstract

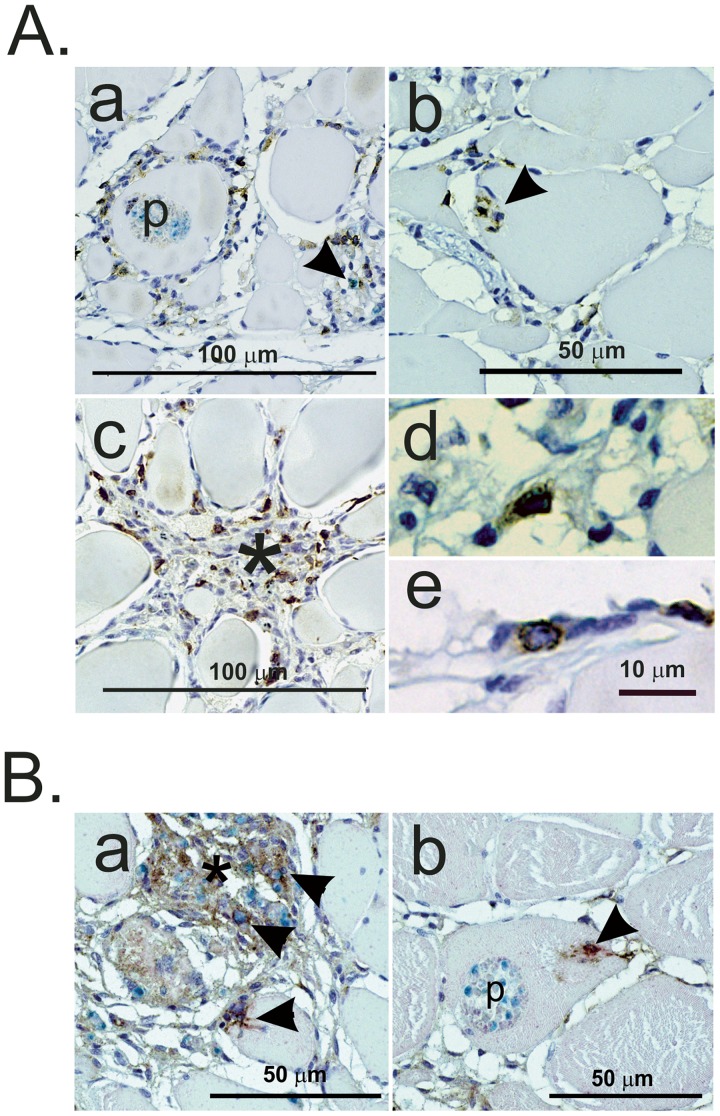
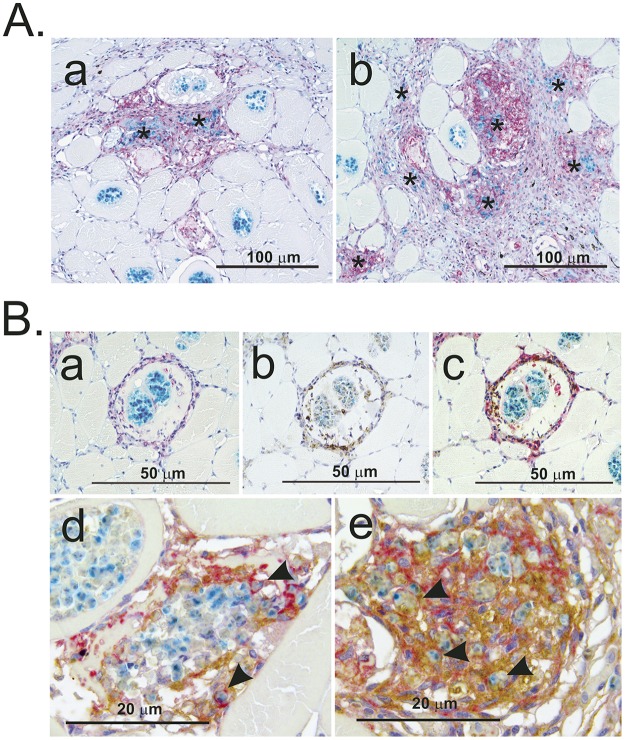
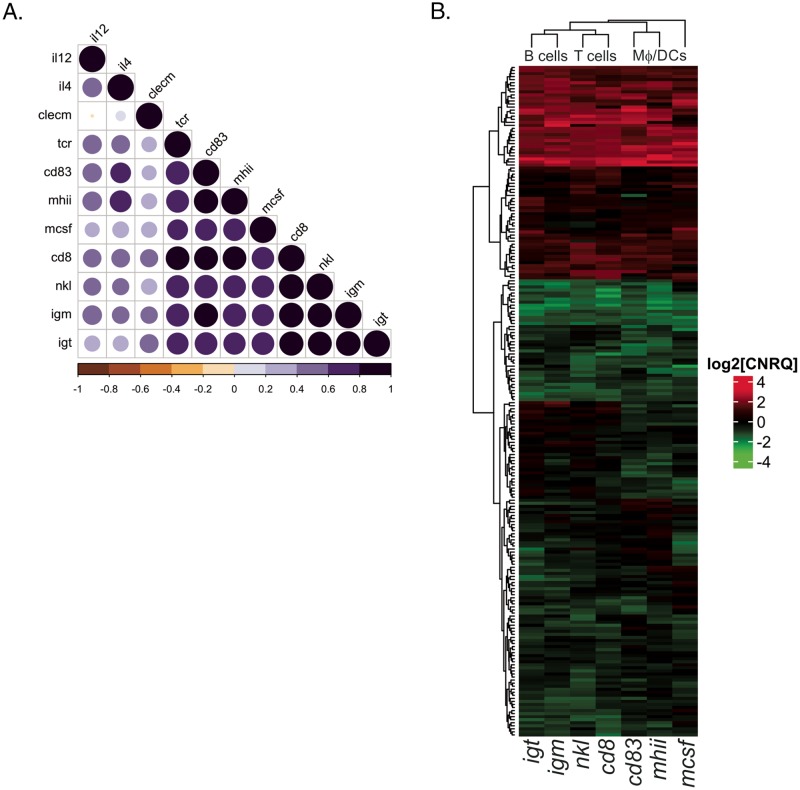
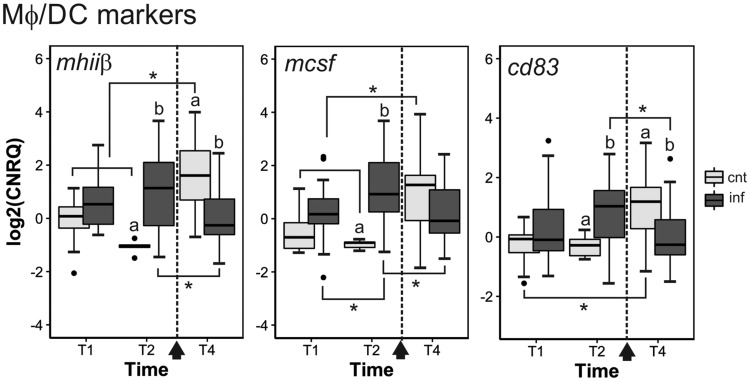
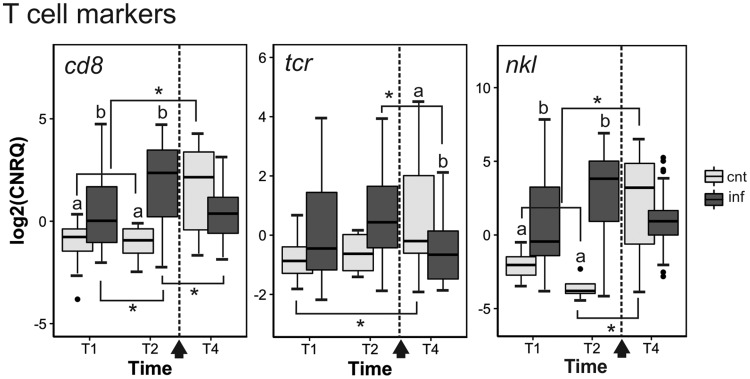
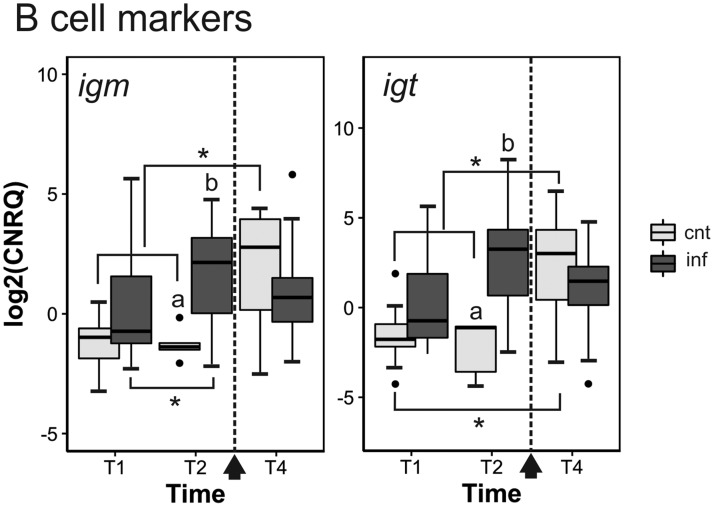
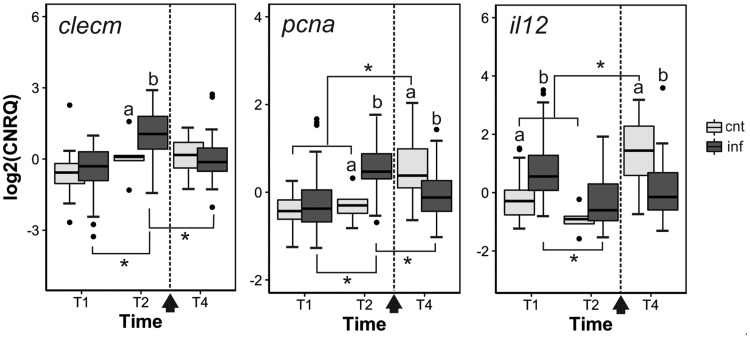
The histozoic myxozoan parasite Kudoa thyrsites causes postmortem myoliquefaction and is responsible for economic losses to salmon aquaculture in the Pacific Northwest. Despite its importance, little is known about the host-parasite relationship, including the host response to infection. The present work sought to characterize the immune response in Atlantic salmon during infection, recovery, and reexposure to K. thyrsites After exposure to infective seawater, infected and uninfected smolts were sampled three times over 4,275 degree-days. Histological analysis revealed infection severity decreased over time in exposed fish, while in controls there was no evidence of infection. Following a secondary exposure of all fish, severity of infection in the controls was similar to that measured in exposed fish at the first sampling time but was significantly reduced in reexposed fish, suggesting the acquisition of protective immunity. Using immunohistochemistry, we detected a population of MHIIβ+ cells in infected muscle that followed a pattern of abundance concordant with parasite prevalence. Infiltration of these cells into infected myocytes preceded destruction of the plasmodium and dissemination of myxospores. Dual labeling indicated a majority of these cells were CD83+/MHIIβ+ Using reverse transcription-quantitative PCR, we detected significant induction of cellular effectors, including macrophage/dendritic cells (mhii/cd83/mcsf), B cells (igm/igt), and cytotoxic T cells (cd8/nkl), in the musculature of infected fish. These data support a role for cellular effectors such as antigen-presenting cells (monocyte/macrophage and dendritic cells) along with B and T cells in the acquired protective immune response of Atlantic salmon against K. thyrsites.

Keywords: Atlantic salmon; Kudoa thyrsites; antigen presentation; cytotoxicity; gene expression; immunohistochemistry; postmortem myoliquefaction.


Figures

FIG 1
FIG 1
(A) Infection severity index of K. thyrsites measured by plasmodia/mm2 in Atlantic salmon muscle samples at 1,985 dd (T1), 3,500 dd (T2), and 4,275 dd (T3), and after secondary exposure at 6,300 dd (T4), in control (Cnt; red) and infected (Inf; blue) fish. (B) RT-qPCR of K. thyrsites 18S rRNA in control and infected fish. Bars represent the mean CT value (±SD). Differences among groups were determined using two-way ANOVA followed by a post hoc Tukey's HSD, with a cutoff P value of <0.01. Significant differences between groups are denoted by lowercase letters. The arrow represents the secondary exposure, where both control and infected fish were exposed to infective salt water for ∼550 dd.
FIG 2
FIG 2
Immune detection of K. thyrsites by MHIIβ+ cells. (A) Photomicrographs of stages of cellular response. In stages 1 and 2, MHIIβ+ cells surround and infiltrate an infected myocyte. In stage 3, MHIIβ+ cells are recruited to the infected myocyte and surround the plasmodia (p) while disintegrating the myocyte. In stage 4, degraded plasmodia (star) and released spores are engulfed by MHIIβ+ cells (red arrowhead). (B) Proportion of stages of detection by MHIIβ+ cells in infected fish at T1 to T4 (InfT1, InfT2, InfT3, and InfT4) and in control fish at T4 (CntT4). (C) Number of MHIIβ+ cells in the musculature of infected salmon over time. The arrow represents the secondary exposure, where both control and infected fish were exposed to infective seawater for ∼550 dd. Significance was determined using a two-way ANOVA followed by post hoc Tukey's HSD with P < 0.05. Lowercase letters denote differences between groups at each sampling time, while an asterisk denotes differences over time in each group.
FIG 3
FIG 3
Photomicrographs of K. thyrsites-infected muscle tissue (T2; 3,500 dd) probed with the monoclonal antibody Sasa CD8α. (A) CD8α+ cells (brown) associated with myocytes containing intact plasmodia (p) as well as with disintegrated myocytes. Positive cells were observed with engulfed myxospores (light blue; arrowhead) (a), infiltrating infected myocytes (arrowhead) (b), or associated with fibrinolytic lesions (asterisk) (c). There appeared to be two morphologies of CD8α+ cells, dendritic-like (d) and lymphocyte-like (e). (B) Dual staining with α-CD8α (red) and α-MHIIβ (brown). Dual-labeled cells were associated with fibrinolytic lesions (a, asterisk) or infiltrating infected myocytes (a and b, arrowheads).
FIG 4
FIG 4
Photomicrographs of K. thyrsites-infected muscle tissue (T2; 3,500 dd) probed with monoclonal antibody Omy CD83 (red). (A, a and b) Positive cells were observed associated with later stages of infection after plasmodia were disintegrated (asterisk) and often with engulfed myxospores. (B) Dual labeling of CD83 (a; red) and MHIIβ (b; brown) revealed most cells were CD83+/MHIIβ+ (c to e; red and brown). Dual-labeled cells were observed at high densities within stage 4 lesions and associated with free myxospores or with engulfed myxospores (arrowheads).
FIG 5
FIG 5
Cluster analysis of all sample-gene combinations. (A) The optimal number of clusters was calculated by the k means gap statistic (k). (B) Cluster plot of all samples using k. This analysis showed 73.4% of the variability in the data set is explained by the time of infection with K. thyrsites. Cluster 1 is comprised of uninfected controls (27.4% and 22.5% for T2 and T1, respectively), reexposed infected fish (34.3%; T4), and infected fish (15.7%; T2). Cluster 2 was comprised of infected fish later in the infection (48.4%; T2) and infected fish after reexposure to K. thyrsites (19.4%; T4), control fish after secondary exposure (16.1%; T4), and infected fish early after primary infection (16.1%; T1). Cluster 3 was comprised of fish early after primary exposure (T1 infected fish, 37.5%; T4 control fish, 25%) and infected fish after reexposure (14.1%; T4).
FIG 6
FIG 6
(A) Correlational matrix of expression profiles for all genes of interest. The colored scale shows degree of correlation ranging from r = −1.00 (orange) to r = 1.00 (purple). The size of the colored circle indicates significance. See Table S1 in the supplemental material for associated r and P values. (B) Hierarchical clustering of log2 CNRQs for cellular markers with high positive correlation. Gene names are labeled on the base of the figure, while hierarchical clustering of the columns based on individual samples shows similar expression profiles of genes associated with particular cell types.
FIG 7
FIG 7
Expression profiles of macrophage/dendritic cell markers (mhii, mcsf, and cd83) in control and infected salmon at T1 (1,985 dd), T2 (3,500 dd), and T4 (6,225 dd). Prior to sampling at T4, both control and infected fish were reexposed (dotted line, arrowhead). Expression differences are represented by log2 calibration-normalized relative quantities (CNRQ), with boxplots and whiskers showing the median expression and 95% confidence intervals, respectively. Statistical differences were detected with a two-way ANOVA followed by a post hoc Tukey's HSD for pairwise comparisons (P < 0.05). Differences between groups are denoted by lowercase letters, while differences over time are denoted by an asterisk.
FIG 8
FIG 8
Expression profiles of T cell markers (cd8, tcr, and nkl) in control and infected salmon at T1 (1,985 dd), T2 (3,500 dd), and T4 (6,225 dd). For interpretation, see the description in the legend to Fig. 7.
FIG 9
FIG 9
Expression profiles of B cell markers (igm and igt) in control and infected salmon at T1 (1,985 dd), T2 (3,500 dd), and T4 (6,225 dd). For interpretation, see the description in the legend to Fig. 7.
FIG 10
FIG 10
Expression profiles of cytokines (il4 and il12) and marker of cellular proliferation (pcna) in control and infected salmon at T1 (1,985 dd), T2 (3,500 dd), and T4 (6,225 dd). For interpretation, see the description in the legend to Fig. 7.

Similar articles

Cited by

References

    1. Wolf K, Markiw ME. 1984. Biology contravenes taxonomy in the Myxozoa: new discoveries show alternation of invertebrate and vertebrate hosts. Science 225:1449–1452. doi:10.1126/science.225.4669.1449. - DOI - PubMed
    1. Chang ES, Neuhof M, Rubinstein ND, Diamant A, Philippe H, Huchon D, Cartwright P. 2015. Genomic insights into the evolutionary origin of Myxozoa within Cnidaria. Proc Natl Acad Sci U S A 112:14912–14917. doi:10.1073/pnas.1511468112. - DOI - PMC - PubMed
    1. Moran JDW, Whitaker DJ, Kent ML. 1999. A review of the myxosporean genus Kudoa Meglitsch, 1947, and its impact on the international aquaculture industry and commercial fisheries. Aquaculture 172:163–196. doi:10.1016/S0044-8486(98)00437-2. - DOI
    1. Hedrick RP, El-Matbouli M, Adkison MA, MacConnell E. 1998. Whirling disease: re-emergence among wild trout. Immunol Rev 166:365–376. doi:10.1111/j.1600-065X.1998.tb01276.x. - DOI - PubMed
    1. Dawson-Coates JA, Chase JC, Funk V, Booy MH, Haines LR, Falkenberg CL, Whitaker DJ, Olafson RW, Pearson TW. 2003. The relationship between flesh quality and numbers of Kudoa thyrsites plasmodia and spores in farmed Atlantic salmon, Salmo salar L. J Fish Dis 26:451–459. doi:10.1046/j.1365-2761.2003.00477.x. - DOI - PubMed

Publication types

MeSH terms

LinkOut - more resources