. 2017 Nov 15;130(22):3878-3890.
doi: 10.1242/jcs.207910. Epub 2017 Oct 9.

Pib2 and the EGO complex are both required for activation of TORC1

Affiliations

Pib2 and the EGO complex are both required for activation of TORC1

Natalia V Varlakhanova et al. J Cell Sci. .

Abstract

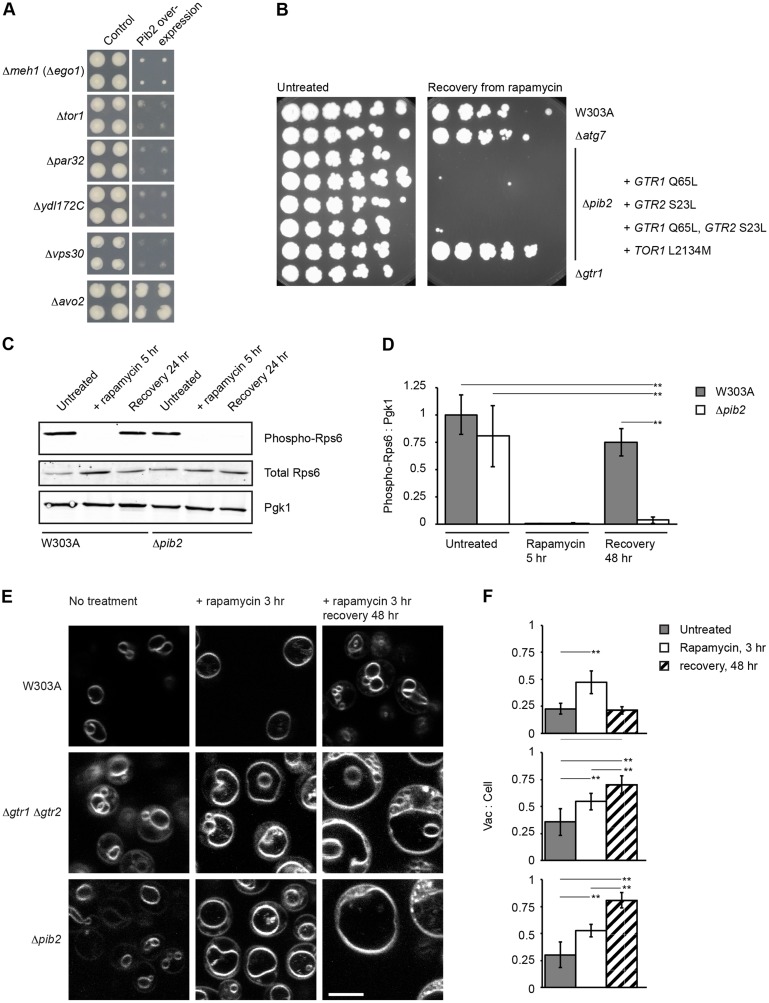
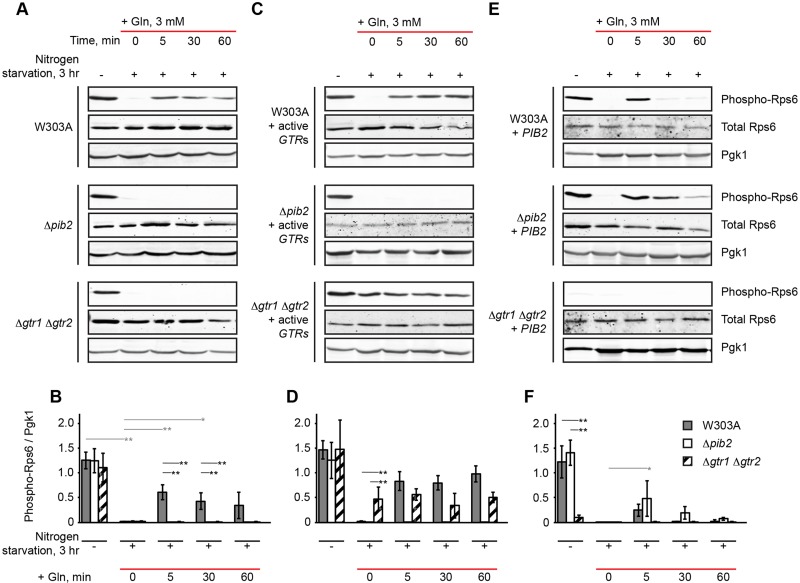
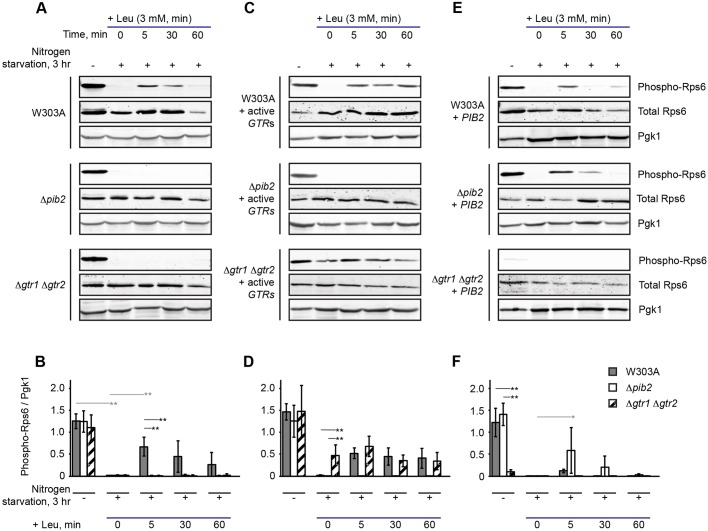
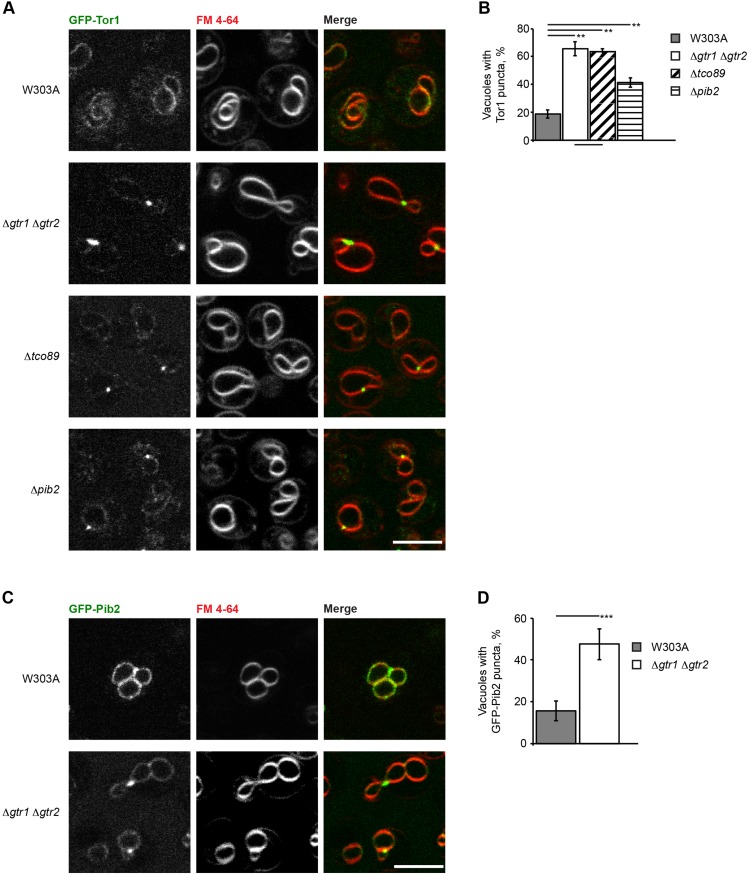
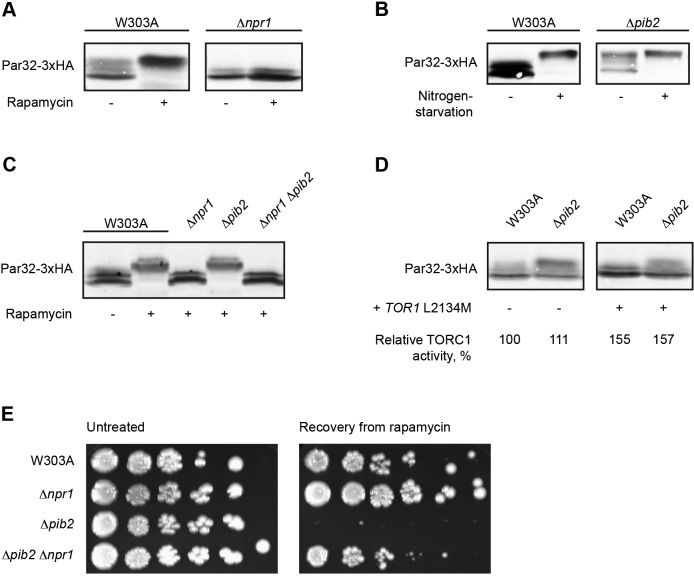
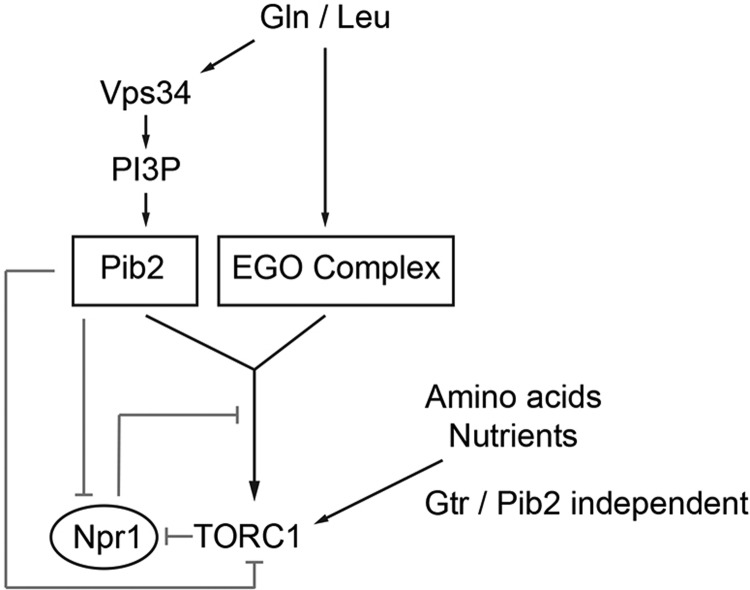
The TORC1 complex is a key regulator of cell growth and metabolism in Saccharomyces cerevisiae The vacuole-associated EGO complex couples activation of TORC1 to the availability of amino acids, specifically glutamine and leucine. The EGO complex is also essential for reactivation of TORC1 following rapamycin-induced growth arrest and for its distribution on the vacuolar membrane. Pib2, a FYVE-containing phosphatidylinositol 3-phosphate (PI3P)-binding protein, is a newly discovered and poorly characterized activator of TORC1. Here, we show that Pib2 is required for reactivation of TORC1 following rapamycin-induced growth arrest. Pib2 is required for EGO complex-mediated activation of TORC1 by glutamine and leucine as well as for redistribution of Tor1 on the vacuolar membrane. Therefore, Pib2 and the EGO complex cooperate to activate TORC1 and connect phosphoinositide 3-kinase (PI3K) signaling and TORC1 activity.

Keywords: EGO complex; Gtr1; Gtr2; Pib2; TORC1.


Conflict of interest statement

Competing interestsThe authors declare no competing or financial interests.

Figures

Fig. 1.
Fig. 1.
Pib2 is required for exit from rapamycin-induced growth arrest. (A) Representative quartets from matched control and Pib2-overexpressing strains in the SDL screen. Overexpression of Pib2 results in synthetic lethality with Δmeh1ego1), Δtor1, Δpar32, Δydl172c and Δvps30 but not with Δavo2, which is shown here as a non-interacting control. (B) Growth of W303A, Δatg7, Δpib2 and Δgtr1 expressing the indicated constructs on YPD during recovery from exposure to rapamycin. Exponentially growing cells (OD600 0.6–0.8) were treated with 200 ng/ml rapamycin in YPD at 30°C for 5 h. After washing, cells were plated on YPD and were incubated for 3 days at 30°C. The left-most spot in each case corresponds to 2 µl of a culture with an OD600 of 0.5. Spots to the right of this correspond to 2 µl of sequential 1:5 serial dilutions. (C) Evaluation of the phosphorylation levels of S232 and S233 of Rps6 in W303A and Δpib2 cells. Cells as indicated were treated with rapamycin as in B. Total Rps6 and Pgk1 levels are shown as loading controls. (D) Quantification of the data presented in C. Ratios of phosphorylated Rps6 to Pgk1 for each measurement (mean±s.d.; n=3 in each case) were normalized to the mean ratio of phosphorylated Rps6 to Pgk1 for untreated W303A cells (set at 1). A two-way ANOVA was conducted to determine the effects of genetic background (W303A and Δpib2) and treatment (untreated, rapamycin treated and recovery) on Rps6 phosphorylation levels. There was a significant interaction effect of background and treatment on Rps6 phosphorylation levels (F2,12=9.46, hence P=0.0034). Selected pairs of values significant by the post-hoc Tukey honest significant difference (HSD) test (**P<0.01) are shown. (E) W303A or the indicated knockout strains were stained with FM 4-64 for 45 min, and then washed and chased in YPD for 1 h prior to visualization. Where indicated, cells were treated with rapamycin (200 ng/ml) for 3 h. For recovery, cells were thoroughly washed and were incubated for 48 h in YPD. Scale bar: 5 µm. (F) Quantification (mean±s.d.) of the increase in vacuolar scaling for the cells shown in E. The maximal vacuolar cross-sectional area was divided by the maximal cellular cross-sectional area. For cells where more than one vacuolar lobe existed (usually only W303A untreated or at 48 h recovery), the maximal cross-sectional area of each lobe was determined. A total of 10–14 vacuoles and cells were measured for untreated and rapamycin-treated cells and 5–10 for cells after recovery. For W303A and the knockout strains, the means of the untreated, treated and recovery measurements were determined to be significantly heterogeneous (one-way ANOVA: W303A F2,31=45.25, hence P<6.39×10⁻¹⁰; Δgtr1 Δgtr2 F2,34=36.62, hence P<7.26×10⁻⁹; Δpib2 F2,26=55.40, hence P<1.01×10⁻⁹). Significantly different pairs of means, as assessed by the post-hoc Tukey HSD test, are indicated (**P<0.01). Non-significantly different means are indicated below the W303A chart (P=0.90).
Fig. 2.
Fig. 2.
Pib2 is required for stimulation of TORC1 activity by glutamine. Phosphorylation levels of Rps6 were evaluated under the indicated conditions. Untreated cells were grown in SC medium. Cells were nitrogen-starved by incubating in SD –N medium for 3 h. For stimulation, cells were treated with SD –N supplemented with glutamine (Gln, 3 mM) and were incubated for the indicated times prior to lysis and processing. Both total Rps6 and Pgk1 are shown as loading controls. (A) W303A, Δpib2, Δgtr1 Δgtr2. (B) Quantification mean of the data shown in A. Gray lines: selected statistically significant differences between means of phospho-Rps6 (Tukey HSD; *P<0.05; **P<0.01). For each cell type, differences in means of phospho-Rps6 were evaluated by one-way ANOVA for each of the treatment conditions. Black lines: selected statistically significant differences between means of phospho-Rps6 (Tukey HSD; *P<0.05; **P<0.01). For each treatment shown, the means of phospho-Rps6 were compared for W303A, Δpib2 and Δgtr1 Δgtr2 by one-way ANOVA. For quantification, the phospho-Rps6 signal was normalized to the corresponding Pgk1 loading control. (C) Strains as in A but expressing Gtr1 Q65L and Gtr2 S23L from their native promoters on centromeric plasmids. (D) Quantification of the data shown in C. (E) Strains as in A but overexpressing Pib2 from an episomal Tet-Off plasmid. Cells were grown in appropriate medium containing 5 µg/ml doxycycline. Cells were diluted and inoculated into doxycycline-free medium for 12 h to allow overexpression of Pib2. The nitrogen starvation and amino acid stimulation were then performed as in A. (F) Quantification of the data shown in E. Results in B, D and F are mean±s.d. (n=3).
Fig. 3.
Fig. 3.
Pib2 is required for stimulation of TORC1 activity by leucine. This work was performed as in Fig. 2, but with leucine (Leu) stimulation (3 mM) instead of glutamine. (A) W303A, Δpib2, Δgtr1 Δgtr2. (B) Quantification of the data shown in A. (C) Strains as in A but expressing Gtr1 Q65L and Gtr2 S23L from their native promoters on centromeric plasmids. (D) Quantification of the data shown in C. (E) Strains as in A but overexpressing Tet-Off PIB2 from an episomal Tet-Off plasmid. (F) Quantification of the data shown in E. Results in B, D and F are mean±s.d. (n=3).
Fig. 4.
Fig. 4.
Pib2 regulates localization of Tor1 on vacuoles. (A) GFP–Tor1 localization in W303A, Δgtr1 Δgtr2, Δtco89 and Δpib2 cells as indicated. The indicated strains expressed GFP–Tor1 from its native promoter on a centromeric plasmid. Cells were grown in SC medium until they reached an OD600 of 0.6–0.8. W303A or the indicated knockout strains were stained with FM 4-64 for 45 min, then washed and chased in YPD for 1 h prior to visualization. (B) Quantification (mean±s.d.) of the numbers of vacuoles displaying GFP–Tor1 foci in each of the indicated strains. Foci were counted on z-stacks collected for each of the strains (from 250 to 400 vacuoles were assessed for each strain). Means of numbers of vacuoles displaying foci were significantly heterogeneous (one-way ANOVA, F4,15=150.45; P<8.77×10⁻¹⁰). A post-hoc Tukey HSD test for significance was performed between each of the means. Selected significant differences between means (**P<0.01) are indicated on the plot and the means showing a non-significant difference (P=0.80) are indicated below the plot. (C) As in A, but with strains as indicated expressing GFP–Pib2. (D) Quantification (mean±s.d.) of the data shown in C. Foci were counted on z-stacks collected for each of the strains (∼250 vacuoles were assessed in each strain). The means of vacuoles displaying foci were significantly different for the two strains (***P<0.001; two-tail t-test with six degrees of freedom; t=7.23, hence, P=0.0003). Scale bars: 5 μm.
Fig. 5.
Fig. 5.
Npr1 is active and is the underlying cause of the defect in recovery from rapamycin exposure in Δpib2 cells. (A) W303A and Δnpr1 cells expressing Par32–3xHA were treated with rapamycin (200 ng/ml) for 3 h as indicated. Par32–3xHA was visualized using an anti-HA monoclonal antibody. (B) W303A and Δpib2 cells expressing Par32–3xHA were nitrogen starved for 3 h. Par32–3xHA was then visualized as in A. (C) The strains as indicated were treated with rapamycin as in A. (D) W303A or Δpib2 cells expressing Par32-3xHA and Tor1 L2134M, as indicated, were grown in SC medium. Par32-3xHA was then visualized as in A. Relative TORC1 activity was calculated based on the phosphorylation levels of Rps6, normalized to a Pgk1 loading control. W303A was set at 100%. (E) Growth of W303A and isogenic strains containing the indicated knockout on YPD during recovery from exposure to rapamycin. Exponentially growing cells (OD600 0.6–0.8) were treated with 200 ng/ml rapamycin in YPD at 30°C for 5 h. After washing, cells were plated on YPD and were incubated for 3 days at 30°C. The left-most spot in each case corresponds to 2 µl of a culture with OD600 0.5. Spots to the right of this correspond to 2 µl of sequential 1:5 serial dilutions.
Fig. 6.
Fig. 6.
Proposed model for control of TORC1 signaling by Pib2 and Gtr1/2. See the Discussion for further details.

Similar articles

Cited by

References

    1. Binda M., Peli-Gulli M.-P., Bonfils G., Panchaud N., Urban J., Sturgill T. W., Loewith R. and De Virgilio C. (2009). The Vam6 GEF controls TORC1 by activating the EGO complex. Mol. Cell 35, 563-573. 10.1016/j.molcel.2009.06.033 - DOI - PubMed
    1. Boeckstaens M., Merhi A., Llinares E., Van Vooren P., Springael J.-Y., Wintjens R. and Marini A. M. (2015). Identification of a novel regulatory mechanism of nutrient transport controlled by TORC1-Npr1-Amu1/Par32. PLoS Genet. 11, e1005382 10.1371/journal.pgen.1005382 - DOI - PMC - PubMed
    1. Bonfils G., Jaquenoud M., Bontron S., Ostrowicz C., Ungermann C. and De Virgilio C. (2012). Leucyl-tRNA synthetase controls TORC1 via the EGO complex. Mol. Cell 46, 105-110. 10.1016/j.molcel.2012.02.009 - DOI - PubMed
    1. Breitkreutz A., Choi H., Sharom J. R., Boucher L., Neduva V., Larsen B., Lin Z. Y., Breitkreutz B. J., Stark C., Liu G. et al. (2010). A global protein kinase and phosphatase interaction network in yeast. Science. 328, 1043-1046. 10.1126/science.1176495 - DOI - PMC - PubMed
    1. Bridges D., Fisher K., Zolov S. N., Xiong T., Inoki K., Weisman L. S. and Saltiel A. R. (2012). Rab5 proteins regulate activation and localization of target of rapamycin complex 1. J. Biol. Chem. 287, 20913-20921. 10.1074/jbc.M111.334060 - DOI - PMC - PubMed

MeSH terms

Substances