. 2017 Dec 4;216(12):4183-4197.
doi: 10.1083/jcb.201703094. Epub 2017 Oct 9.

A Ragulator-BORC interaction controls lysosome positioning in response to amino acid availability

Affiliations

A Ragulator-BORC interaction controls lysosome positioning in response to amino acid availability

Jing Pu et al. J Cell Biol. .

Abstract

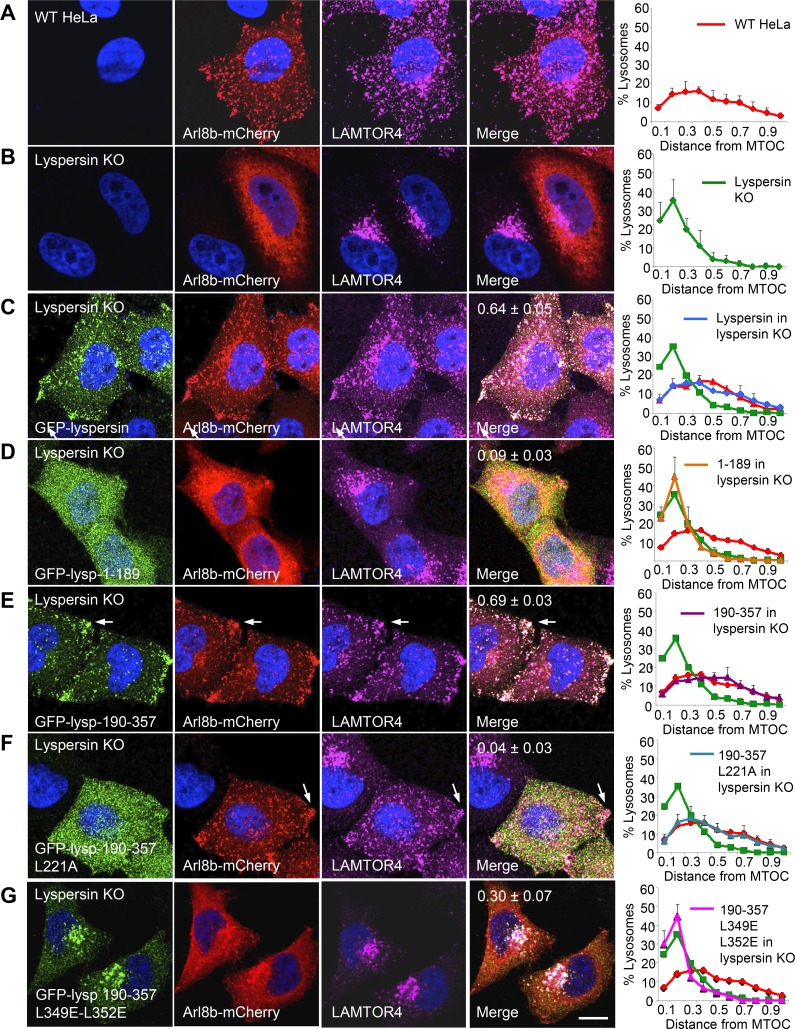
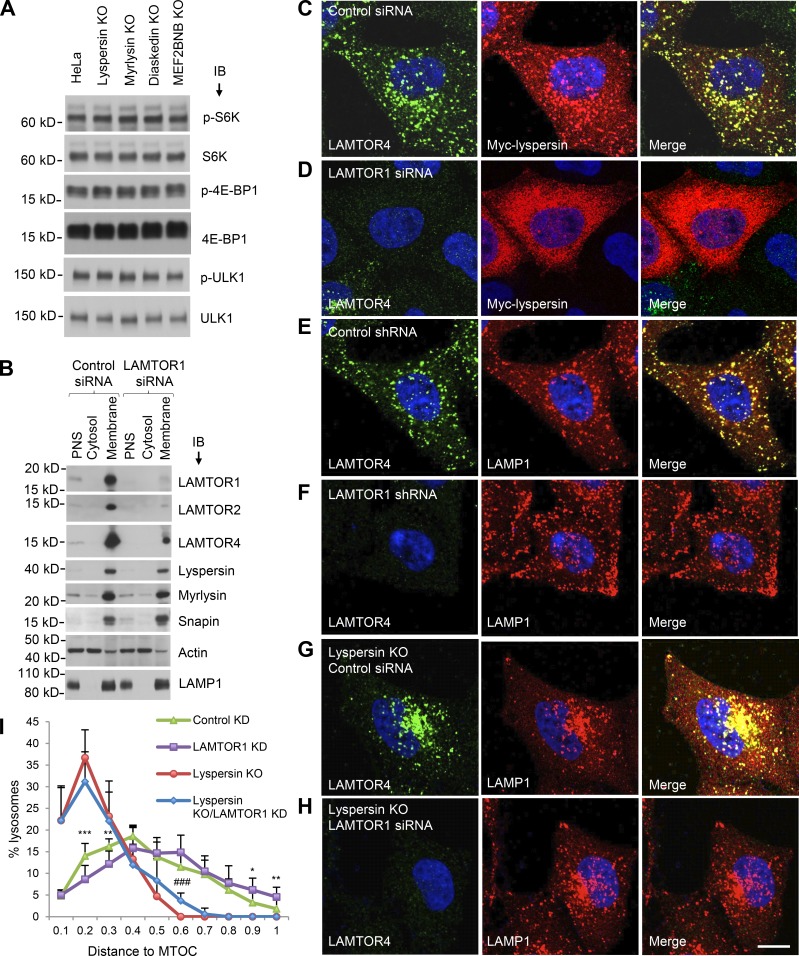
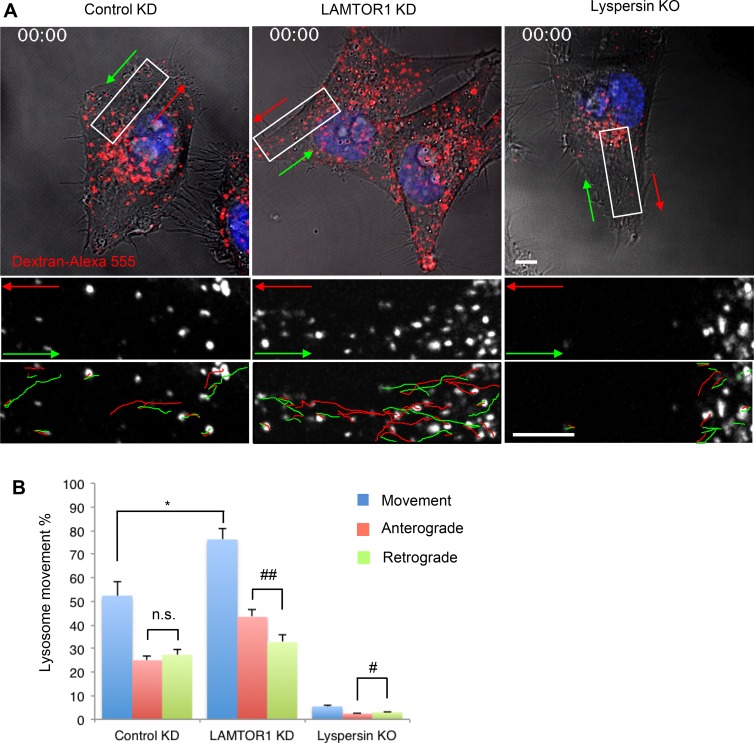
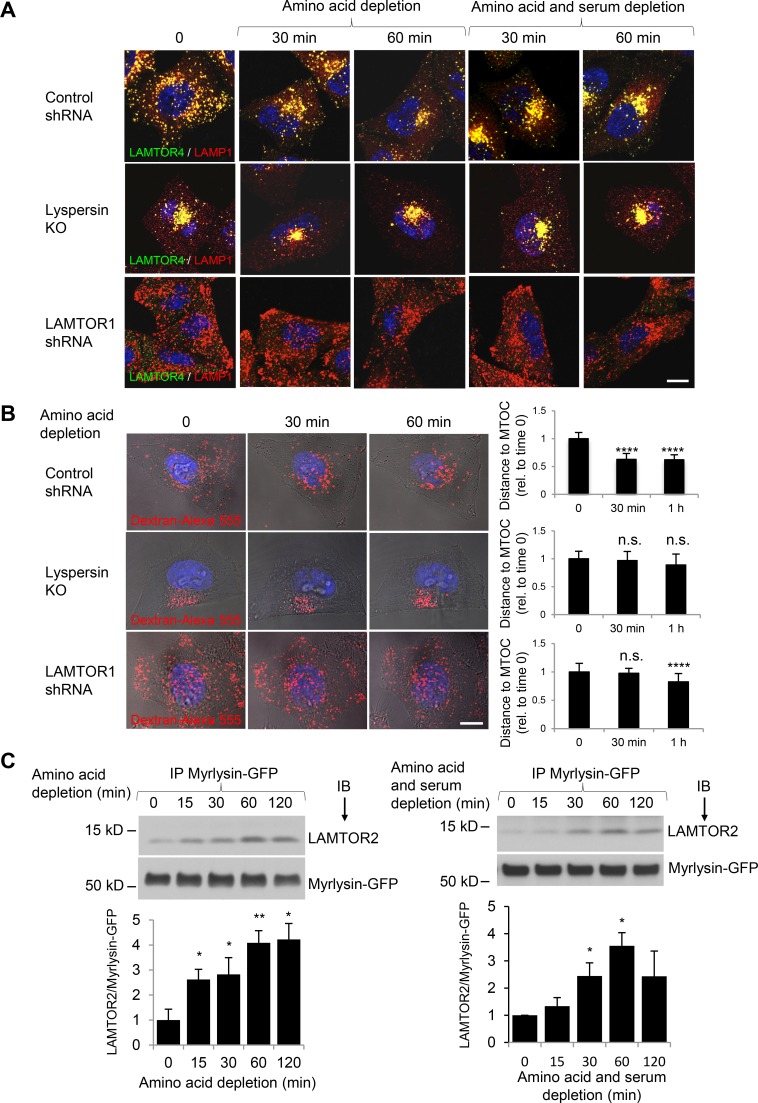
Lysosomes play key roles in the cellular response to amino acid availability. Depletion of amino acids from the medium turns off a signaling pathway involving the Ragulator complex and the Rag guanosine triphosphatases (GTPases), causing release of the inactive mammalian target of rapamycin complex 1 (mTORC1) serine/threonine kinase from the lysosomal membrane. Decreased phosphorylation of mTORC1 substrates inhibits protein synthesis while activating autophagy. Amino acid depletion also causes clustering of lysosomes in the juxtanuclear area of the cell, but the mechanisms responsible for this phenomenon are poorly understood. Herein we show that Ragulator directly interacts with BLOC-1-related complex (BORC), a multi-subunit complex previously found to promote lysosome dispersal through coupling to the small GTPase Arl8 and the kinesins KIF1B and KIF5B. Interaction with Ragulator exerts a negative regulatory effect on BORC that is independent of mTORC1 activity. Amino acid depletion strengthens this interaction, explaining the redistribution of lysosomes to the juxtanuclear area. These findings thus demonstrate that amino acid availability controls lysosome positioning through Ragulator-dependent, but mTORC1-independent, modulation of BORC.


Figures

Figure 1.
Figure 1.
BORC interacts with Ragulator on lysosomes. (A) Proteins that interact with BLOS2 (subunit of both BORC and BLOC-1), lyspersin (subunit of BORC), and pallidin (subunit of BLOC-1) tagged with One-STrEP-FLAG (OSF) or FLAG-One-STrEP (FOS) were identified by TAP-MS. Two independent analyses were performed for OSF-BLOS2 and OSF-lyspersin. Total peptide numbers of the coisolated proteins are shown. (B) OSF- or FOS-tagged BLOS2, lyspersin, pallidin, or LAMTOR1 were expressed by stable transfection in WT HeLa cells, and FOS-tagged myrlysin was expressed by stable transfection in myrlysin-KO HeLa cells. Cells were extracted with detergent-containing buffer and subjected to pull-down with Strep-Tactin beads followed by SDS-PAGE. Endogenous myrlysin and LAMTOR4, and the FLAG epitope, were detected by immunoblotting (IB). The positions of molecular mass markers (in kilodaltons) are indicated on the left. (C) Y2H analysis was performed by cotransforming yeast with plasmids encoding BORC subunits fused to the Gal4 binding domain (BD; top) and Ragulator subunits fused to the Gal4 activation domain (AD; left). In this and subsequent Y2H experiments, yeast transformants were grown on −His (top) or +His (bottom) plates. SV40 T antigen and p53 were used as controls. (D) GFP-lyspersin was transiently expressed by transfection in WT HeLa cells, and lysosomes were visualized by immunostaining with antibodies to endogenous LAMP1 and LAMTOR4. Bar, 5 µm. Magnifications of the boxed area are shown in the bottom row. Bar, 11 µm.
Figure 2.
Figure 2.
BORC–Ragulator interactions are mediated by the lyspersin DUF2365 domain and LAMTOR2. (A) Predicted coiled coils (Coils server, embnet.vital-it.ch/software/COILS_form.html) and consensus secondary structure (NPS@, https://npsa-prabi.ibcp.fr/cgi-bin/npsa_automat.pl?page=/NPSA/npsa_seccons.html) of human lyspersin. Blue, α-helix; red, β-sheet; magenta, random coil structure. Amino acid numbers are indicated. (B) Comparison of the domain organization of lyspersin in different species. DUF2365 comprises two predicted folded segments designated CE1 and CE2. Key residues in CE1 and CE2 and amino acid numbers in the human protein are indicated. H. sapiens, Homo sapiens; X. tropicalis, Xenopus tropicalis; D. rerio, Danio rerio; C. elegans, Caenorhabditis elegans; D. melanogaster, Drosophila melanogaster. (C) GFP or GFP-tagged full-length, truncated, or mutated lyspersin (Lysp) were expressed by transfection into lyspersin-KO HeLa cells. Cells were extracted in detergent and subjected to immunoprecipitation with GFP-Trap beads. Endogenous myrlysin, LAMTOR1, LAMTOR4, and transgenic GFP were detected by immunoblotting (IB). The positions of molecular mass markers (in kilodaltons) are indicated. Arrows indicate the undegraded GFP-fusion proteins. (D and E) Y2H analysis of the interaction of lyspersin constructs fused to Gal4-BD (left) and BORC or Ragulator subunits fused to Gal4-AD (top). “, lyspersin. (F) Structural models generated with UCSF chimera (Pettersen et al., 2004) showing a potential lyspersin-binding site on the reported structure of LAMTOR2-LAMTOR3 (PDB code: 1VET [Kurzbauer et al., 2004]). (Left) Ribbon diagram showing amino acid residues at the potential binding site. (Right) Hydrophobicity surface representation highlights the hydrophobicity of the potential binding site (red patch at the top). Blue for the hydrophilic, to white, and to red for the hydrophobic residues. (G) Y2H analysis of the interaction of lyspersin or LAMTOR3 fused to Gal4-BD (left) and LAMTOR2 or LAMTOR2 mutants fused to Gal4-AD (top).
Figure 3.
Figure 3.
The DUF2365 domain mediates lyspersin recruitment to lysosomes via CE1 and Arl8b recruitment to lysosomes and lysosome dispersal via CE2. (A–G) The full-length or mutant GFP-lyspersin constructs indicated in the figure (see Fig. 2 B for scheme) were transiently expressed together with Arl8b-mCherry by transfection into lyspersin-KO HeLa cells. Fixed cells were immunostained with antibodies to GFP, mCherry, and LAMTOR4. WT (A) or lyspersin-KO (B) HeLa cells expressing Arl8b-mCherry were analyzed similarly as controls. Bar, 10 µm. Arrows point to lysosomes accumulated at peripheral sites. Pearson’s coefficients for the colocalization of GFP-lyspersin variants with Arl8b-mCherry are indicated in the merge images. Graphs on the right represent the distribution of lysosomes relative to the MTOC, normalized to the longest distance between the MTOC and the cell periphery. Values are the mean ± SD from 20 cells per condition. Note that overexpression of Arl8b-mCherry causes lysosomes to be more dispersed than in untransfected cells (Rosa-Ferreira and Munro, 2011; Pu et al., 2015).
Figure 4.
Figure 4.
Ragulator inhibits BORC-mediated lysosome dispersal. (A) WT, lyspersin-KO, myrlysin-KO, diaskedin-KO, or MEF2BNB-KO HeLa cells cultured in regular medium were analyzed by SDS-PAGE and immunoblotting (IB) for phosphorylation (p) of the mTORC1 substrates S6K, 4E-BP1, and ULK1. (B) WT HeLa cells were transfected with nontargeting (control) and LAMTOR1 siRNAs and disrupted without detergent. Cytosolic and membrane fractions were separated by centrifugation of PNS for 1 h at 100,000 g and analyzed by SDS-PAGE and IB for the proteins indicated in the figure. In A and B, the positions of molecular mass markers (in kilodaltons) are indicated on the left. (C–H) shRNA- or siRNA-mediated KD was performed in WT HeLa or lyspersin-KO cells, as indicated in the figure. Nontargeting shRNA or siRNA were used as controls. The distribution of lysosomes and the expression and localization of Ragulator were visualized by immunostaining with antibodies to LAMP1 and LAMTOR4, respectively. Myc-lyspersin was detected by immunostaining for the myc epitope. Bar, 10 µm. (I) Lysosome distribution was quantified in the cells indicated in the figure (n = 13 cells from three independent experiments) using Imaris software. The distance between lysosomes and the MTOC was normalized to the longest distance between the cell periphery and the MTOC. Values are the mean ± SD. LAMTOR1 KD versus control KD, *, P < 0.05; **, P < 0.01; ***, P < 0.001; lyspersin KO or LAMTOR1 KD versus lyspersin KO, ###, P < 0.001 (Student’s t test).
Figure 5.
Figure 5.
Ragulator KD increases anterograde lysosome transport. (A) Control-KD, LAMTOR1-KD, or lyspersin-KO cells were allowed to internalize dextran–Alexa Fluor 555 for 6 h at 37°C, chased overnight, and analyzed by live-cell imaging. Images are the first frames from Videos 1, 2, and 3. Bottom panels are magnified views of the boxed areas. Anterograde and retrograde trajectories are represented by red and green lines, respectively. Bars, 5 µm. (B) Long-range lysosome movement was tracked and quantified with ImageJ from control-KD, LAMTOR1-KD, or lyspersin-KO cells (five cells from five independent experiments). Values are the mean ± SD. *, P < 0.05; n.s., not significant (Student’s t test); #, P < 0.05; ##, P < 0.01 (ANOVA). In addition to changes in lysosome positioning and motility, we noticed that LAMTOR1 KD increased the number of lysosomes, probably because of enhanced lysosome biogenesis induced by mTORC1 inactivation and consequent TFEB activation and nuclear translocation (Settembre et al., 2012).
Figure 6.
Figure 6.
Ragulator regulates lysosome positioning independently of mTORC1. (A) HeLa cells stably transfected with nontargeting (control), LAMTOR1, or RAPTOR shRNAs and cultured in regular medium were analyzed by SDS-PAGE and immunoblotting for phosphorylation (p) of the mTORC1 substrate S6K and levels of LAMTOR1, LAMTOR2, and RAPTOR. The positions of molecular mass markers (in kilodaltons) are indicated on the left. (B) mTOR localization and lysosome distribution in the cells in A was visualized by immunostaining with antibodies to mTOR and LAMP1. Bar, 10 µm. (C) Lysosome distribution in the cells in B (15 cells from three independent experiments for each cell line) was quantified by measuring lysosome-to-MTOC distance using Imaris software and shown as box-and-whisker plots. The ends of whiskers represent the minima and maxima of the data. ****, P < 0.0001; n.s., not significant (ANOVA). (D) HeLa cells were treated with the mTOR inhibitors PP242 (200 nM), rapamycin (2 µM), KU-0063794 (1 µM), or Torin1 (200 nM) or with DMSO (control), for different times at 37°C, and phosphorylation of the indicated mTORC1 substrates was analyzed by SDS-PAGE and immunoblotting. The positions of molecular mass markers (in kilodaltons) are indicated on the left. (E) HeLa cells were treated with mTOR inhibitors for 2 h at 37°C as in D and immunostained for LAMP1. Bar, 10 µm. (F) Quantification of lysosome distribution from 20 cells in three independent experiments such as that in E using Imaris. Data are shown as box-and-whisker plots with minimum and maximum range. n.s., not significant (ANOVA).
Figure 7.
Figure 7.
BORC–Ragulator interactions control lysosome positioning during nutrient starvation. (A) WT HeLa cells transfected with control shRNA or LAMTOR1 shRNA and lyspersin-KO cells were incubated in medium without amino acids, or without amino acids and serum (HBSS), for the indicated times. Cells were immunostained with antibodies to LAMTOR4 and LAMP1. Bar, 10 µm. (B) Cells as in A were allowed to internalize dextran–Alexa Fluor 555 for 6 h at 37°C and chased overnight. Cells were placed in amino acid–depleted medium and imaged live. Each row shows images of the same cell at different times of amino acid starvation. Bar, 10 µm. The distance between lysosomes and the MTOC in control-KD (15 cells from four independent experiments), LAMTOR1-KD (18 cells from four independent experiments), and lyspersin-KO cells (15 cells from three independent experiments) was quantified using Imaris, and the mean ± SD at each time point was normalized to the mean distance at time 0. ****, P < 0.0001; n.s., not significant (ANOVA). (C) Myrlysin-KO HeLa cells stably expressing myrlysin-GFP were incubated in medium lacking amino acids or amino acids and serum. Cells were then subjected to immunoprecipitation (IP) with GFP-Trap beads, followed by immunoblotting (IB) with antibodies to LAMTOR2 and GFP. The positions of molecular mass markers (in kilodaltons) are indicated on the left. Bar graphs show the ratios of LAMTOR2 to myrlysin-GFP quantified by densitometry. Values are the mean ± SD from three independent experiments. *, P < 0.05; **, P < 0.01 (ANOVA).
Figure 8.
Figure 8.
SLC38A9 is required for amino acid regulation of the Ragulator–BORC interaction and lysosome positioning. (A) Control, nontargeting siRNA (C) or siRNA targeting SLC38A9 (SLC) was electroporated into myrlysin-KO HeLa cells stably rescued with myrlysin-GFP. Cells were incubated in medium with or without amino acids (AA) for 60 min and then subjected to immunoprecipitation (IP) with GFP-Trap beads, followed by immunoblotting (IB) with antibodies to LAMTOR2 or GFP. The positions of molecular mass markers (in kilodaltons) are indicated on the left. Bar graphs show the ratios of LAMTOR2 to myrlysin-GFP quantified by densitometry (in arbitrary units). Values are the mean ± SD from three independent experiments. *, P < 0.05 (Student’s t test). (B) Cells were transfected and treated as in A and subjected to immunostaining with antibodies to GFP and LAMP1. Bar, 10 µm. The distribution of lysosomes relative to the MTOC was quantified using Imaris and normalized to the longest distance between the MTOC and the cell periphery. Values are the mean ± SD from 20 cells per condition. (C) Hypothetical model for the regulation of lysosome positioning by Ragulator and BORC. In amino acid–replete conditions, SLC38A9 tightly binds to Ragulator and the Rag GTPases, leading to RagA/B activation and mTORC1 recruitment to the lysosomal membrane. At the same time, SLC38A9 binding weakens the Ragulator–BORC interaction, allowing BORC and Arl8 to recruit kinesins and thus promote anterograde transport of lysosomes. In amino acid–depleted conditions, weakening of the interaction with SLC38A9 causes a conformational change in Ragulator that prevents activation of the Rags and recruitment of mTORC1 to lysosomes, while simultaneously enhancing an inhibitory effect on BORC. This enhancement does not interfere with Arl8 association with lysosomes, but does prevent the recruitment of kinesins to lysosomes, reducing their anterograde transport and leading to their clustering in the juxtanuclear area. The generic kinesin shown in the scheme represents either KIF1B or KIF5B in complex with the corresponding adaptors (Guardia et al., 2016).

Comment in

Similar articles

Cited by

References

    1. Bar-Peled L., Schweitzer L.D., Zoncu R., and Sabatini D.M.. 2012. Ragulator is a GEF for the rag GTPases that signal amino acid levels to mTORC1. Cell. 150:1196–1208. 10.1016/j.cell.2012.07.032 - DOI - PMC - PubMed
    1. Bonifacino J.S., and Neefjes J.. 2017. Moving and positioning the endolysosomal system. Curr. Opin. Cell Biol. 47:1–8. 10.1016/j.ceb.2017.01.008 - DOI - PMC - PubMed
    1. Burnett P.E., Barrow R.K., Cohen N.A., Snyder S.H., and Sabatini D.M.. 1998. RAFT1 phosphorylation of the translational regulators p70 S6 kinase and 4E-BP1. Proc. Natl. Acad. Sci. USA. 95:1432–1437. 10.1073/pnas.95.4.1432 - DOI - PMC - PubMed
    1. Cantalupo G., Alifano P., Roberti V., Bruni C.B., and Bucci C.. 2001. Rab-interacting lysosomal protein (RILP): the Rab7 effector required for transport to lysosomes. EMBO J. 20:683–693. 10.1093/emboj/20.4.683 - DOI - PMC - PubMed
    1. Chan E.Y., Kir S., and Tooze S.A.. 2007. siRNA screening of the kinome identifies ULK1 as a multidomain modulator of autophagy. J. Biol. Chem. 282:25464–25474. 10.1074/jbc.M703663200 - DOI - PubMed

MeSH terms

Associated data