. 2017 Nov 28;37(24):e00328-17.
doi: 10.1128/MCB.00328-17. Print 2017 Dec 15.

Effect of Mutant p53 Proteins on Glycolysis and Mitochondrial Metabolism

Affiliations

Effect of Mutant p53 Proteins on Glycolysis and Mitochondrial Metabolism

Matilda Eriksson et al. Mol Cell Biol. .

Abstract

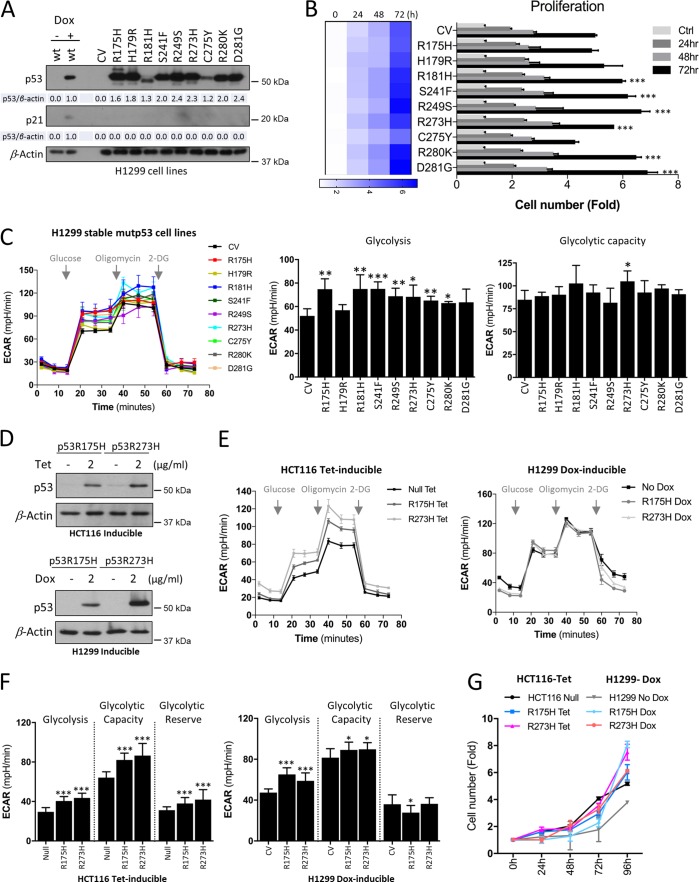
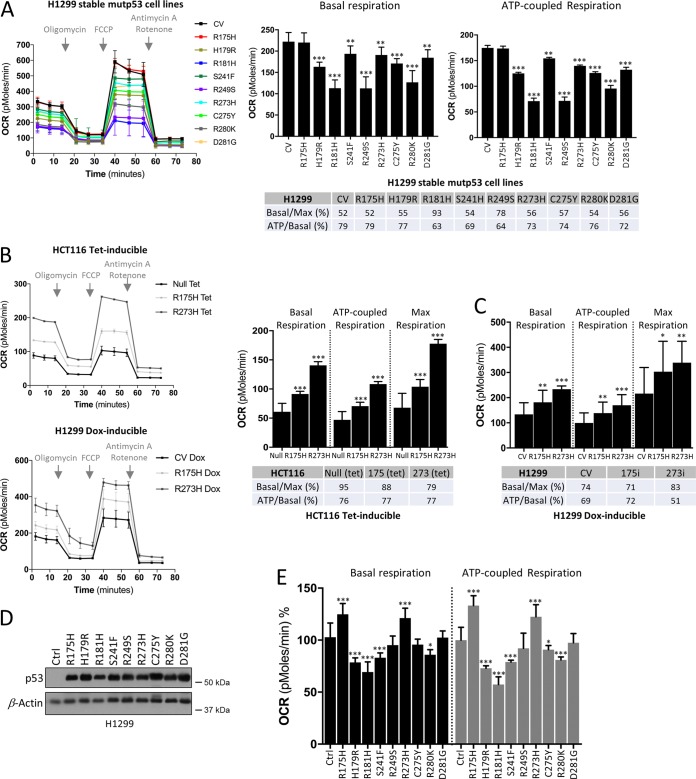
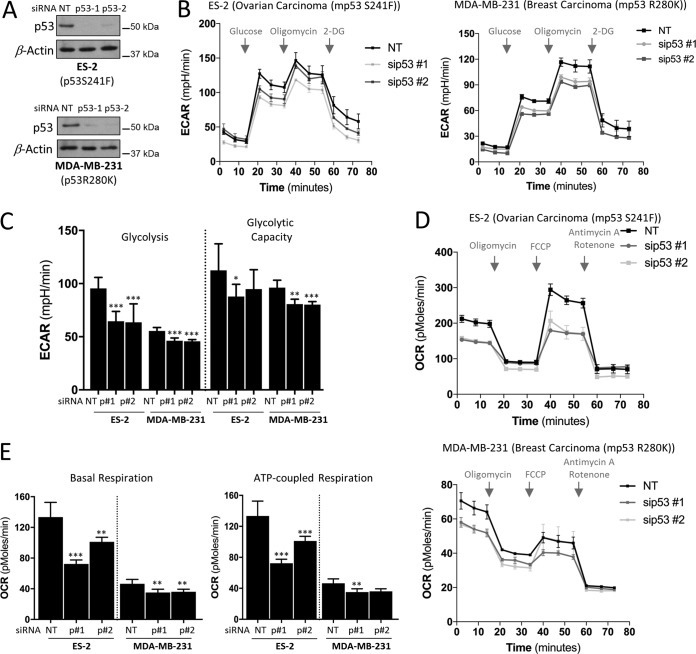
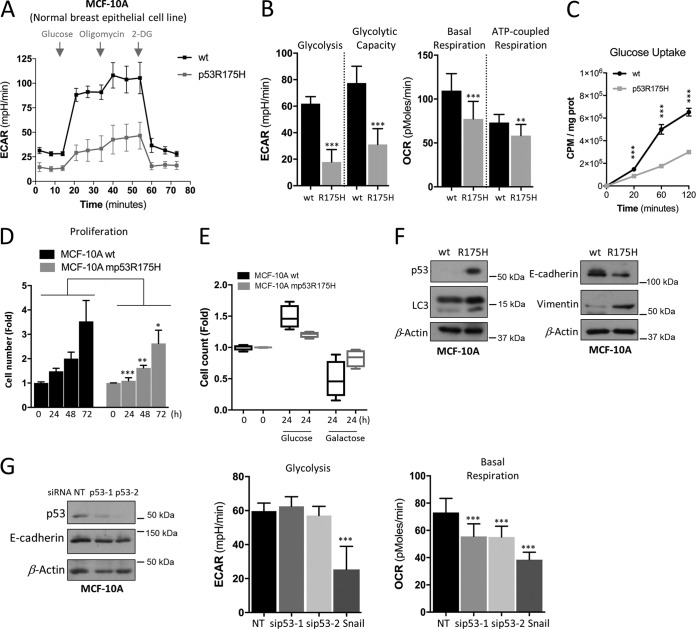
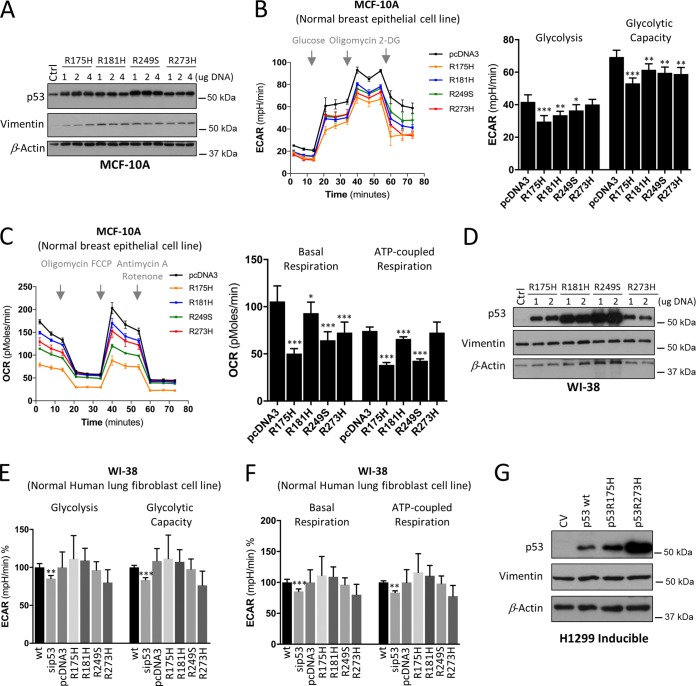
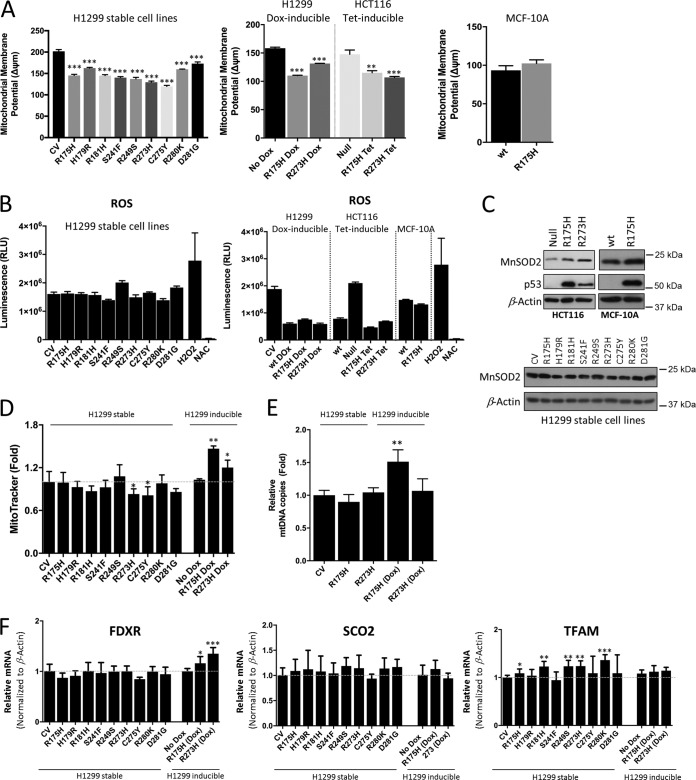
TP53 is one of the most commonly mutated genes in human cancers. Unlike other tumor suppressors that are frequently deleted or acquire loss-of-function mutations, the majority of TP53 mutations in tumors are missense substitutions, which lead to the expression of full-length mutant proteins that accumulate in cancer cells and may confer unique gain-of-function (GOF) activities to promote tumorigenic events. Recently, mutant p53 proteins have been shown to mediate metabolic changes as a novel GOF to promote tumor development. There is a strong rationale that the GOF activities, including alterations in cellular metabolism, might vary between the different p53 mutants. Accordingly, the effect of different mutant p53 proteins on cancer cell metabolism is largely unknown. In this study, we have metabolically profiled several individual frequently occurring p53 mutants in cancers, focusing on glycolytic and mitochondrial oxidative phosphorylation pathways. Our investigation highlights the diversity of different p53 mutants in terms of their effect on metabolism, which might provide a foundation for the development of more effective targeted pharmacological approaches toward variants of mutant p53.

Keywords: EMT; OxPhos; cancer; glycolysis; metabolism; mutant p53.


Figures

FIG 1
FIG 1
Effect of mutant p53 proteins on glycolysis. (A) Western blots showing the expression levels of p53 and p21 (a transcriptional target of wt p53) in H1299 control (CV) and stable expression of indicated mutant p53 proteins. β-Actin was used as a loading control (n = 4). Densitometry analyses of the bands are indicated over β-actin. (B) Cell expansion assay was performed over 3 days to analyze proliferation in stable H1299 cells. Statistical significance is shown for 72 h. (C) Extracellular flux analyzer was used to measure glycolysis and the maximal glycolytic capacity with extracellular acidification rates (ECAR). (D) Western blot analysis of tetracycline (Tet)- or doxycycline (Dox)-induced expression of p53R175H and p53R273H mutants in HCT116 or H1299 cells, respectively. β-Actin was used as a loading control. (E) Mutant expression was induced as described for panel D, and ECAR were analyzed in HCT116 and H1299 inducible cell lines. (F) ECAR of glycolysis, maximal glycolytic capacity, and glycolytic reserve in inducible HCT116 or H1299 cells. (G) Cell expansion assay was performed over 4 days to analyze proliferation in inducible HCT116 and H1299 cells. Data are expressed as means ± SD (n = 3 to 7). Statistical significance is shown above the level for the control. *, P < 0.05; **, P < 0.001; ***, P < 0.0001; two-tailed Student's t test.
FIG 2
FIG 2
Effect of mutant p53 proteins on mitochondrial metabolism. (A to C) Measurement of mitochondrial oxygen consumption rates (OCRs) in stable H1299 cell lines (A) and in tetracycline (Tet)- or doxycycline (Dox)-induced expression of p53R175H and p53R273H mutants in HCT116 or H1299 cells, respectively (B and C). OCR values of maximal respiration and ATP generated per consumed oxygen level were calculated. (D) Western blot of p53 in H1299 control (CV) cells with transient expression of the indicated mutant p53 proteins. β-Actin was used as a loading control. (E) Mutant p53 expression was induced as described for panel D, and mitochondrial OCRs were analyzed. Data are expressed as means ± SD (n = 3). Statistical significance is shown above the level for the control. *, P < 0.05; **, P < 0.001; ***, P < 0.0001; two-tailed Student's t test.
FIG 3
FIG 3
Effects of endogenous mutant p53 proteins on metabolism. (A) Western blots showing the NT (nontargeting) and p53 siRNA knockdown efficiency by two independent siRNAs targeting p53 in ovarian cancer ES-2 (p53S241F) and breast cancer MDA-MB-231 (p53R280K) cell lines. β-Actin was used as a loading control. (B and C) Cells were depleted of mutant p53 proteins as described for panel A and prior to analysis of the ECAR (B) and ECAR values of glycolysis and maximal glycolytic capacity (C). 2-DG, 2-deoxyglucose. (D) OCR analysis upon siRNA depletion of endogenous p53 levels as described for panel A. (E) OCR values of basal respiration and of ATP generated per consumed oxygen. Data are expressed as means ± SD (n = 3). Statistical significance is shown above the level of the control. *, P < 0.05; **, P < 0.001; ***, P < 0.0001; two-tailed Student's t test.
FIG 4
FIG 4
p53R175H mutant in nontumorigenic MCF-10A cells suppresses both glycolysis and mitochondrial metabolism. (A and B) Seahorse measurements of ECAR and OCR in parental (wt) and stable mutant p53 (p53R175H) expressing normal breast epithelial cell line MCF-10A cells. (C) Glucose uptake in parental (wt p53) and mutant p53R175H MCF-10A cells. (D) Cell expansion assay performed over 3 days to analyze proliferation in wt and stably expressing mutant p53R175H MCF-10A cells. (E) The effect of galactose on cell expansion in wt and stably expressing mutant p53R175H MCF-10A cells compared to glucose. (F) Western blots showing p53 expression, E-cadherin and vimentin (EMT markers), and LC-3 (autophagy marker). β-Actin was used as a loading control. (G) Western blots showing the NT (nontargeting) and p53 siRNA knockdown efficiency of p53 and E-cadherin expression in wt MCF-10A cells and measurements of ECAR and OCR following siRNA-mediated knockdown compared to that of NT or stably expressing Snail MCF-10A cells. ECAR values of glycolysis and maximal glycolytic capacity, as well as of basal versus maximal respiration and of ATP generated per consumed oxygen, are presented. Data are expressed as means ± SD (n = 3). Statistical significance is shown above the level for the control. *, P < 0.05; **, P < 0.001; ***, P < 0.0001; two-tailed Student's t test.
FIG 5
FIG 5
Effect of mutant p53 proteins on glycolysis and mitochondrial metabolism in normal cells. (A) Western blots showing the expression of p53 and vimentin following transient expression of p53 mutants (p53R175H, p53R181H, p53R249S, and p53R273H) using 1, 2, or 4 μg DNA, as indicated, in normal breast epithelial MCF-10A cells. β-Actin was used as a loading control. (B and C) MCF-10A cells as described for panel A were analyzed for ECAR (B) and OCR (C). (D) Western blots showing the expression of p53 and vimentin following transient expression of p53 mutants (p53R175H, p53R181H, p53R249S, and p53R273H) using 1 or 2 μg DNA, as indicated, in the normal nontransformed lung fibroblast WI-38 line. β-Actin was used as a loading control. (E and F) Measurements of ECAR (E) and OCR (F) following siRNA-mediated knockdown and p53 mutant overexpression compared to that of wt or pcDNA3 in WI-38 cells. (G) Western blots showing the expression of p53 and vimentin in Dox-induced expression of wt and p53R175H and p53R273H mutants in H1299 cells. Data are expressed as means ± SD (n = 3). Statistical significance is shown above the level for the control (wt or pcDNA). *, P < 0.05; **, P < 0.001; ***, P < 0.0001; two-tailed Student's t test.
FIG 6
FIG 6
Impact of mutant p53 on mitochondrial functions. (A) Mitochondrial membrane potential measured by TMRE in the indicated cell lines. (B) Measurements of intracellular ROS production in the indicated cell lines. H2O2 and NAC were used as positive and negative controls, respectively. (C) Western blots showing the expression of MnSOD2 and p53 in the inducible p53R175H and p53R273H HCT116 and wt and stable p53R175H MCF-10A cells, as well as in the stable mutant p53-expressing H1299 cells. β-Actin was used as a loading control. (D) Mitochondrial content measurement using MitoTracker. (E) Mitochondrial DNA copy number analysis in the inducible and stable mutant p53-expressing H1299 cell lines. (F) qPCR data showing the expression of TFAM (mitochondrial biogenesis), SCO2 (complex I-IV assembly), and FDXR (initiates electron transfer within the electron transport chain) in the indicated mutant p53-expressing H1299 cells. Data are expressed as means ± SD (n = 3). Statistical significance is shown above the level for the control. *, P < 0.05; **, P < 0.001; ***, P < 0.0001; two-tailed Student's t test.

Similar articles

Cited by

References

    1. Kupryjanczyk J, Thor AD, Beauchamp R, Merritt V, Edgerton SM, Bell DA, Yandell DW. 1993. p53 gene mutations and protein accumulation in human ovarian cancer. Proc Natl Acad Sci U S A 90:4961–4965. doi:10.1073/pnas.90.11.4961. - DOI - PMC - PubMed
    1. Olive KP, Tuveson DA, Ruhe ZC, Yin B, Willis NA, Bronson RT, Crowley D, Jacks T. 2004. Mutant p53 gain of function in two mouse models of Li-Fraumeni syndrome. Cell 119:847–860. doi:10.1016/j.cell.2004.11.004. - DOI - PubMed
    1. Jacks T, Remington L, Williams BO, Schmitt EM, Halachmi S, Bronson RT, Weinberg RA. 1994. Tumor spectrum analysis in p53-mutant mice. Curr Biol 4:1–7. - PubMed
    1. Oren M, Rotter V. 2010. Mutant p53 gain-of-function in cancer. Cold Spring Harb Perspect Biol 2:a001107. doi:10.1101/cshperspect.a001107. - DOI - PMC - PubMed
    1. Muller PA, Caswell PT, Doyle B, Iwanicki MP, Tan EH, Karim S, Lukashchuk N, Gillespie DA, Ludwig RL, Gosselin P, Cromer A, Brugge JS, Sansom OJ, Norman JC, Vousden KH. 2009. Mutant p53 drives invasion by promoting integrin recycling. Cell 139:1327–1341. doi:10.1016/j.cell.2009.11.026. - DOI - PubMed

Substances