. 2017 Nov 28;37(24):e00274-17.
doi: 10.1128/MCB.00274-17. Print 2017 Dec 15.

Lamin B2 Modulates Nucleolar Morphology, Dynamics, and Function

Affiliations

Lamin B2 Modulates Nucleolar Morphology, Dynamics, and Function

Ayantika Sen Gupta et al. Mol Cell Biol. .

Abstract

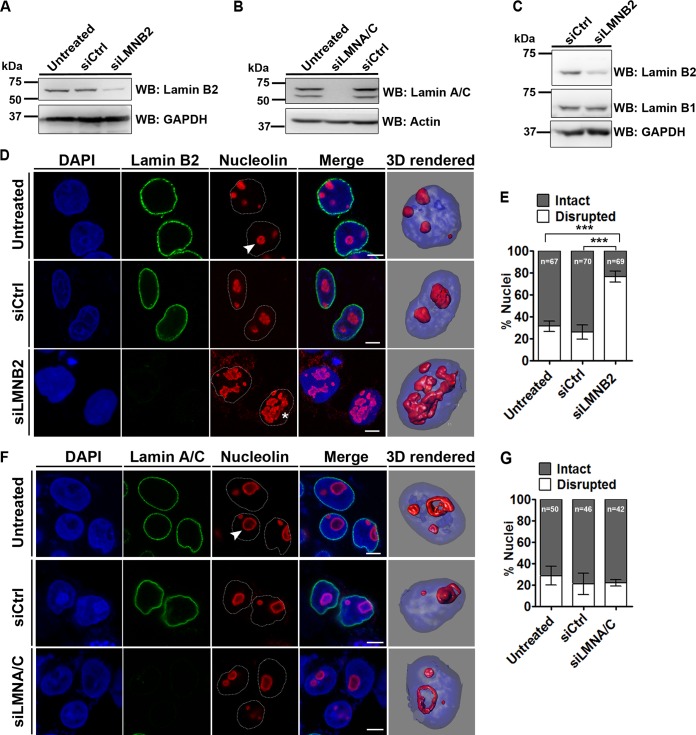
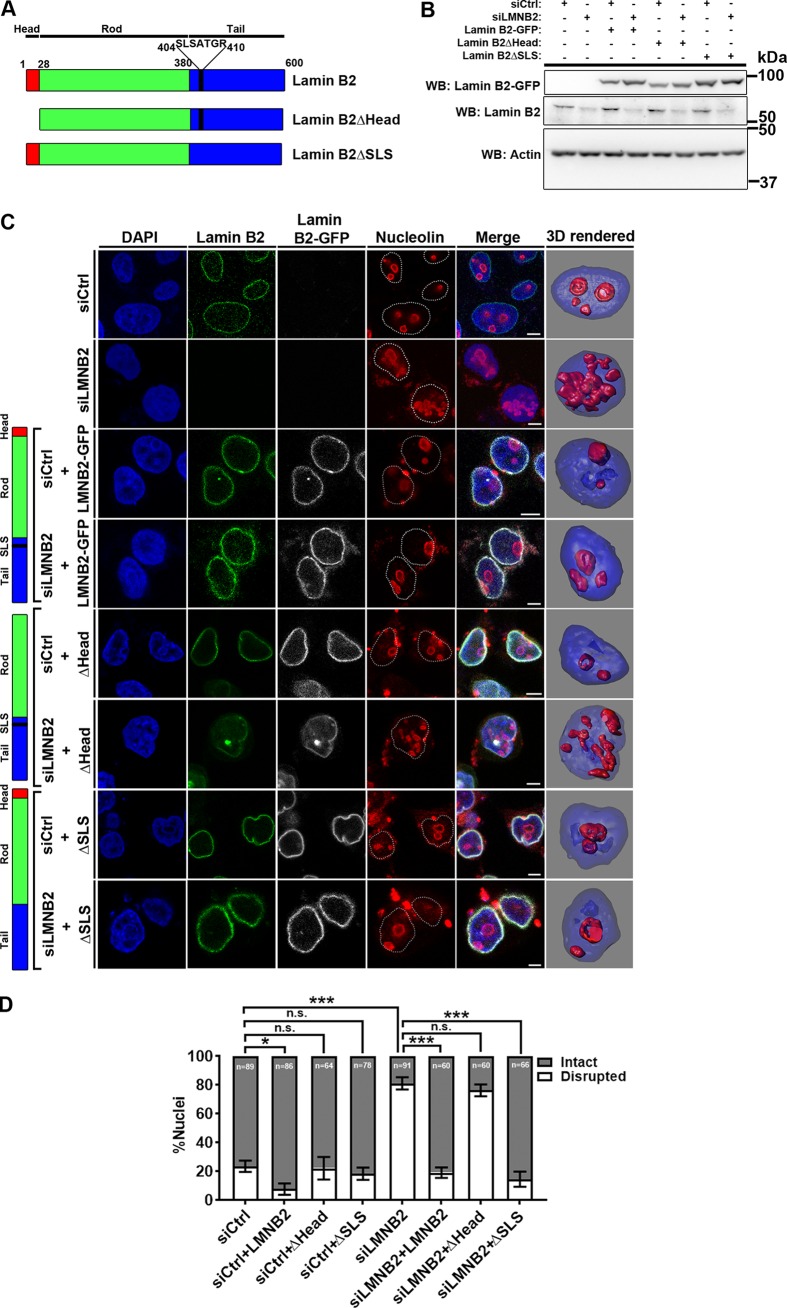
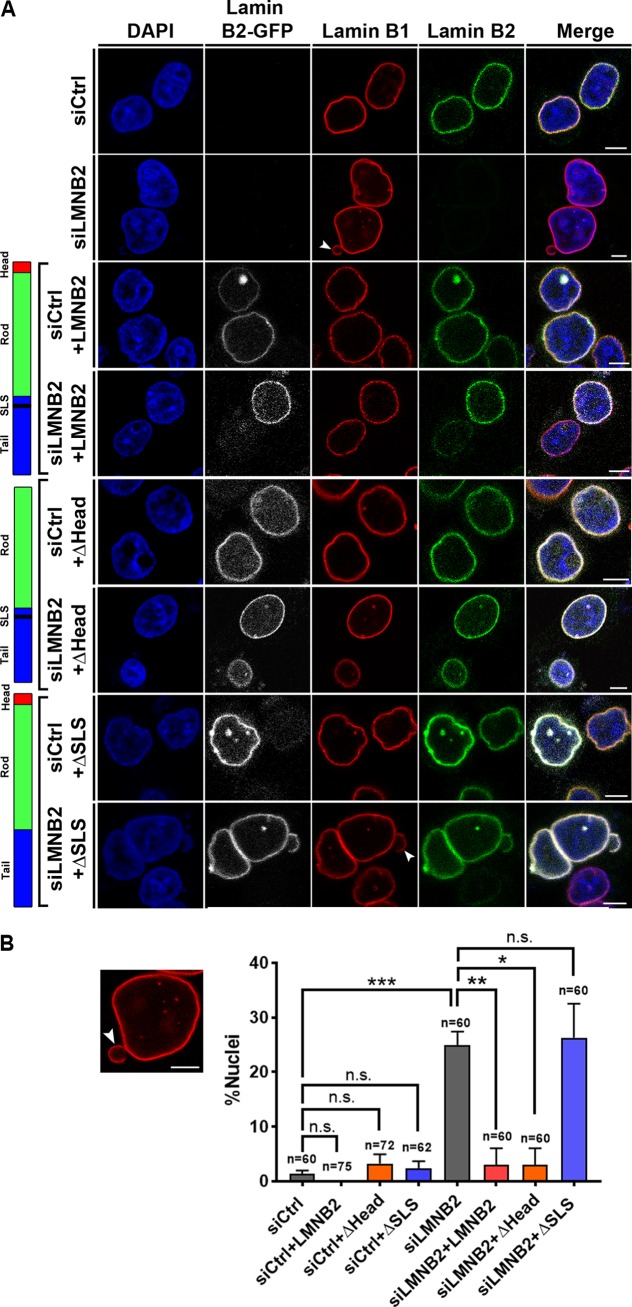
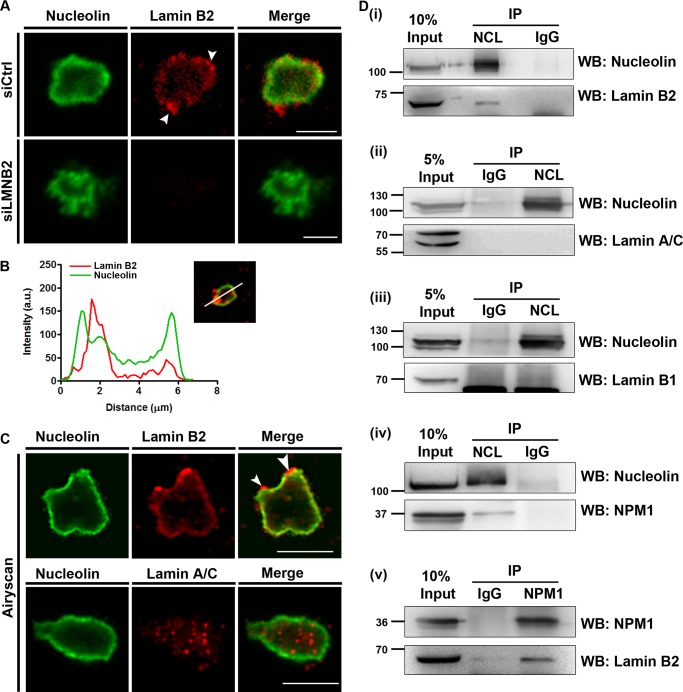
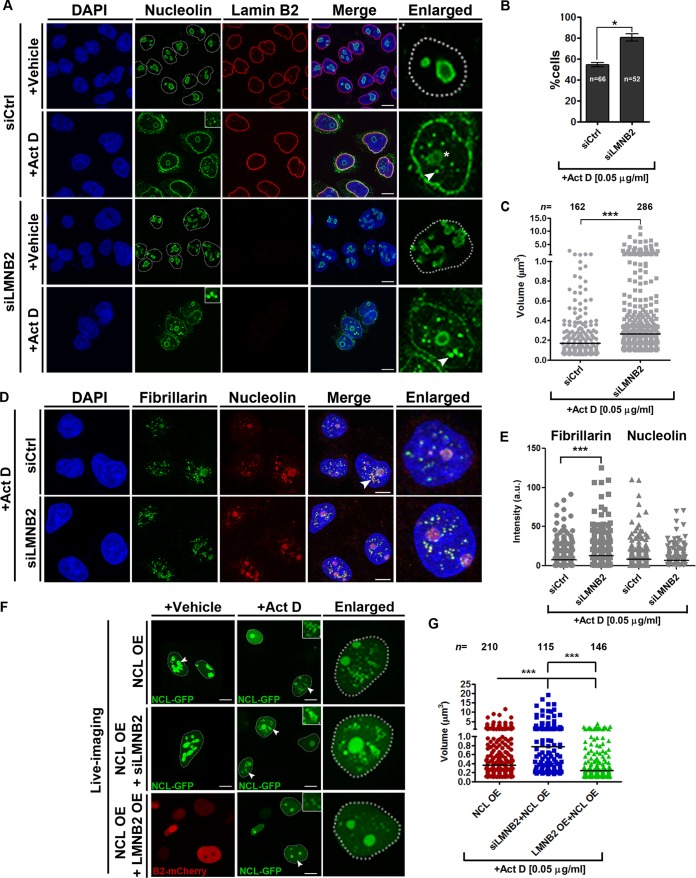
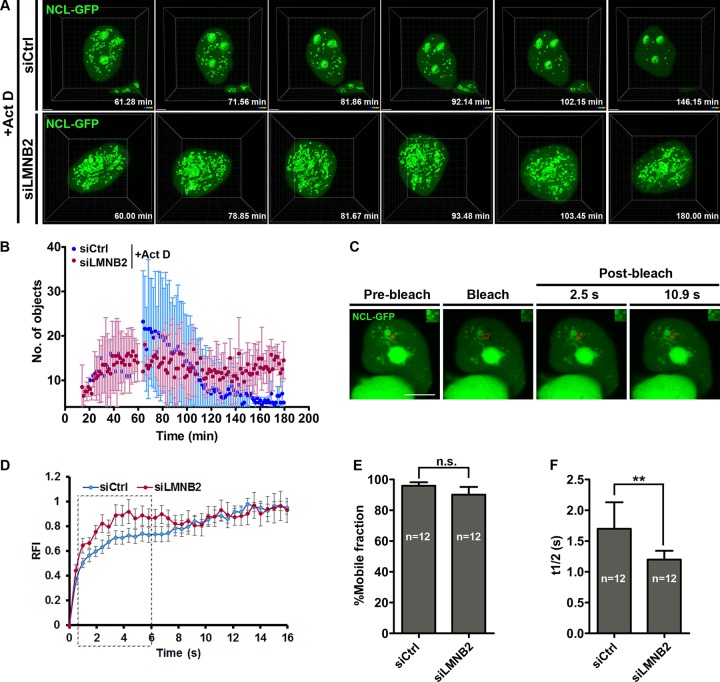
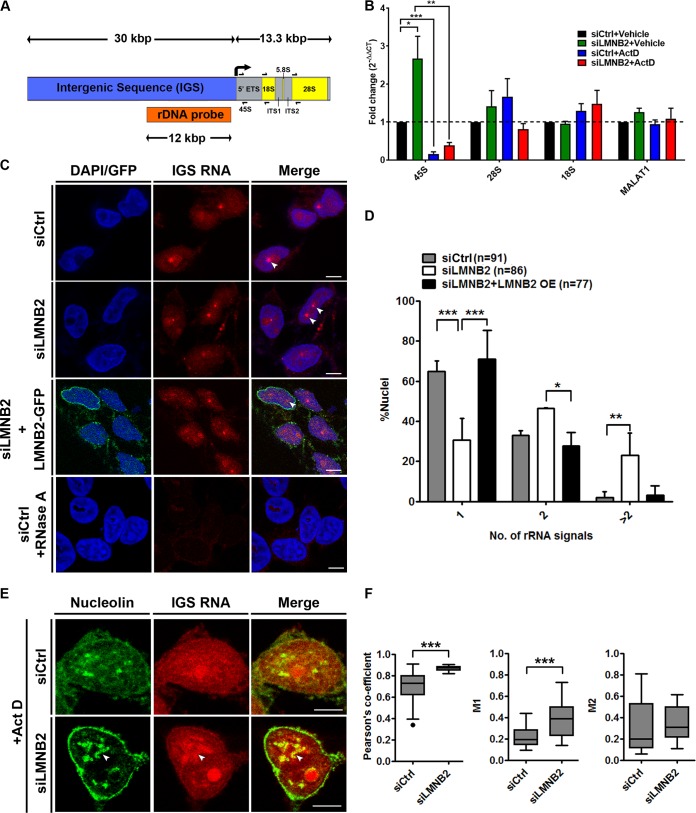
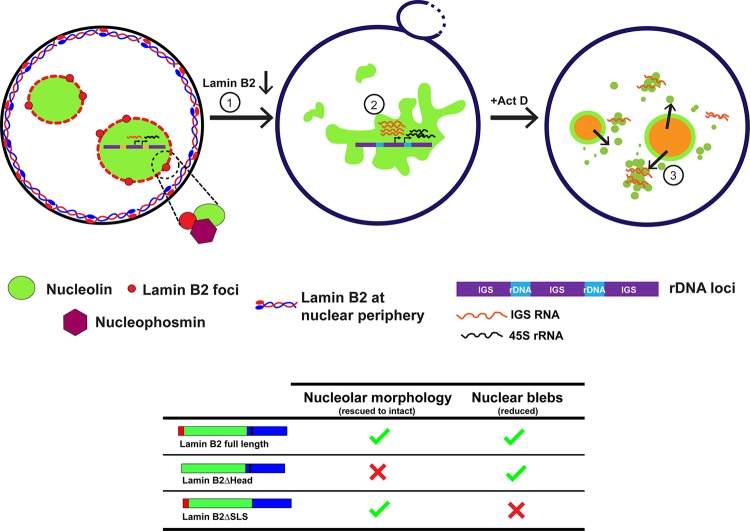
The nucleolus is required for ribosome biogenesis. Human cells have 2 or 3 nucleoli associated with nucleolar organizer region (NOR)-bearing chromosomes. An increase in number and altered nucleolar morphology define cancer cells. However, the mechanisms that modulate nucleolar morphology and function are unclear. Here we show that in addition to localizing at the nuclear envelope, lamin B2 localizes proximal to nucleolin at the granular component (GC) of the nucleolus and associates with the nucleolar proteins nucleolin and nucleophosmin. Lamin B2 knockdown severely disrupted the nucleolar morphology, which was rescued to intact and discrete nucleoli upon lamin B2 overexpression. Furthermore, two mutually exclusive lamin B2 deletion mutants, ΔHead and ΔSLS, rescued nuclear and nucleolar morphology defects, respectively, induced upon lamin B2 depletion, suggesting independent roles for lamin B2 at the nucleolus and nuclear envelope. Lamin B2 depletion increased nucleolin aggregation in the nucleoplasm, implicating lamin B2 in stabilizing nucleolin within the nucleolus. Lamin B2 knockdown upregulated nucleolus-specific 45S rRNA and upstream intergenic sequence (IGS) transcripts. The IGS transcripts colocalized with aggregates of nucleolin speckles, which were sustained in the nucleoplasm upon lamin B2 depletion. Taken together, these studies uncover a novel role for lamin B2 in modulating the morphology, dynamics, and function of the nucleolus.

Keywords: lamin; nucleolin; nucleolus; nucleophosmin; nucleus; rDNA; rRNA.


Figures

FIG 1
FIG 1
Lamin B2 depletion disrupts nucleolar morphology. (A and B) Western blots (WB) showing siRNA-mediated depletion of lamin B2 (A) and lamin A/C (B). (C) Lamin B1 levels are unaltered upon lamin B2 knockdown. Loading controls were GAPDH (glyceraldehyde-3-phosphate dehydrogenase) and actin. (D) Coimmunostaining of lamin B2 and nucleolin in DLD-1 cells. DAPI counterstains the nucleus. Untreated cells, lamin B2 knockdown cells (siLMNB2), or cells treated with nontargeting siRNA (siCtrl) were used. Representative confocal images of control cells show discrete and intact nucleoli (arrowhead), and siLMNB2 shows disrupted nucleolar morphology (asterisk) (also shown in 3D reconstructions). Scale bars, ∼5 μm. (E) Quantification of nucleolar morphologies shows a significant increase in disrupted nucleoli upon lamin B2 knockdown (***, P < 0.001 by Fisher's exact test of proportions) (number of independent biological replicates [N] = 3; n, number of nuclei). Error bars indicate standard errors of means (SEM). (F) Coimmunostaining of lamin A/C and nucleolin. No change in nucleolar morphology was observed upon siLMNA/C (arrowhead) or siCtrl treatment (also shown in 3D reconstructions). Scale bars, ∼5 μm. (G) Quantification of nucleolar morphologies upon lamin A/C knockdown (P > 0.05 by Fisher's exact test of proportions) (N = 2; n, number of nuclei). Error bars indicate standard deviations (SD).
FIG 2
FIG 2
The lamin B2 head domain maintains nucleolar morphology. (A) Schematic representation of full-length lamin B2 with the N-terminal head domain, central rod domain, and C-terminal tail domain. The lamin B2ΔHead mutant lacks the head domain (aa 1 to 28) from the N terminus. The lamin B2ΔSLS mutant lacks the sequence SLSATGR (aa 404 to 410) from the tail domain of lamin B2. (B) Western blot showing overexpression of siRNA-resistant full-length lamin B2-GFP, lamin B2ΔHead-GFP, and lamin B2ΔSLS-GFP mutants in control and lamin B2-depleted cells. The loading control was actin. (C) Immunofluorescence staining of nucleolin, showing the nucleolar morphology in control and lamin B2-depleted cells overexpressing (i) full-length lamin B2-GFP (+LMNB2), (ii) lamin B2ΔHead (+ΔHead), and (iii) lamin B2ΔSLS (+ΔSLS) constructs. Scale bars, ∼5 μm. (D) Intact nucleolar morphology was restored upon overexpression of full-length lamin B2 (siLMNB2+LMNB2) and lamin B2ΔSLS (siLMNB2+ΔSLS) but not upon overexpression of lamin B2ΔHead (siLMNB2+ΔHead). (*, P < 0.05; ***, P < 0.001; n.s., not significant [by Fisher's exact test of proportions]) (number of independent biological replicates [N] = 3; n, number of nuclei). Error bars indicate SEM.
FIG 3
FIG 3
The SLSATGR sequence in the lamin B2 tail domain maintains nuclear morphology. (A) Immunofluorescence staining of lamin B1, showing the nuclear morphology in control and lamin B2-depleted cells overexpressing full-length lamin B2-GFP (+LMNB2), (ii) lamin B2ΔHead (+ΔHead), and (iii) lamin B2ΔSLS (+ΔSLS) constructs. Control cells show ellipsoidal nuclei with uniform lamin B1 staining at the nuclear periphery. Lamin B2-depleted cells show nuclear blebs that partially stain for lamin B1 (arrowhead). Scale bars, ∼5 μm. (B) The incidence of nuclear blebs in lamin B2 depleted cells was reduced upon overexpression of full-length lamin B2 (siLMNB2+LMNB2) and lamin B2ΔHead (siLMNB2+ΔHead) but not upon overexpression of lamin B2ΔSLS (siLMNB2+ΔSLS). (*, P < 0.05; **, P < 0.01; ***, P < 0.001 [by Student's t test]) (number of independent biological replicates [N] = 3; n, number of nuclei). Error bars indicate SEM.
FIG 4
FIG 4
Lamin B2 associates with the nucleolus. (A) Isolated nucleoli were immunostained for lamin B2 and nucleolin. Nucleolin localizes largely at the nucleolar edge. Lamin B2 foci were enriched at the nucleolar periphery (siCtrl panel, arrowheads). The absence of lamin B2 staining in nucleoli isolated from lamin B2-depleted cells (siLMNB2 panel) shows the specificity of lamin B2 staining at the nucleolus. Scale bars, ∼5 μm. (B) A representative line scan across an isolated nucleolus shows lamin B2 (red line) enrichment near the edge of the nucleolus marked by nucleolin (green line). (C) Superresolution Airyscan images of isolated nucleoli immunostained for nucleolin, lamin B2, and lamin A/C. Lamin B2 is enriched at the nucleolar border (arrowheads), while lamin A/C foci localize in the nucleolar interior. Scale bars, ∼5 μm. (D) (i) Coimmunoprecipitation of lamin B2 with nucleolin (NCL). Negative control, IgG. (ii and iii) Lamin A/C (ii) and lamin B1 (iii) do not coimmunoprecipitate with nucleolin. (iv) Nucleolin pulls down NPM1, which serves as a positive control. (v) Lamin B2 coimmunoprecipitates with NPM1. Co-IP experiments were performed in three independent biological replicates for lamin B2 and two independent biological replicates for lamin A/C and lamin B1.
FIG 5
FIG 5
Lamin B2 depletion increases the volume of nucleolin aggregates. (A) Control or lamin B2-depleted cells were treated with DMSO (vehicle control) or actinomycin D (+Act D) and immunostained for nucleolin. Vehicle-treated control (siCtrl) and lamin B2-depleted (siLMNB2) cells show nucleolin restricted to the nucleolus. Vehicle-treated lamin B2-depleted cells show an irregular nucleolar morphology (siLMNB2, +Vehicle panel). Act D-treated control (siCtrl+Act D) or lamin B2-depleted (siLMNB2+Act D) cells show nucleolin aggregates in the nucleoplasm (insets, enlarged panels [arrowhead]). Act D treatment shows spherical nucleoli (asterisk, enlarged panel). Scale bars, ∼5 μm. (B) Lamin B2 depletion shows a significant increase in cells with nucleolin aggregates upon Act D treatment (*, P < 0.05 by Student's t test) (number of independent biological replicates [N] = 3; n, number of nuclei). Error bars indicate SEM. (C) Scatter plots showing an increase in the volumes of nucleolin aggregates upon lamin B2 depletion followed by Act D treatment (***, P < 0.001 by Mann-Whitney test). Bar, median (N = 3; n, number of aggregates; siCtrl, 32 nuclei; siLMNB2, 35 nuclei). (D) Fibrillarin colocalizes with nucleolin aggregates upon Act D treatment (arrowhead). Scale bars, ∼5 μm. (E) Lamin B2-depleted cells show a significant increase in fibrillarin intensity within nucleolin aggregates (***, P < 0.001 by Mann-Whitney test) (N = 2; siCtrl, 28 nuclei; siLMNB2, 30 nuclei). (F) Live imaging of DLD-1 cells overexpressing nucleolin (NCL-GFP OE) following Act D or vehicle treatment. NCL-GFP-transfected cells phenocopy disrupted nucleolar morphology comparably to lamin B2 depletion (NCL-GFP OE, arrowhead). Act D-treated cells show aggregates of nucleolin in the nucleoplasm (arrowhead). Lamin B2-depleted cells overexpressing nucleolin show relatively larger aggregates in the nucleoplasm (NCL OE+ siLMNB2, inset). Cells coexpressing lamin B2-mCherry and NCL-GFP show smaller aggregates, suggesting a rescue of the phenotype of lamin B2 depletion (NCL OE+ LMNB2 OE, inset). Insets, nucleolin aggregates. Scale bars, ∼5 μm. (G) Scatter plots showing volumes of nucleolin aggregates. Lamin B2 depletion significantly increases the volumes of nucleolin aggregates (siLMNB2+NCL OE), while coexpression of lamin B2 and nucleolin (LMNB2 OE + NCL OE) rescues the volume of nucleolin aggregates to basal levels. Bars, median (***, P < 0.001 by Mann-Whitney test) (N = 3, n, number of aggregates; NCL OE, 30 nuclei; siLMNB2+NCL OE, 30 nuclei; LMNB2 OE+NCL OE, 25 nuclei).
FIG 6
FIG 6
Persistence of nucleolin aggregates upon lamin B2 depletion. (A) Control and lamin B2-depleted cells were transfected with NCL-GFP and treated with Act D. 4D time-lapse confocal imaging shows nucleolin aggregates that peak at ∼1 h after Act D addition and gradually disperse into the nucleoplasm (siCtrl,). In lamin B2-depleted cells, nucleolin aggregates persist for ∼3 h (siLMNB2 panel). Scale bars, ∼2 μm. (B) Quantification of nucleolin aggregates from reconstructions of 4D time-lapse movies, plotted as a function of time (number of independent biological replicates [N] = 3; n = 6 nuclei each), shows the persistence of nucleolin aggregates upon lamin B2 depletion. (C) Nucleolin aggregates (NCL-GFP) were photobleached to assess nucleolin dynamics. Representative images of nucleolin speckles from control cells are shown. Red boxes, bleach ROI. Insets, photobleached ROI. Scale bar, ∼5 μm. (D) FRAP curve shows recovery of nucleolin in aggregates from lamin B2-depleted and control cells. Dashed box, initial phase of recovery is faster upon lamin B2 depletion. (E) The mobile fraction of nucleolin calculated from panel C is not altered upon lamin B2 depletion. Error bars, SEM (P > 0.05 by Student's t test) (N = 3; n, number of nuclei). (F) Nucleolin recovery is significantly faster upon lamin B2 depletion (**, P < 0.01 by Student's t test) (N = 3; n, number of nuclei).
FIG 7
FIG 7
Lamin B2 depletion upregulates expression levels of nucleolar transcripts. (A) Schematic representation of the rDNA encoding the ∼13.3-kbp 45S rRNA and ∼30-kbp intergenic sequence. The primer pairs used for qRT-PCR (half arrows) and the ∼12-kbp probe for RNA-FISH are indicated. (B) qRT-PCR shows a significant increase in 45S transcript levels upon lamin B2 depletion. Act D treatment significantly reduces expression levels of the 45S rRNA transcript in both control and lamin B2-depleted cells. Lamin B2 depletion does not show a significant change in the levels of 28S and 18S transcripts (number of independent biological replicates [N] = 3). MALAT1 expression levels are not altered upon lamin B2 depletion and serve as a negative control (N = 3; *, P < 0.05; **, P < 0.01; ***, P < 0.001 [by Student's t test]). (C) RNA-FISH labels intergenic sequence (IGS) RNA in the nucleolus. Lamin B2-depleted cells show amplification of IGS RNA (siLMNB2 panel, arrowhead). Overexpression of siRNA-resistant lamin B2-GFP in lamin B2-depleted cells (siLMNB2+LMNB2-GFP) restores the number of IGS RNA-FISH signals. The absence of RNA signals in cells upon RNase A treatment shows specificity of IGS RNA-FISH foci. Scale bars, ∼5 μm. (D) Quantification of RNA-FISH foci shows a significant increase (>2 foci) upon lamin B2 depletion, while overexpression of lamin B2 restores IGS transcripts to a single focus. Error bars, SD. (*, P < 0.05; **, P < 0.01; ***, P < 0.001 [by Fisher's exact test of proportions]) (N = 3, n, number of nuclei). (E) Immuno-RNA-FISH shows colocalization of nucleolin speckles with IGS transcripts in control or lamin B2-depleted cells treated with Act D (arrowhead). (F) Increased colocalization of IGS transcripts with nucleolin in the nucleoplasm upon lamin B2 knockdown (Pearson colocalization index median values: control, 0.7; siLMNB2, 0.88). Manders coefficient (M1), overlap of IGS RNA with nucleolin (median values; control, 0.19; siLMNB2, 0.38). Manders coefficient (M2), overlap of nucleolin with IGS RNA (median values: control, 0.2; siLMNB2, 0.31 [not significant]). Whiskers, Tukey (***, P < 0.001 by Mann-Whitney test) (N = 3; siCtrl, 28 nuclei; siLMNB2, 32 nuclei).
FIG 8
FIG 8
Model depicting a role for lamin B2 in modulating nucleolar structure and function. Lamin B2 is localized predominantly at the nuclear periphery. However, lamin B2 also localizes at the nucleolar border and potentially interacts with nucleolin and NPM1. Lamin B2 depletion shows disrupted nucleolar morphology (1) and increased expression of 45S rRNA and intergenic sequence RNA (IGS RNA) (2). Lamin B2-depleted cells treated with actinomycin D (Act D) have increased nucleolin-IGS RNA aggregates that persist in the nucleoplasm (3). The lamin B2 head domain is required for the maintenance of intact nucleolar morphology, while the lamin B2 SLSATGR amino acid sequence is required for maintaining bleb-free nuclei.

Similar articles

Cited by

References

    1. Leary DJ, Huang S. 2001. Regulation of ribosome biogenesis within the nucleolus. FEBS Lett 509:145–150. doi:10.1016/S0014-5793(01)03143-X. - DOI - PubMed
    1. Hernandez-Verdun D. 2011. Assembly and disassembly of the nucleolus during the cell cycle. Nucleus 2:189–194. doi:10.4161/nucl.2.3.16246. - DOI - PMC - PubMed
    1. Dundr M, Misteli T, Olson MO. 2000. The dynamics of postmitotic reassembly of the nucleolus. J Cell Biol 150:433–446. doi:10.1083/jcb.150.3.433. - DOI - PMC - PubMed
    1. Derenzini M, Montanaro L, Treré D. 2009. What the nucleolus says to a tumour pathologist. Histopathology 54:753–762. doi:10.1111/j.1365-2559.2008.03168.x. - DOI - PubMed
    1. Isaac C, Marsh KL, Paznekas WA, Dixon J, Dixon MJ, Jabs EW, Meier UT. 2000. Characterization of the nucleolar gene product, treacle, in Treacher Collins syndrome. Mol Biol Cell 11:3061–3071. doi:10.1091/mbc.11.9.3061. - DOI - PMC - PubMed

LinkOut - more resources