. 2017 Nov 28;37(24):e00337-17.
doi: 10.1128/MCB.00337-17. Print 2017 Dec 15.

Mitochondrial Abnormality Facilitates Cyst Formation in Autosomal Dominant Polycystic Kidney Disease

Affiliations

Mitochondrial Abnormality Facilitates Cyst Formation in Autosomal Dominant Polycystic Kidney Disease

Yu Ishimoto et al. Mol Cell Biol. .

Abstract

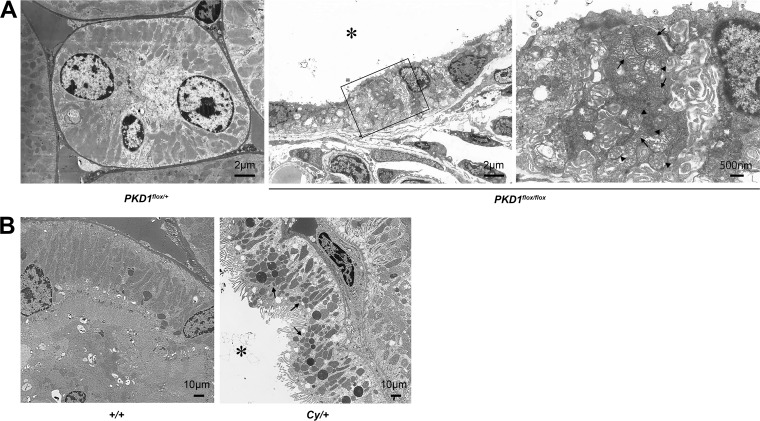
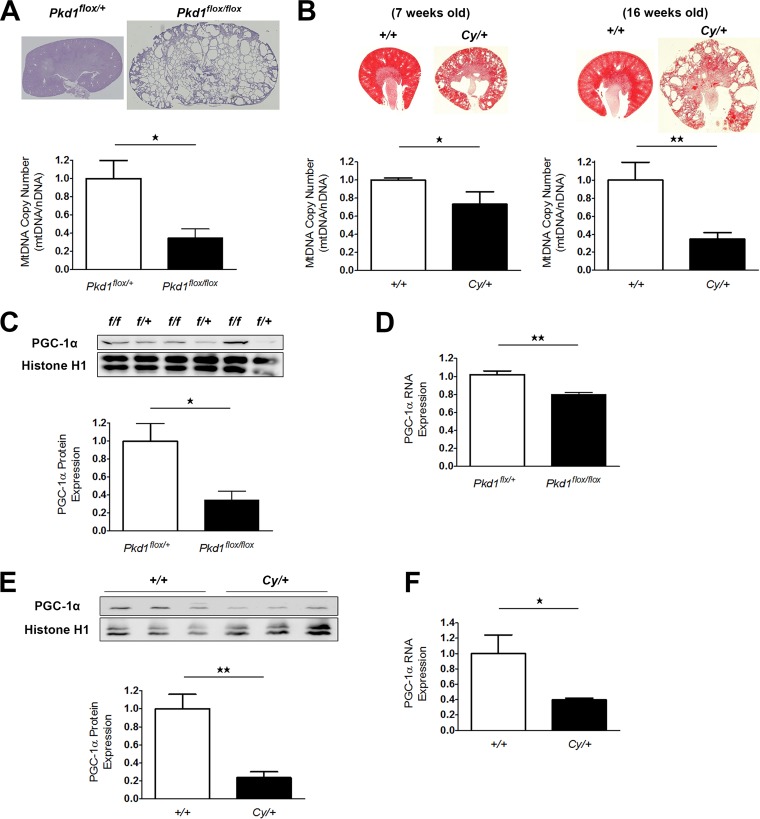
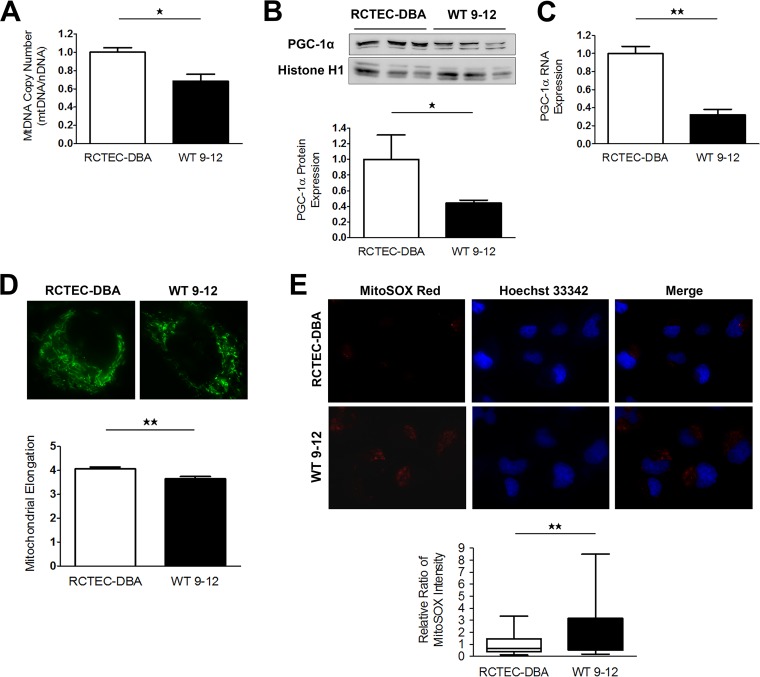
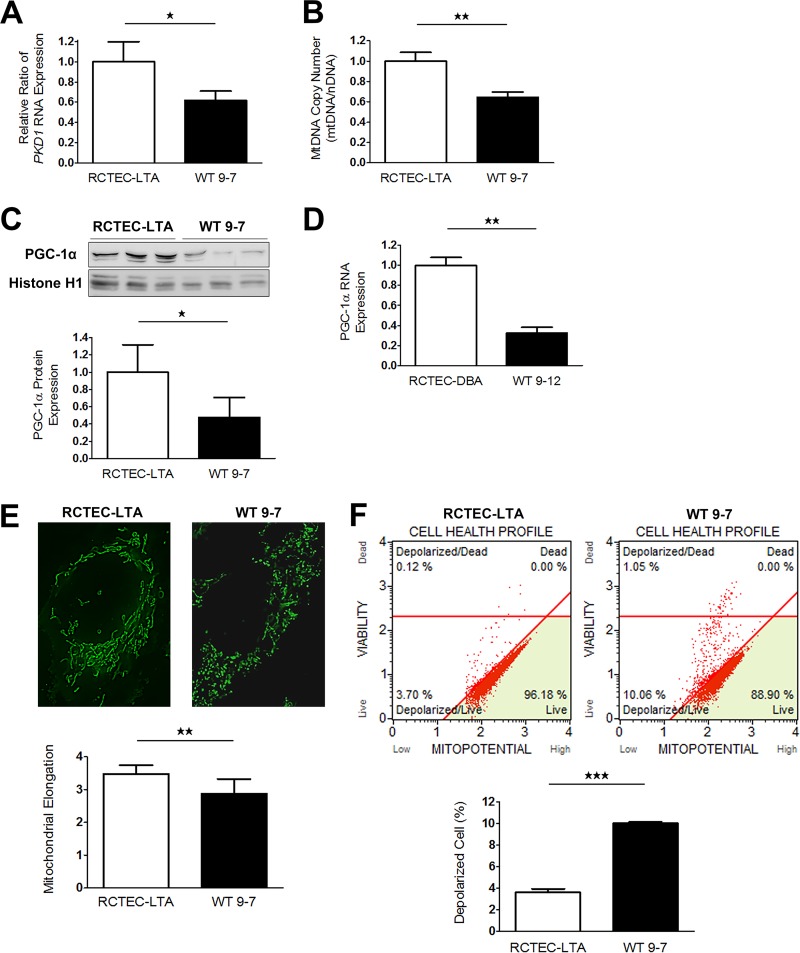
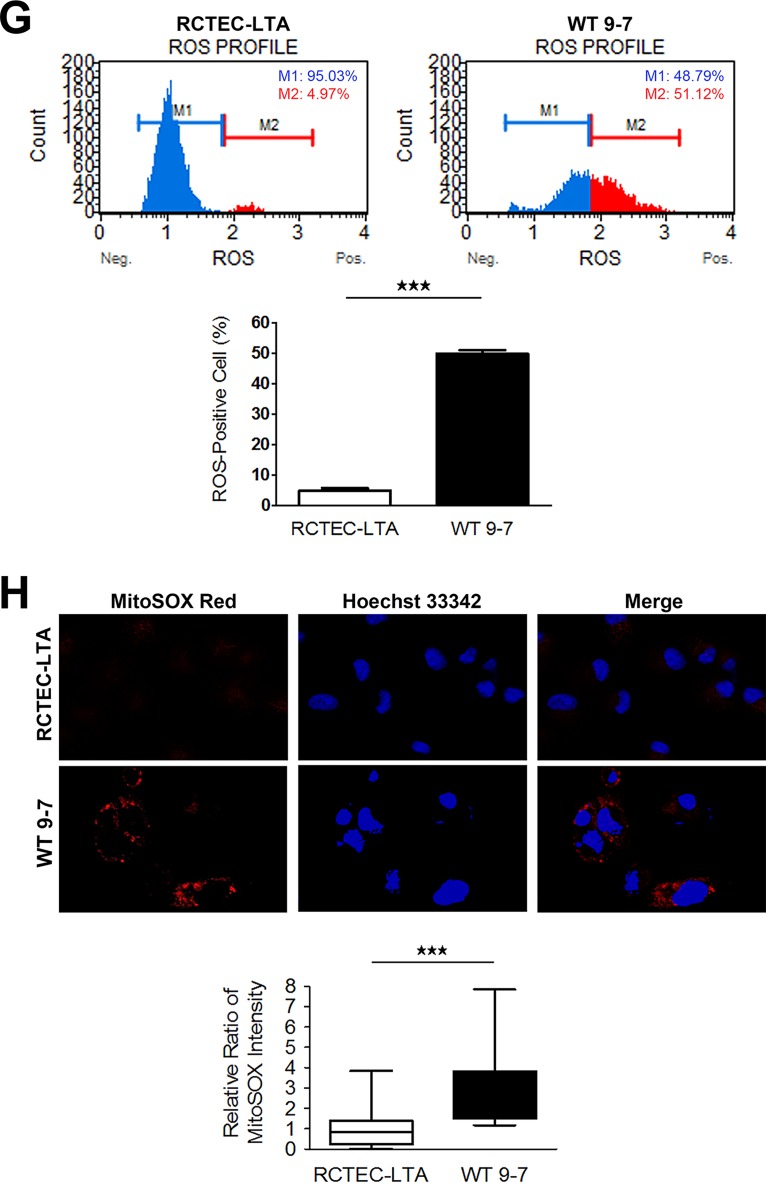
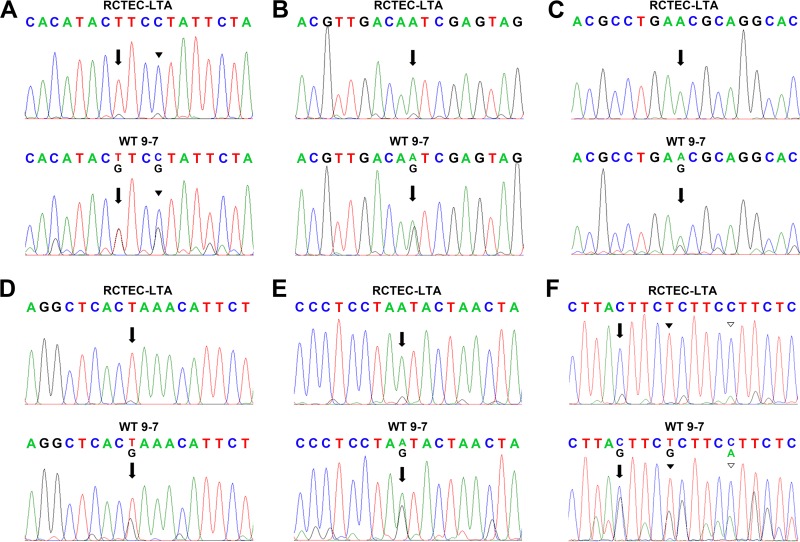
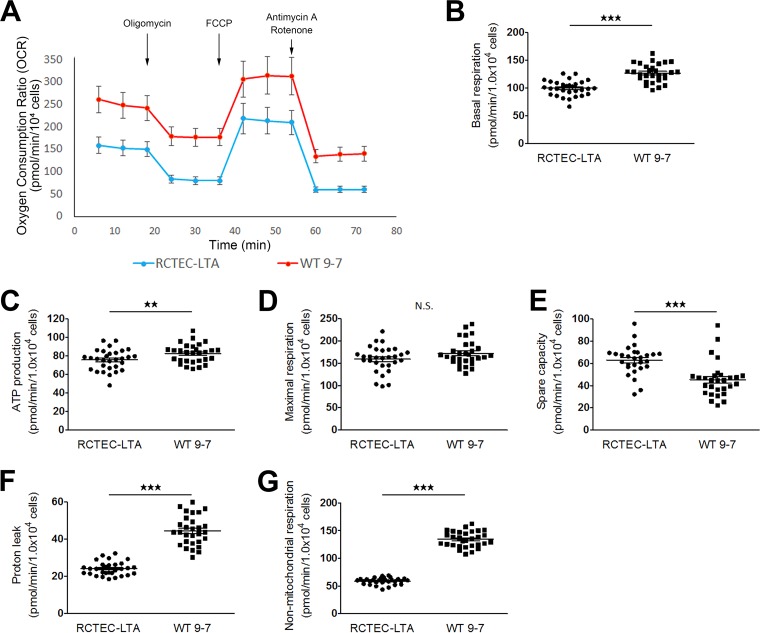
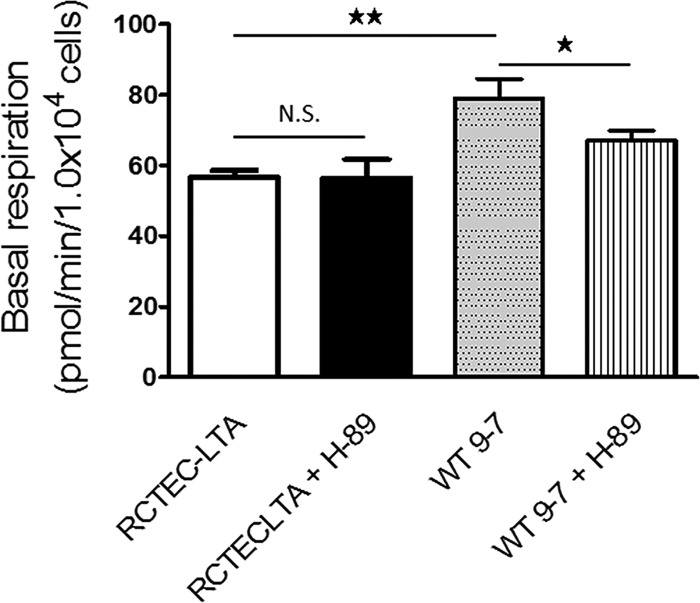
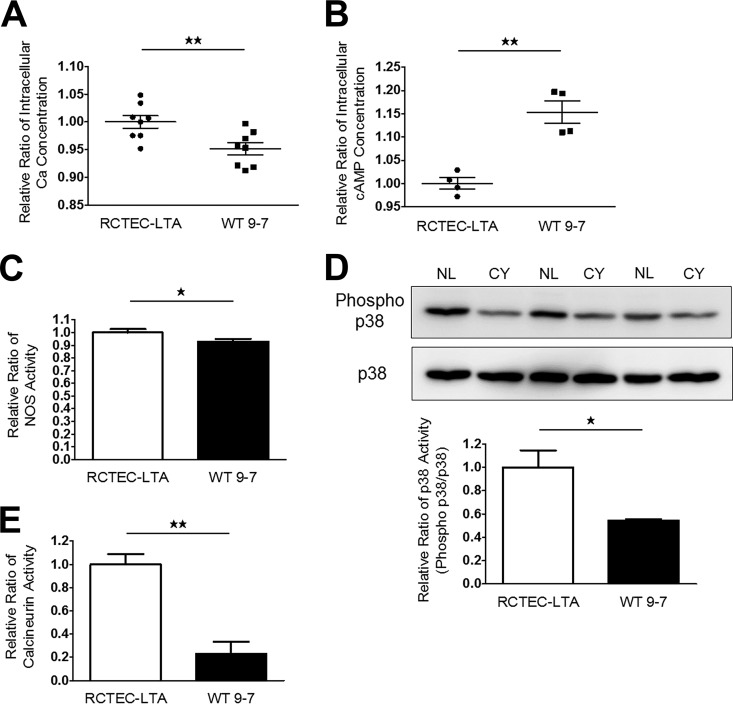
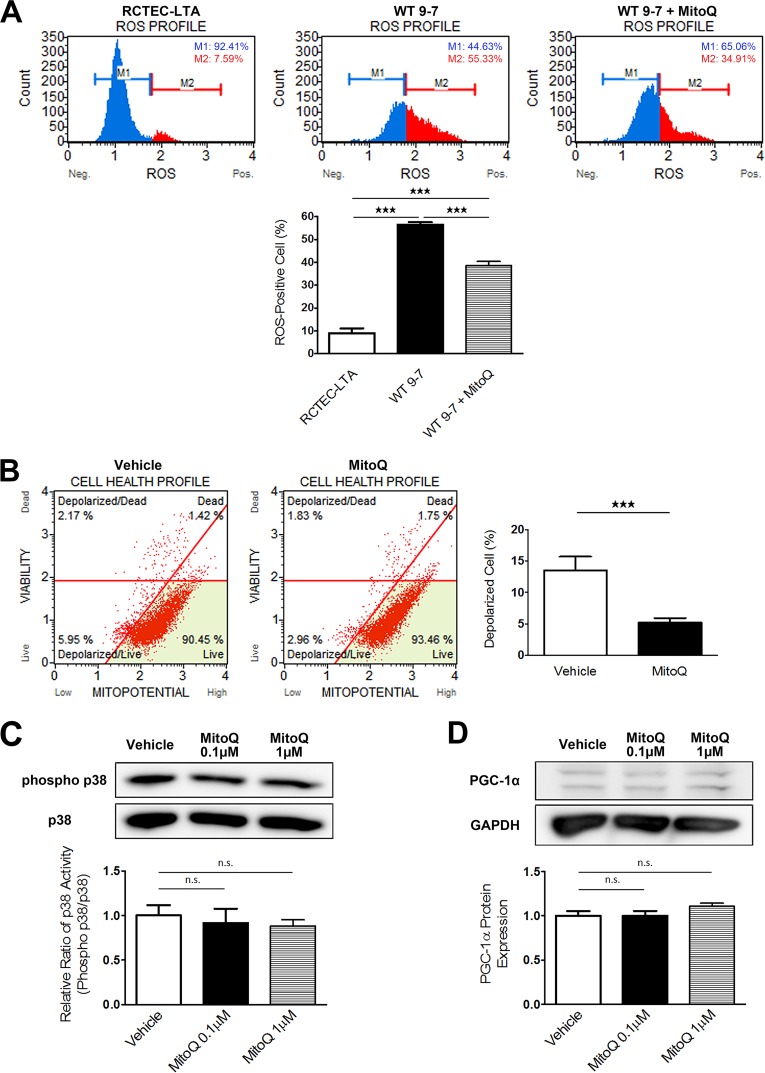
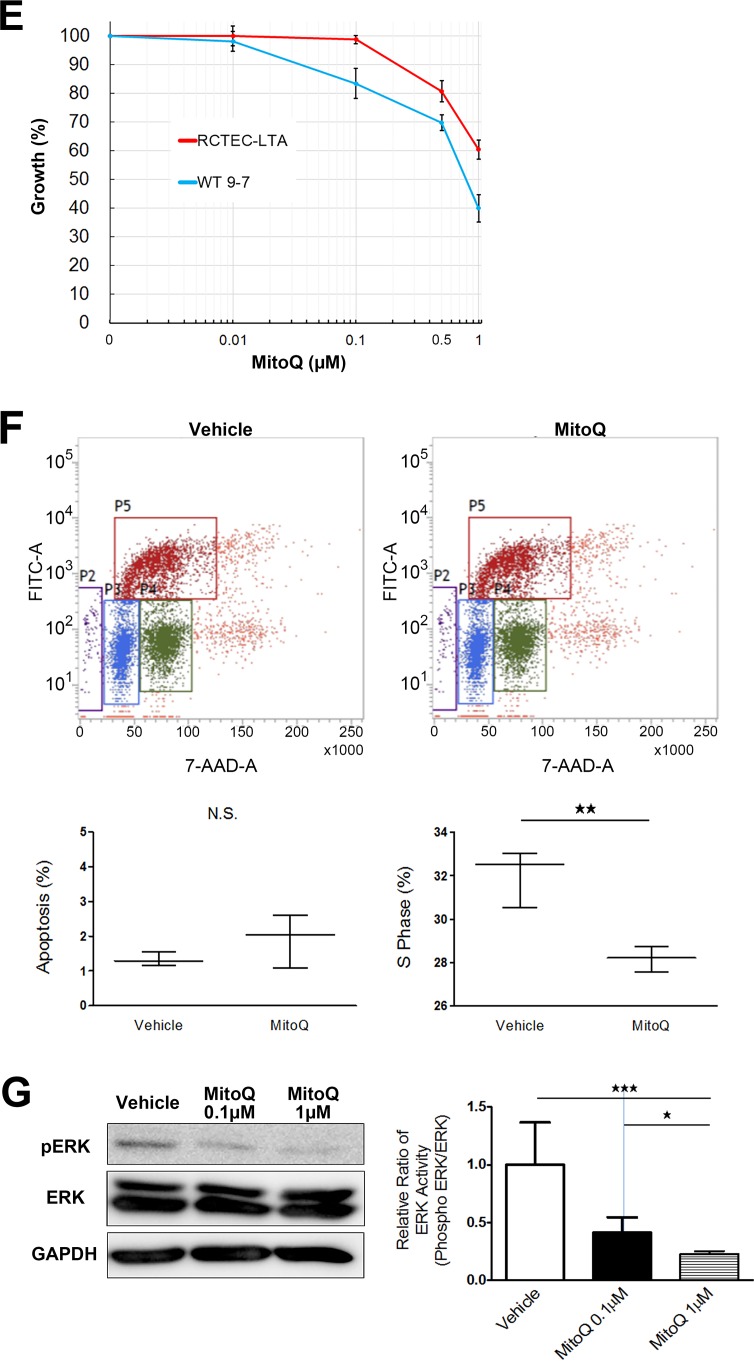
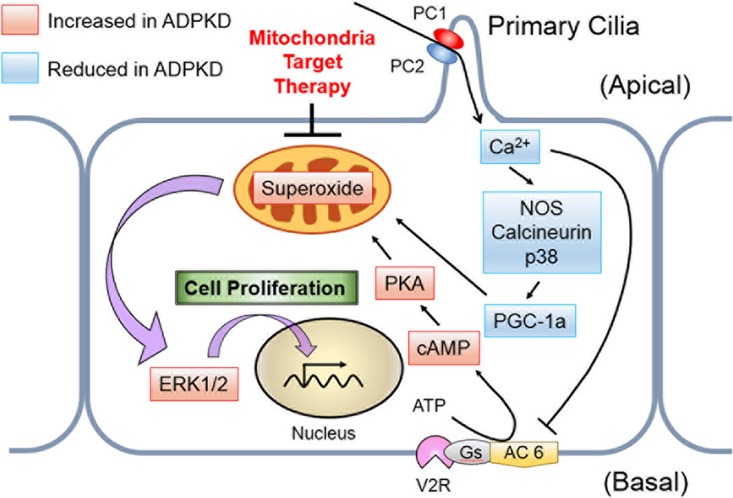
Autosomal dominant polycystic kidney disease (ADPKD) constitutes the most inherited kidney disease. Mutations in the PKD1 and PKD2 genes, encoding the polycystin 1 and polycystin 2 Ca2+ ion channels, respectively, result in tubular epithelial cell-derived renal cysts. Recent clinical studies demonstrate oxidative stress to be present early in ADPKD. Mitochondria comprise the primary reactive oxygen species source and also their main effector target; however, the pathophysiological role of mitochondria in ADPKD remains uncharacterized. To clarify this function, we examined the mitochondria of cyst-lining cells in ADPKD model mice (Ksp-Cre PKD1flox/flox) and rats (Han:SPRD Cy/+), demonstrating obvious tubular cell morphological abnormalities. Notably, the mitochondrial DNA copy number and peroxisome proliferator-activated receptor γ coactivator 1α (PGC-1α) expression were decreased in ADPKD model animal kidneys, with PGC-1α expression inversely correlated with oxidative stress levels. Consistent with these findings, human ADPKD cyst-derived cells with heterozygous and homozygous PKD1 mutation exhibited morphological and functional abnormalities, including increased mitochondrial superoxide. Furthermore, PGC-1α expression was suppressed by decreased intracellular Ca2+ levels via calcineurin, p38 mitogen-activated protein kinase (MAPK), and nitric oxide synthase deactivation. Moreover, the mitochondrion-specific antioxidant MitoQuinone (MitoQ) reduced intracellular superoxide and inhibited cyst epithelial cell proliferation through extracellular signal-related kinase/MAPK inactivation. Collectively, these results indicate that mitochondrial abnormalities facilitate cyst formation in ADPKD.

Keywords: mitochondrial metabolism; polycystic kidney disease.


Figures

FIG 1
FIG 1
Morphological change of mitochondria in ADPKD animal models. (A) Electron microscope image of 7-day-old Ksp-Cre PKD1flox/+ mice and Ksp-Cre PKD1flox/flox mice. Left, distal tubules of Ksp-Cre PKD1flox/+ mice. Middle, cyst epithelial cells from Ksp-Cre PKD1flox/+ mice; right, higher magnification of the middle panel. Arrows show normal mitochondria, and arrowheads show mitochondria that became swollen with indistinct cristae. *, cystic cavity. (B) Electron microscope images of proximal tubules from the kidneys of controls (+/+) and cysts derived from the proximal tubules of kidneys from Cy/+ rats. The mitochondria of cyst-lining cells from Cy/+ kidneys were fragmented (arrow). *, cystic cavity.
FIG 2
FIG 2
mtDNA copy number and PGC-1α expression in the kidneys of animal models of ADPKD. (A) Relative ratio of mtDNA copy number (mtDNA/nDNA) in kidney tissue from 7-day-old Ksp-Cre PKD1flox/flox mice and controls (Ksp-Cre PKD1flox/+ mice). Top, representative kidney tissue of PAS staining. Bottom, Bar graph showing the relative ratio of mtDNA copy number (each group, n = 3). (B) Left, relative ratio of mtDNA copy number in kidney tissue from 7-week-old Cy/+ rats and 7-week-old wild-type rats (+/+). Upper left, representative kidney tissue after hematoxylin-eosin (HE) staining. Lower left, bar graph showing the relative ratio of mtDNA copy number (each group, n = 3). Right, relative ratio of mtDNA copy number in kidney tissue from 16-week-old Cy/+ rats and 16-week-old wild-type rats (+/+). Upper right, representative kidney tissue after HE staining. Lower right, bar graph showing the relative ratio of mtDNA copy number (each group, n = 3). (C) Representative Western blot analysis of PGC-1α in the kidneys of 7-day-old Ksp-Cre PKD1flox/flox mice and controls (Ksp-Cre PKD1flox/+ mice). The bar graph shows the relative ratio of protein expression calibrated by histone H1 in control kidney tissue (each group, n = 3). (D) Representative real-time PCR analysis of mRNA for PGC-1α in the kidneys of 7-day-old Ksp-Cre PKD1flox/flox mice and controls (each group, n = 3). (E) Representative Western blot analysis of PGC-1α in the kidneys of 7-week-old Cy/+ rats and wild-type rats (+/+). (F) Representative real-time PCR analysis of mRNA for PGC-1α in the kidneys of 7-week-old Cy/+ rats and wild-type rats (+/+) (each group, n = 3). The bar graph shows the relative ratio of protein expression calibrated by histone H1 in control kidney tissue. *, P < 0.05; **, P < 0.01.
FIG 3
FIG 3
Immunohistochemical analysis of PGC-1α and 8-OHdG in the kidneys of ADPKD model animals. (A) Representative IHC staining for PGC-1α in kidney tissue from 7-day-old Ksp-Cre PKD1flox/+ and Ksp-Cre PKD1flox/flox mice. Left, cortex of PKD1flox/+ mouse kidney; middle and right, lower and higher magnifications of PKD1flox/flox mouse kidney, respectively. The area surrounded by the dotted line in the higher-magnification image represents cyst-lining cells. The bar graph shows the relative ratio of staining intensity of diaminobenzidine (DAB) in normal tubules and cyst-lining cells. More than 50 cells were analyzed for staining intensity of DAB in both groups. *, representative cyst. (B) Representative IHC staining for PGC-1α in kidney tissue from 7-week-old Cy rats. Left, IHC results for controls (+/+); right, IHC results for Cy/+ rats. The bar graph shows the relative ratio of staining intensity of diaminobenzidine (DAB) in normal tubules and cyst-lining cells. More than 50 cells were analyzed for staining intensity of DAB in both groups. *, representative cyst. (C) Representative IHC staining results for 8-OHdG in kidney tissue from 7-day-old Ksp-Cre PKD1flox/flox mice. Left, kidney tissue from Ksp-Cre PKD1flox/+ mice; middle and right, kidney tissue from Ksp-Cre PKD1flox/flox mice and high magnification of the black box in the middle panel, respectively. The bar graph shows the relative ratio of staining intensity compared with that of normal tubules in Ksp-Cre PKD1flox/flox mice. More than 50 cells were analyzed for staining intensity of DAB in both groups. *, representative cyst. (D) Representative IHC staining results for 8-OHdG in kidney tissue from 7-week-old Cy rats. *, representative cyst. The bar graph shows the relative ratio of staining intensity compared with that of normal tubules in Cy rats. The 8-OHdG staining intensity was increased in cyst-lining cells compared with normal tubular cells. More than 50 cells were analyzed for staining intensity of DAB in both groups. Results are shown as the relative ratio. Results represent the means ± standard deviations. **, P < 0.01; ***, P < 0.001.
FIG 4
FIG 4
Mitochondrial abnormalities in human ADPKD cyst-derived cells with a homozygous PKD1 mutation. (A) mtDNA copy number in cyst-derived cells containing a homozygous PKD1 mutation (WT 9-12) compared to a normal tubular cell line (RCTEC-DBA) (each group, n = 3). Results represent the relative ratio. (B) Western blot analysis of PGC-1α levels in WT 9-12 and RCTEC-DBA (each group, n = 3). The bar graph shows the relative ratio of protein expression calibrated by histone H1 in normal and cyst-derived cells. (C) mRNA expression of PGC-1α in WT 9-12 and RCTEC-DBA (each group, n = 3). The bar graph shows the relative ratio of mRNA expression calibrated by GAPDH in normal and cyst-derived cells. (D) MitoTracker Red FM staining of WT 9-12 and RCTEC-DBA. Mitochondrial elongation was evaluated using ImageJ software, and units represent the ratio of major axis to minor axis (each group, n = 30). (E) Evaluation of mitochondrial superoxide in WT 9-12 compared to RCTEC-DBA by MitoSOX Red staining (each group, n = 25). The box plot shows the signal intensity. Results represent the means ± standard deviations. *, P < 0.05; **, P < 0.01.
FIG 5
FIG 5
Alterations in mitochondrial metabolism in ADPKD-cyst-derived cells with a homozygous PKD1 mutation. (A) Measurement of the mitochondrial OCR of normal tubular cells derived from distal tubules (RCTEC-DBA) and cyst-derived cells with a PKD1 homozygous mutation derived from distal tubules (WT 9-12). (B) Seahorse XF Cell Mito stress test profile of the key parameters of mitochondrial respiration. (C to H) Basal respiration (C), ATP production with mitochondrial respiration (D), mitochondrial respiration and spare capacity (E and F, respectively), proton leakage from mitochondria (G), and nonmitochondrial respiration (H) in WT 9-12 compared to RCTEC-DBA. Each group, n = 30. Results represent the means ± standard deviations. ***, P < 0.001.
FIG 6
FIG 6
Mitochondrial abnormalities in human ADPKD cyst-derived cells with a heterozygous PKD1 mutation. (A) PKD1 expression in cyst-derived cells containing a heterozygous PKD1 mutation (WT 9-7) compared to a normal tubular cell line (RCTEC-LTA) (each group, n = 3). Results represent the relative ratio. (B) mtDNA copy number in WT 9-7 relative to RCTEC-LTA (each group, n = 3). Results represent the relative ratio. (C) Western blot analysis of PGC-1α levels of WT 9-7 and RCTEC-LTA (each group, n = 3). The bar graph shows the relative ratio of protein expression calibrated by histone H1 in normal and cyst-derived cells. (D) mRNA expression of PGC-1α in WT 9-7 and RCTEC-LTA (each group, n = 3). The bar graph shows the relative ratio of mRNA expression calibrated by GAPDH in normal and cyst-derived cells. (E) MitoTracker Green staining of RCTEC-LTA and WT 9-7. Mitochondrial elongation was evaluated using ImageJ software, and units represent the major axis to minor axis ratio (each group, n = 25). (F) Evaluation of mitochondrial membrane potential. The bar graph shows the percentage of depolarized cells, showing depolarization of inner mitochondrial membrane potential in WT 9-7 compared with that in RCTEC-LTA (each group, n = 3). (G) Evaluation of intracellular ROS (superoxide). The x and y axes represent the cell number and the ROS signaling strength, respectively, with ROS-negative cells (M1) and ROS-positive cells (M2) identified. The ROS-positive cell number in WT 9-7 is compared with that in RCTEC-LTA. The bar graph shows the percentage of ROS-positive cells (each group, n = 3). (H) Evaluation of mitochondrial superoxide by MitoSOX Red staining. The box plot shows the signal intensity. Mitochondrial superoxide levels in WT 9-7 are compared to those in RCTEC-LTA (each group, n = 25). Results represent the means ± standard deviations. **, P < 0.01; ***, P < 0.001.
FIG 6
FIG 6
Mitochondrial abnormalities in human ADPKD cyst-derived cells with a heterozygous PKD1 mutation. (A) PKD1 expression in cyst-derived cells containing a heterozygous PKD1 mutation (WT 9-7) compared to a normal tubular cell line (RCTEC-LTA) (each group, n = 3). Results represent the relative ratio. (B) mtDNA copy number in WT 9-7 relative to RCTEC-LTA (each group, n = 3). Results represent the relative ratio. (C) Western blot analysis of PGC-1α levels of WT 9-7 and RCTEC-LTA (each group, n = 3). The bar graph shows the relative ratio of protein expression calibrated by histone H1 in normal and cyst-derived cells. (D) mRNA expression of PGC-1α in WT 9-7 and RCTEC-LTA (each group, n = 3). The bar graph shows the relative ratio of mRNA expression calibrated by GAPDH in normal and cyst-derived cells. (E) MitoTracker Green staining of RCTEC-LTA and WT 9-7. Mitochondrial elongation was evaluated using ImageJ software, and units represent the major axis to minor axis ratio (each group, n = 25). (F) Evaluation of mitochondrial membrane potential. The bar graph shows the percentage of depolarized cells, showing depolarization of inner mitochondrial membrane potential in WT 9-7 compared with that in RCTEC-LTA (each group, n = 3). (G) Evaluation of intracellular ROS (superoxide). The x and y axes represent the cell number and the ROS signaling strength, respectively, with ROS-negative cells (M1) and ROS-positive cells (M2) identified. The ROS-positive cell number in WT 9-7 is compared with that in RCTEC-LTA. The bar graph shows the percentage of ROS-positive cells (each group, n = 3). (H) Evaluation of mitochondrial superoxide by MitoSOX Red staining. The box plot shows the signal intensity. Mitochondrial superoxide levels in WT 9-7 are compared to those in RCTEC-LTA (each group, n = 25). Results represent the means ± standard deviations. **, P < 0.01; ***, P < 0.001.
FIG 7
FIG 7
Comparison of mtDNA sequences in normal tubular cells (RCTEC-LTA) and cyst-derived cells with a heterozygous PKD1 mutation (WT 9-7). Representative examples of mtDNA sequences, with accumulated mtDNA point mutations and heteroplasmy in cyst-derived cells, are shown. The influence of missense mutations on protein function was analyzed using polyPhen-2. (A) The region encoding NADH dehydrogenase subunit 4. The arrows point to mtDNA position 11204, and the arrowheads point to position 11207. A T-to-G replacement at position 11204 translates to a phenylalanine-to-valine mutation predicted to be benign (polyPhen-2 score, 0.035). A C-to-G replacement at position 11207 translates to a leucine-to-valine mutation predicted to be damaging (polyPhen-2 score, 0.994). (B) The region encoding cytochrome c oxidase subunit 2. The arrows show mtDNA position 8004. Replacement of A by G at position 8004 alters the amino acid asparagine to serine, and this mutation is predicted to be probably damaging, with a polyPhen-2 score of 0.973. (C) The region encoding NADH dehydrogenase subunit 4. The arrows show mtDNA position 11190. Replacement of A by G at position 11190 alters the amino acid asparagine to serine, which is predicted to be probably damaging, with a polyPhen-2 score of 0.994. (D) The region encoding NADH dehydrogenase subunit 4. The arrows show mtDNA position 11280. Replacement of T by G at position 11280 alters the amino acid leucine to arginine, which is predicted to be probably damaging, with a polyPhen-2 score of 0.999. (E) The region encoding NADH dehydrogenase subunit 4. The arrows show mtDNA position 11958. Replacement of A by G at position 11958 alters the amino acid methionine to serine, which is predicted to be benign, with a polyPhen-2 score of 0.121. (F) The region encoding cytochrome b. The arrows show mtDNA position 15443. Replacement of C by G at position 15443 alters the amino acid leucine to valine, which is predicted to be benign, with a polyPhen-2 score of 0.010. The black arrowhead shows mtDNA position 15447. Replacement of T by G at position 15447 alters the amino acid leucine to proline, which is predicted to be benign, with a polyPhen-2 score of 1.000. The white arrowhead shows mtDNA position 15452. Replacement of G by A at position 15452 alters the amino acid leucine to phenylalanine, which is predicted to be benign, with a polyPhen-2 score of 1.000.
FIG 8
FIG 8
Alterations in mitochondrial metabolism in ADPKD-cyst-derived cells with a heterozygous PKD1 mutation. (A) Measurement of the mitochondrial OCR of normal tubular cells derived from proximal tubules (RCTEC-LTA) and cyst-derived cells with a PKD1 heterozygous mutation derived from proximal tubules (WT 9-7). (B to G) Basal mitochondrial respiration and ATP production (B and C, respectively), mitochondrial respiration (D), mitochondrial spare capacity (E), proton leakage from mitochondria (F), and nonmitochondrial respiration (G) in WT 9-7 compared with RCTEC-LTA. Each group, n = 30. Results represent the means ± standard deviations. **, P < 0.01; ***, P < 0.001. N.S., not significant.
FIG 9
FIG 9
OCRs of normal tubular cells (RCTEC-LTA) and cyst-derived cells with a heterozygous PKD1 mutation (WT9-7) treated with H-89 and analyzed by XF24. The OCR responses of normal tubular cells and cyst-derived cells in response to H-89 (PKA inhibition) are shown. Each group, n = 5. Results represent the means ± standard deviations. *, P < 0.05; **, P < 0.01. N.S., not significant.
FIG 10
FIG 10
RNA interference-mediated PKD1 knockdown and mitochondrial abnormality. Two kinds of siPKD1 (siPKD1-1 and siPKD1-2) were used. (A) PKD1 knockdown efficiency confirmed by quantitative real-time PCR. The bar graph shows the relative ratio of PKD1 RNA expression (each group, n = 3). (B) Evaluation of mtDNA copy number by real-time PCR in association with PKD1 RNA expression levels (each group, n = 3). Results represent the relative ratio. (C) Evaluation of mitochondrial superoxide by MitoSOX Red staining as correlated with PKD1 RNA expression levels (each group, n = 25). The box plot shows the signal intensity. (D) Alterations in mitochondrial metabolism in PKD1 knockdown cells. Red, blue, and green represent negative-control siRNA, siPKD1-1, and siPKD1-2, respectively (each group, n = 20). (E to I) Basal respiration (E), ATP production with mitochondrial respiration (F), mitochondrial respiration (G), spare capacity (H), and proton leakage from mitochondria (I) as correlated with PKD1 RNA expression levels. Results represent the means ± standard deviations. *, P < 0.05; **, P < 0.01; ***, P < 0.001; n.s., not significant.
FIG 11
FIG 11
PGC-1α regulatory mechanisms in cyst-derived cells. (A and B) Intracellular Ca2+ (each group, n = 8) (A) and cAMP concentrations (each group, n = 4) (B) of normal tubular cells (RCTEC-LTA) and cyst-derived cells (WT 9-7). Results represent the relative ratio. (C and D) NOS (C) and p38 MAPK (D) activities of RCTEC-LTA and WT 9-7 (each group, n = 3). Results represent the relative ratio. The bar graph shows the relative ratio of p38 activity (phosphor-p38/p38). (E) Calcineurin activities of RCTEC-LTA and WT 9-7 (each group, n = 3). Results represent the relative ratio. All results represent the means ± standard deviations. *, P < 0.05; **, P < 0.01.
FIG 12
FIG 12
Amelioration of mitochondrial abnormality in cyst-derived cells by mitochondrion-targeted therapy (MitoQ). (A) Evaluation of intracellular ROS (superoxide) to assess intracellular superoxide levels following mitochondrion-targeted therapy using MitoQ. The x and y axes represent cell number and ROS signaling strength, respectively, with ROS-negative cells (M1) and ROS-positive cells (M2) identified. The ROS-positive cell number in cyst-derived cells (WT 9-7) are compared with that in control cells (RCTEC-LTA) and MitoQ-treated (1.0 μM for 48 h) cyst-derived cells (Cyst + MitoQ). The bar graph shows the percentage of ROS-positive cells (each group, n = 3). (B) Evaluation of mitochondrial membrane potential. The bar graph shows the percentage of depolarized cells (each group, n = 3). Depolarization of inner mitochondrial membrane potential in cyst-derived cells treated with MitoQ (1.0 μM for 48 h) (MitoQ) compared with cyst-derived cells treated with vehicle (Vehicle) is shown. (C) p38 MAPK activities in WT 9-7 treated with MitoQ (each group, n = 3). Results represent the relative ratio. The bar graph shows the relative ratio of p38 activity (phosphor-p38/p38). (D) PGC-1α expression in WT 9-7 treated with MitoQ (each group, n = 3). Results represent the relative ratio. The bar graph shows the relative ratio of PGC-1α expression. (E) Effect of MitoQ treatment (48 h) on cell proliferation of RCTEC-LTA and WT 9-7 (each group, n = 3). (F) Results of BrdU flow cytometry regarding the percentages of apoptotic and S-phase cells in control and MitoQ-treated groups (each group, n = 3). (G) Western blot analysis of ERK showing effects of MitoQ treatment on ERK activity (each group, n = 3). Results represent the means ± standard deviations. *, P < 0.05; **, P < 0.01; ***, P < 0.001. n.s., not significant.
FIG 12
FIG 12
Amelioration of mitochondrial abnormality in cyst-derived cells by mitochondrion-targeted therapy (MitoQ). (A) Evaluation of intracellular ROS (superoxide) to assess intracellular superoxide levels following mitochondrion-targeted therapy using MitoQ. The x and y axes represent cell number and ROS signaling strength, respectively, with ROS-negative cells (M1) and ROS-positive cells (M2) identified. The ROS-positive cell number in cyst-derived cells (WT 9-7) are compared with that in control cells (RCTEC-LTA) and MitoQ-treated (1.0 μM for 48 h) cyst-derived cells (Cyst + MitoQ). The bar graph shows the percentage of ROS-positive cells (each group, n = 3). (B) Evaluation of mitochondrial membrane potential. The bar graph shows the percentage of depolarized cells (each group, n = 3). Depolarization of inner mitochondrial membrane potential in cyst-derived cells treated with MitoQ (1.0 μM for 48 h) (MitoQ) compared with cyst-derived cells treated with vehicle (Vehicle) is shown. (C) p38 MAPK activities in WT 9-7 treated with MitoQ (each group, n = 3). Results represent the relative ratio. The bar graph shows the relative ratio of p38 activity (phosphor-p38/p38). (D) PGC-1α expression in WT 9-7 treated with MitoQ (each group, n = 3). Results represent the relative ratio. The bar graph shows the relative ratio of PGC-1α expression. (E) Effect of MitoQ treatment (48 h) on cell proliferation of RCTEC-LTA and WT 9-7 (each group, n = 3). (F) Results of BrdU flow cytometry regarding the percentages of apoptotic and S-phase cells in control and MitoQ-treated groups (each group, n = 3). (G) Western blot analysis of ERK showing effects of MitoQ treatment on ERK activity (each group, n = 3). Results represent the means ± standard deviations. *, P < 0.05; **, P < 0.01; ***, P < 0.001. n.s., not significant.
FIG 13
FIG 13
Schematic of the pathway proposed in this study. A decreased intracellular Ca2+ concentration reduces PGC-1α expression via calcineurin, p38 MAPK, and NOS deactivation, whereas PKA upregulates mitochondrial respiration. These mechanisms enhance mitochondrial superoxide production, which contributes to ERK/MAPK signaling in cyst epithelial cells. PC 1, polycystin 1; PC 2, polycystin 2; AC 6, adenylate cyclase 6; V2R, vasopressin-2 receptor; Gs, stimulatory G protein.

Similar articles

Cited by

References

    1. Harris PC. 2002. Molecular basis of polycystic kidney disease: PKD1, PKD2 and PKHD1. Curr Opin Nephrol Hypertens 11:309–314. doi:10.1097/00041552-200205000-00007. - DOI - PubMed
    1. Chapman AB, Devuyst O, Eckardt KU, Gansevoort RT, Harris T, Horie S, Kasiske BL, Odland D, Pei Y, Perrone RD, Pirson Y, Schrier RW, Torra R, Torres VE, Watnick T, Wheeler DC, Conference Participants. 2015. Autosomal-dominant polycystic kidney disease (ADPKD): executive summary from a Kidney Disease: Improving Global Outcomes (KDIGO) Controversies Conference. Kidney Int 88:17–27. doi:10.1038/ki.2015.59. - DOI - PMC - PubMed
    1. Hateboer N, van Dijk MA, Bogdanova N, Coto E, Saggar-Malik AK, San Millan JL, Torra R, Breuning M, Ravine D. 1999. Comparison of phenotypes of polycystic kidney disease types 1 and 2. European PKD1-PKD2 Study Group. Lancet 353:103–107. - PubMed
    1. Heggö O. 1966. A microdissection study of cystic disease of the kidneys in adults. J Pathol Bacteriol 91:311–315. doi:10.1002/path.1700910204. - DOI - PubMed
    1. Baert L. 1978. Hereditary polycystic kidney disease (adult form): a microdissection study of two cases at an early stage of the disease. Kidney Int 13:519–525. doi:10.1038/ki.1978.75. - DOI - PubMed

Publication types

MeSH terms