. 2017 Nov 1;37(44):10624-10635.
doi: 10.1523/JNEUROSCI.0044-17.2017. Epub 2017 Oct 9.

Interneurons in the Honeybee Primary Auditory Center Responding to Waggle Dance-Like Vibration Pulses

Affiliations

Interneurons in the Honeybee Primary Auditory Center Responding to Waggle Dance-Like Vibration Pulses

Hiroyuki Ai et al. J Neurosci. .

Abstract

Female honeybees use the "waggle dance" to communicate the location of nectar sources to their hive mates. Distance information is encoded in the duration of the waggle phase (von Frisch, 1967). During the waggle phase, the dancer produces trains of vibration pulses, which are detected by the follower bees via Johnston's organ located on the antennae. To uncover the neural mechanisms underlying the encoding of distance information in the waggle dance follower, we investigated morphology, physiology, and immunohistochemistry of interneurons arborizing in the primary auditory center of the honeybee (Apis mellifera). We identified major interneuron types, named DL-Int-1, DL-Int-2, and bilateral DL-dSEG-LP, that responded with different spiking patterns to vibration pulses applied to the antennae. Experimental and computational analyses suggest that inhibitory connection plays a role in encoding and processing the duration of vibration pulse trains in the primary auditory center of the honeybee.SIGNIFICANCE STATEMENT The waggle dance represents a form of symbolic communication used by honeybees to convey the location of food sources via species-specific sound. The brain mechanisms used to decipher this symbolic information are unknown. We examined interneurons in the honeybee primary auditory center and identified different neuron types with specific properties. The results of our computational analyses suggest that inhibitory connection plays a role in encoding waggle dance signals. Our results are critical for understanding how the honeybee deciphers information from the sound produced by the waggle dance and provide new insights regarding how common neural mechanisms are used by different species to achieve communication.

Keywords: Johnston's organ; brain; dance language; honeybee; primary auditory center; vibration; waggle dance.


Figures

Figure 1.
Figure 1.
Morphology of PAC interneurons. Stained examples of the different neuron types investigated in this study (Table 1). A–E, Local interneurons arborized in the PAC neuropils DL, dSEG, and mPPL. A, DL-Int-1. This neuron type has dense arborizations in the DL and dSEG with fine spines and boutons (arrowhead), while in the medial PPL it has fine spines. The inset shows a magnification of the DL region. B–E, Four neuron types were named DL-dSEG-mPPL, DL-dSEG, DL-mPPL, and DL local according to the neuropils of arborization. F–I, Output neurons arborized in the PAC. Output neurons have dendritic arborizations in the PAC neuropiles, DL, and/or dSEG, and axon terminals in the LP and/or PPL. F, DL-Int-2 has a soma in the lateral cell cluster of the DL and arborizes with fine spines in the DL and dSEG, and with boutons in the LP (arrowheads). G–I, Three neuron types named DL-LP, DL-dSEG-LP, and DL-dSEG-wholePPL according to the neuropils of arborization. J–M, Bilateral neurons arborized in the PAC. Bilateral neurons have dendritic arborization in the bilateral PAC, DL, dSEG, or mPPL. J, Bilateral DL-dSEG-LP neurons have symmetrical arborization in both the DL and LP. This neuron type has a spine branch in the DL-dSEG and terminals with boutons in the LP (arrowheads). K–M, Three neuron types named bilateral DL-dSEG-mPPL, bilateral DL-dSEG-PPL, and bilateral mPPL-LP according to the neuropils of arborization.
Figure 2.
Figure 2.
GABA immunoreactivity of PAC interneurons. Immunohistochemically stained examples of DL-Int-1, DL-Int-2, and bilateral DL-dSEG-LP neurons. A, Whole morphology of the DL-Int-1 neuron (preparation HB130822-1). B–E, GABA immunoreactivity of DL-Int-1; the same optical section is visualized using different staining techniques. B, Image of LY-injected soma of DL-Int-1 neuron. C, Anti-synapsin labeling. D, Anti-GABA labeling. E, Merged images of B–D. Arrows indicate the position of the DL-Int-1 soma. An anti-GABA-labeled spot coincides with the soma, suggesting that the DL-Int-1 is GABAergic. mCa, Medial calyx; o.t., ocellar tract; P.B., protocerebral bridge. F, Whole morphology of DL-Int-2 (preparation 131217-2). G–J, GABA immunoreactivity of DL-Int-2; the same optical section is visualized using different staining techniques. G, DL-Int-2 soma. H, Anti-Synapsin labeling. I, Anti-GABA labeling. J, Merged images of G–I. The DL-Int-2 soma location (arrow in G and I) does not overlap with GABA immunoreactivity, suggesting DL-Int-2 is not GABAergic. K, Whole morphology of a bilateral DL-dSEG-LP neuron (preparation 130612-3). L–O, GABA immunoreactivity of bilateral DL-dSEG-LP; the same optical section is visualized using different staining techniques. L, Bilateral DL-dSEG-LP soma. M, Anti-Synapsin labeling. N, Anti-GABA labeling. O, Merged images of L–N. The bilateral DL-dSEG-LP soma does not overlap with GABA immunoreactivity, suggesting that the bilateral DL-dSEG-LP is not GABAergic.
Figure 3.
Figure 3.
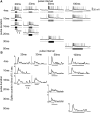
Responses of DL-Int-1 and DL-dSEG-mPPL neurons to trains of vibration pulses. Each of the records in A and B presents the data obtained from one animal. A, B, Single responses of two example neurons (preparations HB141121-1AL and HB130226-1Rh) to pulse stimuli applied to the antenna with different temporal patterns. Pulse durations were varied between 4 and 50 ms, and pulse intervals were varied between 20 and 100 ms. The carrier frequency of the pulse vibration was 265 Hz. DL-Int-1 neurons showed tonic inhibitory responses for shorter pulse durations (<50 ms), while DL-dSEG-mPPL neurons showed this response as well as a response to pulses with a longer pulse duration (100 ms). C, D, Instantaneous spike frequencies (spike counts in bins of 0.1 s) of DL-Int-1 (C) and DL-dSEG-mPPL neurons (D; N = 7). The horizontal bars indicate the duration of a train of pulses. Asterisks indicate statistical differences with the spontaneous activity in the 1 s interval before each record (*p < 0.01). DL-Int-1 neurons respond with a tonic inhibitory response to trains of pulses with a pulse interval up to 33 ms, while in DL-dSEG-mPPL neurons we also observed tonic inhibition for longer pulse durations, such as 100 ms. [Note that, owing to experimental conditions, responses to stimulation with shorter pulse durations (20 and 33 ms) were not recorded for DL-dSEG-mPPL neurons].
Figure 4.
Figure 4.
Responses of DL-Int-2 neurons to trains of vibration pulses. A, Single responses of an example neuron to pulse train stimuli applied to the antenna with different temporal patterns (preparation HB140605-2Rh). All records present the data obtained in one animal. DL-Int-2 neurons showed tonic excitatory responses during trains of vibratory pulses with different temporal patterns. B, Instantaneous spike frequencies of DL-Int-2 neurons before, during, and after the train of pulses (N = 6). The bin size was 0.1 s. The horizontal bars indicate the duration of a train of pulses. Asterisks indicate statistical differences compared with the spontaneous activity collected just before each record (*p < 0.01). DL-Int-2 neurons responded with a tonic excitatory response to a train of pulses with a duration of 16 ms and interval of 33 ms. [Note that owing to experimental conditions, responses to stimulation with shorter (20 ms) and longer (100 ms) pulse intervals and with shorter (4 ms) pulse durations were recorded in only one preparation for DL-Int-2.]
Figure 5.
Figure 5.
Responses of the bilateral DL-dSEG-LP neuron to trains of vibration pulses. Single responses of an example neuron to pulse train stimuli applied to the antenna with different temporal patterns (preparation HB140522-1AL). All records present the data obtained from the same neuron in one animal. This neuron type does not show spontaneous activity, but in response to pulse stimuli reliably shows EPSPs or spikes. Spikes or EPSPs were phase locked to the vibration pulses, even if the temporal pattern of stimuli changed (Fig. 7H,I).
Figure 6.
Figure 6.
Characteristics of responses evoked by single pulses (A–E, DL-Int-1; F–I, DL-Int-2; J, K, bilateral DL-dSEG-LP). A, Example of the on-off phasic excitation of DL-Int-1 neuron to a single pulse with a duration 100 ms. Latencies of the spike after onset and offset of the pulse stimulus are indicated by ➀ and by ➁, respectively. B, C, number (B) and frequency (C) of spikes evoked by a vibration pulse. Within each plot, different letters (a, b) indicate significant differences between values. D, E, Latencies of the spikes after stimulus-on (D) and stimulus-off (E) are not significantly different for the different pulse durations. F, Example of the response of DL-Int-2 neuron to a single pulse with a duration of 10 ms. The latency of the spike after pulse stimulus-on is indicated by the time lag between the two vertical dashed lines. G, H, Spike number (G) and spike frequency (H) evoked by single pulses with different durations. I, the latencies after pulse stimulus-on were not significantly different for different pulse durations. J, Example of the response of a bilateral DL-dSEG-LP neuron to a single pulse with a duration of 10 ms. The latency of the spike after pulse stimulus-on is indicated by the time lag between the two vertical dashed lines. K, The EPSP or spike latencies after pulse onset. Latencies were not significantly different for different pulse durations.
Figure 7.
Figure 7.
A–K, Response characteristics evoked by pulse trains (A–C, DL-Int-1; D–F, DL-Int-2; G–K, bilateral DL-dSEG-LP neurons). A, Example of the first IPSP of the DL-Int-1 neuron evoked by a train of 15 ms pulses. The latency of the IPSP is indicated by the time lag between the two vertical dashed lines. B, C, The mean latencies of the IPSPs over recordings from different preparations were not significantly different for different pulse durations (B) or pulse intervals (C). D, Example of the first spike of a DL-Int-2 neuron induced by a train of 15 ms pulses. The latency of the first spike is indicated by the time lag between the two vertical dashed lines. E, F, latencies were not significantly different for different pulse durations (E) or pulse intervals (F). G, Example of the response of a bilateral DL-dSEG-LP neuron to a train of 20 ms pulses. The latencies of the EPSPs after the pulse stimulus-on is indicated by the pairs of vertical dashed lines. H, I, The latencies of the EPSPs after pulse stimulus-on were not significantly different for different pulse durations (H) or intervals (I). J, latencies of the EPSPs after each pulse stimulus-on in a train of pulses (no significant differences). K, EPSP latencies of three different neurons for different pulse durations (no significant differences).
Figure 8.
Figure 8.
PAC network model based on the arborization and response patterns of interneurons. A, Summary of projection patterns of neurons arborizing in the PAC. Since DL-Int-1 neurons project to the DL-dSEG, where DL-Int-2 neurons arborize, DL-Int-1 neurons could have a synapse onto DL-Int-2 neurons. B, Subset of neural projections in A with putative synaptic connections (dotted lines). DL-Int-1 and DL-Int-2 neurons are assumed to have direct excitatory input from JO sensory afferents in the DL and dSEG. Since DL-Int-1 neurons are GABAergic, DL-Int-2 neurons are assumed to have an inhibitory synapse from DL-Int-1 in the DL and dSEG. C, Neurons and synapses in B represented as a network model. Synapses shown in B indicating the same connectivity in the DL and dSEG are represented by single synapses. An unknown inhibitory neuron is added between JO and DL-Int-1 to account for its inhibitory response. D, Summary of the experimental physiology of JO (bottom), DL-Int-1 (middle), and DL-Int-2 (top) neurons shown using schematic membrane traces for stimuli with shorter (∼30 ms, left column) and longer (∼100 ms, right column) pulse interval values. Note that the shorter intervals correspond to the vibration elicited during the honeybee waggle dance. JO sensory neurons tend to spike at a fixed phase of the input sinusoidal stimulus, showing spike frequency adaptation for later pulses. DL-Int-1 neurons show inhibition that is stronger for stimuli with shorter pulse intervals than those for stimuli with longer pulse intervals, and intermittent spikes occur during a train of pulses for long pulse intervals. DL-Int-2 neurons show on-phasic and tonic excitation, with the latter being weaker for stimuli with longer pulse intervals, suggesting that it arises from disinhibition due to the tonic inhibition of DL-Int-1. E, Simulation results of the network model in C for the same stimuli as in D. JO sensory neurons were assumed to spike regularly at a fixed phase of the sinusoidal stimulus applied to the antenna (bottom row). These spikes are indicated by vertical lines at the top in the bottom row and at the bottom in the middle and top rows. DL-Int-2 shows subthreshold EPSPs evoked by disinhibition through DL-Int-1. The network model could qualitatively reproduce the different spiking profiles for the two stimulus conditions.

References

    1. Ai H. (2010) Vibration-processing interneurons in the honeybee brain. Front Syst Neurosci 3:19. 10.3389/neuro.06.019.2009 - DOI - PMC - PubMed
    1. Ai H, Hagio H (2013) Morphological analysis of the primary center receiving spatial information transferred by the waggle dance of honeybees. J Comp Neurol 521:2570–2584. 10.1002/cne.23299 - DOI - PubMed
    1. Ai H, Itoh T (2012) The Auditory System of the Honeybee. In Honeybee neurobiology and behaviors, Ed 2 (Eisenhardt D, Galizia CG, Giurfa M, eds), pp 269–284. Berlin/Heidelberg, Germany: Springer.
    1. Ai H, Nishino H, Itoh T (2007) Topographic organization of sensory afferents of Johnston's organ in the honeybee brain. J Comp Neurol 502:1030–1046. 10.1002/cne.21341 - DOI - PubMed
    1. Ai H, Rybak J, Menzel R, Itoh T (2009) Response characteristics of vibration-sensitive interneurons related to Johnston's organ in the honeybee, Apis mellifera. J Comp Neurol 515:145–160. 10.1002/cne.22042 - DOI - PubMed

Publication types

LinkOut - more resources