. 2018 Jan;29(1):240-249.
doi: 10.1681/ASN.2017050518. Epub 2017 Oct 9.

Factor H Competitor Generated by Gene Conversion Events Associates with Atypical Hemolytic Uremic Syndrome

Affiliations

Factor H Competitor Generated by Gene Conversion Events Associates with Atypical Hemolytic Uremic Syndrome

Elena Goicoechea de Jorge et al. J Am Soc Nephrol. 2018 Jan.

Abstract

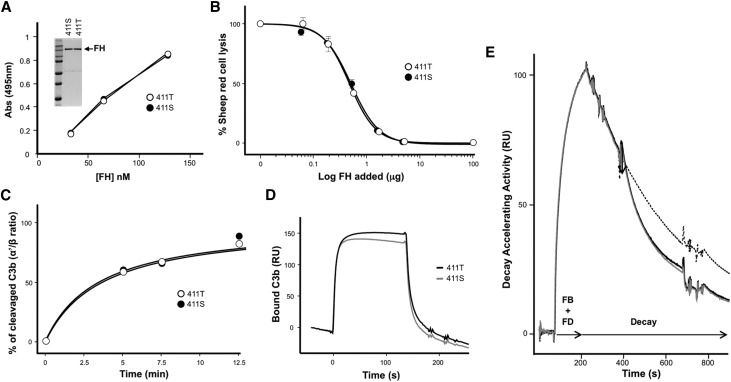
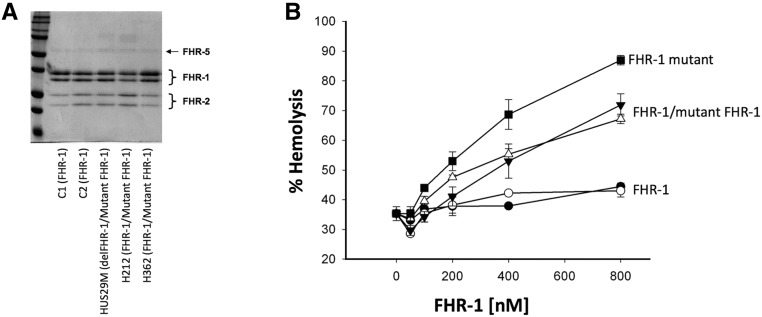
Atypical hemolytic uremic syndrome (aHUS), a rare form of thrombotic microangiopathy caused by complement pathogenic variants, mainly affects the kidney microvasculature. A retrospective genetic analysis in our aHUS cohort (n=513) using multiple ligation probe amplification uncovered nine unrelated patients carrying a genetic abnormality in the complement factor H related 1 gene (CFHR1) that originates by recurrent gene conversion events between the CFH and CFHR1 genes. The novel CFHR1 mutants encode an FHR-1 protein with two amino acid substitutions, L290S and A296V, converting the FHR-1 C terminus into that of factor H (FH). Next-generation massive-parallel DNA sequencing (NGS) analysis did not detect these genetic abnormalities. In addition to the CFHR1 mutant, six patients carried the previously uncharacterized CFH-411T variant. In functional analyses, the mutant FHR-1 protein strongly competed the binding of FH to cell surfaces, impairing complement regulation, whereas the CFH-411T polymorphism lacked functional consequences. Carriers of the CFHR1 mutation presented with severe aHUS during adulthood; 57% of affected women in this cohort presented during the postpartum period. Analyses in patients and unaffected carriers showed that FH plasma levels determined by the nonmutated chromosome modulate disease penetrance. Crucially, in the activated endothelial (HMEC-1) cell assay, reduced FH plasma levels produced by the nonmutated chromosome correlated inversely with impairment of complement regulation, measured as C5b-9 deposition. Our data advance understanding of the genetic complexities underlying aHUS, illustrate the importance of performing functional analysis, and support the use of complementary assays to disclose genetic abnormalities not revealed by current NGS analysis.

Keywords: CFHR1; complement; gene conversion; hemolytic uremic syndrome.


Figures

None
Graphical abstract
Figure 1.
Figure 1.
Genetic analysis in the patients with aHUS included in group 1. (A) Pedigrees of the six patients with aHUS included in this group. Solid symbols identify the proband in each pedigree. Small black dots identify individuals presenting the MLPA pattern shown in (B) and the DNA sequences of CFH exon 9 and CFHR1 exon 6 depicted in (C). The CFH haplotypes of each individual are shown, indicating with an asterisk the CFH haplotype that segregates with the abnormal MLPA pattern and the CFHR1 mutant. Haplotype H4b carries the delCFHR3-CFHR1. Numerals indicate the contribution of each CFH haplotype to the total plasma FH levels (milligrams per deciliter). Small gray squares indicate whether the individual is heterozygous (one square) or homozygous (two squares) for the MCPggaac risk haplotype. (B) Illustrative example of the results of the MLPA analysis in individuals labeled with small black dots showing the number of copies for each of the probes within the CFH-CFHRs genomic region. Normal copy numbers are shown with black circles, gains or losses with red circles. (C) Selected fragments of the electropherograms from the DNA Sanger sequencing analysis to show the critical DNA sequences in CFH exon 9 and CFHR1 exon 6 that share all individuals identified by the small black dots.
Figure 2.
Figure 2.
Genetic analysis in the patient with aHUS included in group 2. (A) Pedigree of the patient included in this group. Solid symbol identifies the proband. Small black dots identify individuals presenting the MLPA pattern shown in (B) and the DNA sequences of CFH exon 9 and CFHR1 exon 6 depicted in (C). The CFH haplotypes of each individual are shown, indicating with an asterisk the CFH haplotype that segregates with the abnormal MLPA pattern and the CFHR1 mutant. Haplotype H4b carries the delCFHR3-CFHR1. Numerals indicate the contribution of each CFH haplotype to the total plasma FH levels (milligrams per deciliter). Small gray squares indicate whether the individual is heterozygous (one square) or homozygous (two squares) for the MCPggaac risk haplotype. (B) Illustrative example of the results of the MLPA analysis showing the number of copies for each of the probes within the CFH-CFHRs genomic region. Normal copy numbers are shown with black circles, gains or losses with red circles. (C) Selected fragments of the electropherograms from the DNA Sanger sequencing analysis to show the critical DNA sequences in CFH exon 9 and CFHR1 exon 6 that share all individuals identified by the small black dots. Notice than the T and C nucleotides that identify the normal CFHR1 sequence L290 and A296 are in this case over-represented compared with the electropherograms shown in Figure 1. This is most likely because the primers used in the amplification of CFHR1 exon 6 fail to efficiently amplify the allele carrying the S290 and V296 genetic variants.
Figure 3.
Figure 3.
Genetic and proteomic analysis in the patients with aHUS included in group 3. (A) Pedigrees of the two patients included in this group. Solid symbol identifies the proband. Small black dots identify this individual as the only one in this pedigree presenting the MLPA pattern shown in (B). The CFH haplotypes of each individual are shown, indicating with an asterisk the CFH haplotype that segregates with the abnormal MLPA pattern and the CFHR1 mutant. Numerals indicate the total plasma FH levels (milligrams per deciliter) in the case of pedigree HUS212 and the contribution of each FH allele in the case of HUS671. (B) Results of the MLPA analysis in patient HUS212 showing the number of copies for each of the probes within the CFH-CFHRs genomic region. Normal copy numbers are shown with black circles, gains or losses with red circles. (C) Selected fragments of the electropherograms from the DNA Sanger sequencing analysis in HUS212 to illustrate that no genetic variants are identified in CFH exon 9 and in CFHR1 exon 6. (D) Figure depicts fragments of the amino acid sequences encoded by exon 23 of CFH and exon 6 of CFHR1. The tryptic peptides unique to FHR-1 and FH are underlined. (E) Coomassie-stained SDS-PAGE gel with the affinity-purified FHR-1, FHR-2, and FHR-5 proteins obtained from the plasma of a normal control and patient HUS212. White circles indicate the gel areas that were excised and subjected to tryptic digestion. (F) Table depicting the number of times that the tryptic peptides unique to FHR-1 and FH proteins were detected in the analysis of the control and HUS212 FHR-1 purified proteins. The identification that approximately 50% of peptides in the FHR-1 tryptic digest from patient HUS212 correspond to FH peptides explains the MLPA data and demonstrates that this patient is an L290S and A296V heterozygote.
Figure 4.
Figure 4.
Functional analysis of the FH-411T variant show it is a polymorphism without functional consequences. (A) Coomassie-stained SDS-PAGE gel (inset) to show that the FH-411S and FH-411T genetic variant were purified to homogeneity. FH concentrations were adjusted on the basis of the absorbance at 280 nm and were confirmed to be identical in the FH-411S and FH-411T preparations by a sandwich ELISA using polyclonal rabbit anti-FH and mouse monoclonal anti-FH antibodies. (B) Hemolytic assays using sheep erythrocytes. We considered that 100% lysis is the percentage of sheep erythrocytes that are lysed (which is approximately 40%) when they are exposed to 20% of a human serum that has been depleted of 75% of the FH. By adding increasing amounts of the FH-411S and FH-411T to the FH-depleted serum we show that both genetic variants have identical capacity to prevent the lysis of the sheep erythrocytes. Data are mean±SD of triplicates. (C) The FI-cofactor activity of the FH-411S and FH-411T genetic variants was assayed in vitro using purified proteins. The graph is a time course experiment showing the % of C3b cleaved, as determined by the α’chain/β chain ratio, after mixing 200 ng of each FH variant with 56 ng of FI and 750 ng of C3b. Both FH genetics variants resulted in identical cleavage of the C3b, supporting that their FI-cofactor activities are also identical. Data are mean±SD of triplicates. (D) FH binding to C3b. We inject 1.5 μg/ml of both the FH-411S and FH-411T protein variants to a SPR chip coated with OX24, a mouse mAb that recognizes the N-terminal region of FH, and flow subsequently C3b at a concentration of 36 μg/ml. As shown in the sensogram, both FH genetic variants show identical capacity to bind fluid phase C3b through their C-terminal region. (E) We tested the DAA of the FH-411S and FH-411T genetic variants using SPR. The AP C3-convertase was formed using a C3b-coated CM5 chip by flowing FB and FD as described previously. After a brief period allowing spontaneous decay we flow buffer (dashed line), FH-411S (gray line), and FH-411T (black line) to show that both FH variants have identical DAA. Abs, absorbance; RU, resonance units.
Figure 5.
Figure 5.
FHR-1 mutant competes with FH regulation on sheep erythrocytes. (A) Coomassie-stained SDS-PAGE gel of the FHR-1, -2, and -5 proteins purified from two normal controls (C1 and C2), two heterozygotes (HUS212 and HUS362), and one hemizygote carrier (HUS209M) of the CFHR1 mutant gene. (B) FH/FHR-1 competition assay on sheep erythrocytes. Approximately 40% of sheep erythrocytes are lysed when they are exposed to 20% of a human serum that has been depleted of 75% of the FH. Adding increasing amounts of normal FHR-1 purified from two normal individuals (solid and empty circles) to the FH-depleted serum does not significantly increase this percentage of lysis. This is in contrast with the dose-response hemolysis of sheep erythrocytes that results from the addition of FHR-1 protein purified from two WT/mutant FHR-1 heterozygotes (solid and empty triangles) or the hemizygote carrier of the mutant FHR-1 (solid squares). Data are mean±SD of triplicates.
Figure 6.
Figure 6.
Levels of FH modulate penetrance of aHUS in mutant CFHR1 carriers. (A) FH plasma levels (milligrams per deciliter) determined by the nonmutated CFH-CFHR1 haplotype in carriers of the CFHR1 mutant gene who are also Tyr402His heterozygotes (see Concise Methods). Squares and circles are levels of FH determined by the CFH allele in the nonmutated chromosome in patients and unaffected carriers, respectively. Solid squares identify patients treated with eculizumab. (B) Representative experiment of C5b-9 deposition on activated HMEC-1 cells. Levels of C5b-9, measured as fluorescence relative units (see Supplemental Methods), are represented versus levels of FH determined by the nonmutated CFH-CFHR1 haplotype in carriers of the CFHR1 mutant gene who are also Tyr402His heterozygotes. Normal upper limit of C5b-9 deposition in control sera is indicated. Asymptomatic carriers of the mutant FHR-1 protein are depicted with empty circles and aHUS patients, untreated or eculizumab-treated, with empty and solid circles, respectively.

References

    1. Moake JL: Thrombotic microangiopathies. N Engl J Med 347: 589–600, 2002 - PubMed
    1. Goodship TH, Cook HT, Fakhouri F, Fervenza FC, Fremeaux-Bacchi V, Kavanagh D, Nester CM, Noris M, Pickering MC, Rodriguez de Cordoba S, Roumenina LT, Sethi S, Smith RJ; Conference P : Atypical hemolytic uremic syndrome and C3 glomerulopathy: Conclusions from a “Kidney Disease: Improving Global Outcomes” (KDIGO) Controversies Conference. Kidney Int 91: 539–551, 2017 - PubMed
    1. de Córdoba SR: Complement genetics and susceptibility to inflammatory disease. Lessons from genotype-phenotype correlations. Immunobiology 221: 709–714, 2016 - PubMed
    1. Eyler SJ, Meyer NC, Zhang Y, Xiao X, Nester CM, Smith RJ: A novel hybrid CFHR1/CFH gene causes atypical hemolytic uremic syndrome. Pediatr Nephrol 28: 2221–2225, 2013 - PMC - PubMed
    1. Francis NJ, McNicholas B, Awan A, Waldron M, Reddan D, Sadlier D, Kavanagh D, Strain L, Marchbank KJ, Harris CL, Goodship THJ: A novel hybrid CFH/CFHR3 gene generated by a microhomology-mediated deletion in familial atypical hemolytic uremic syndrome. Blood 119: 591–601, 2012 - PubMed

Publication types

MeSH terms

Substances