. 2017 Oct 9;7(1):12843.
doi: 10.1038/s41598-017-12862-x.

α-Synuclein impairs ferritinophagy in the retinal pigment epithelium: Implications for retinal iron dyshomeostasis in Parkinson's disease

Affiliations

α-Synuclein impairs ferritinophagy in the retinal pigment epithelium: Implications for retinal iron dyshomeostasis in Parkinson's disease

Shounak Baksi et al. Sci Rep. .

Abstract

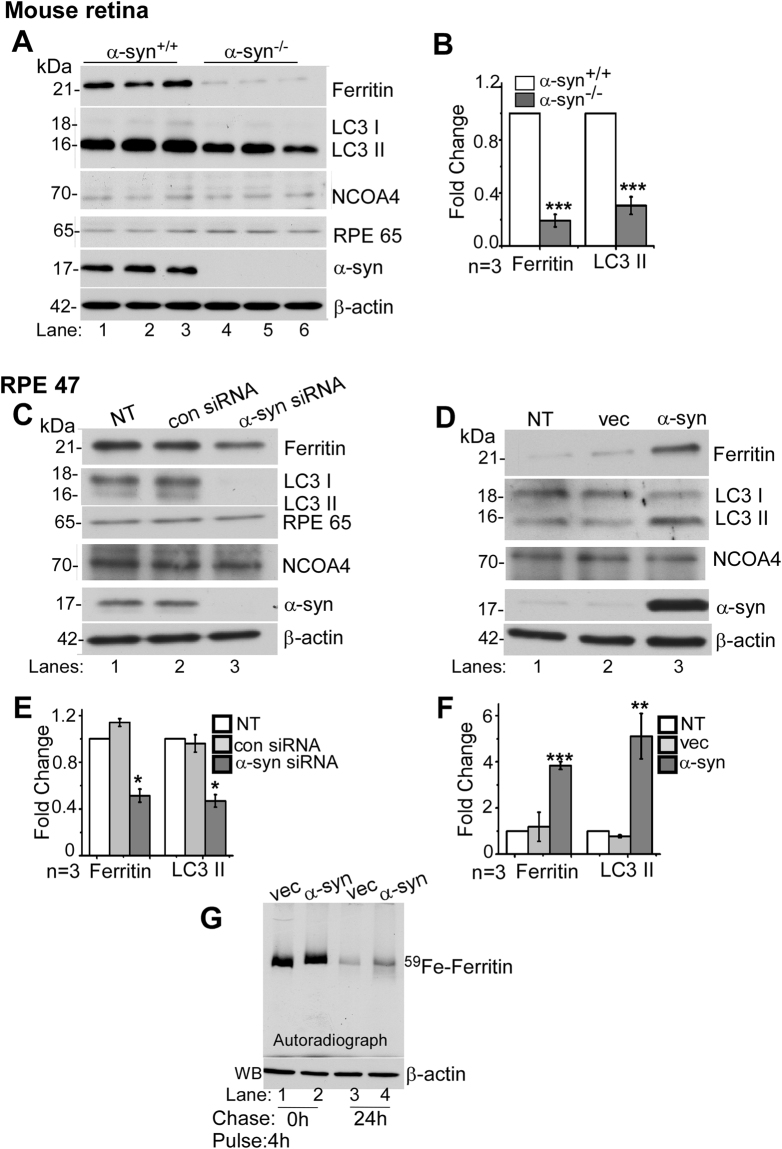
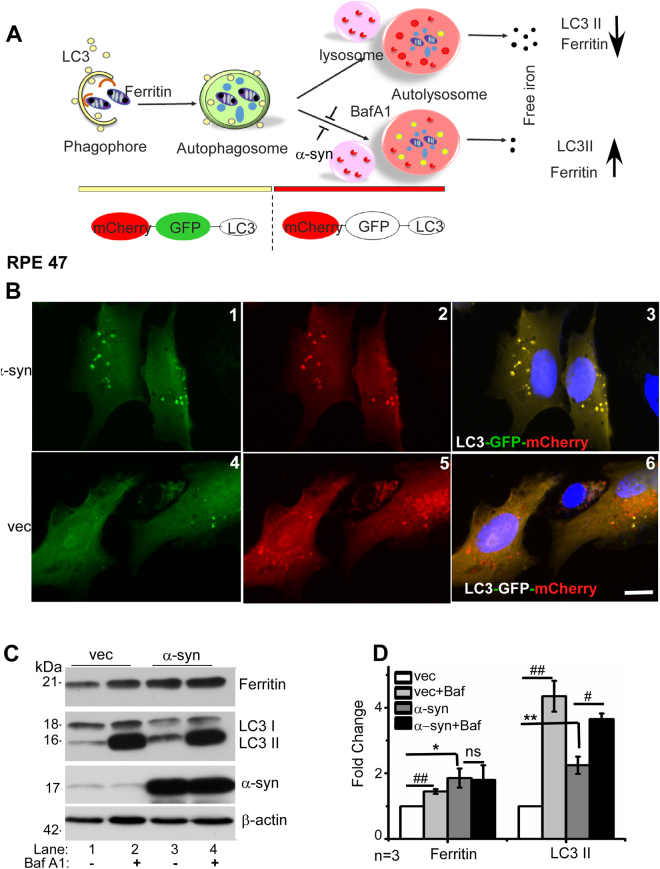
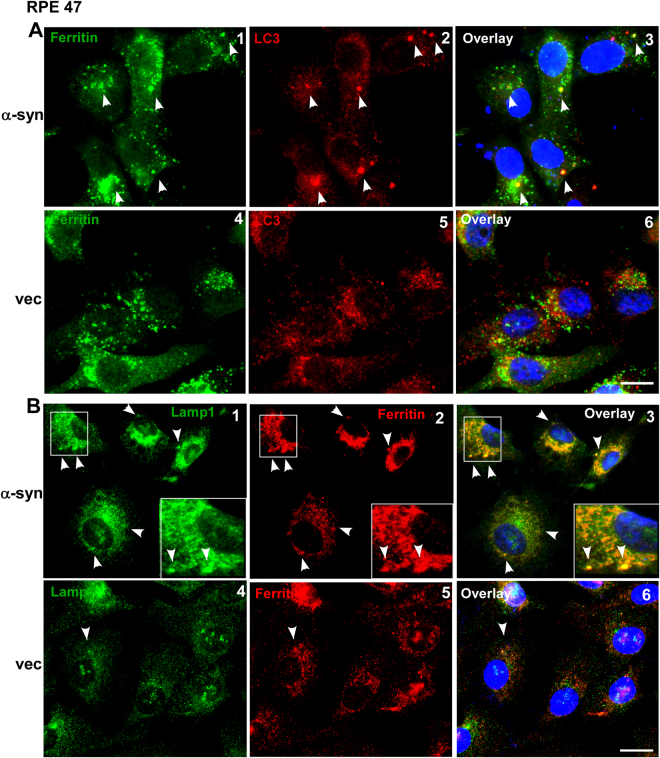
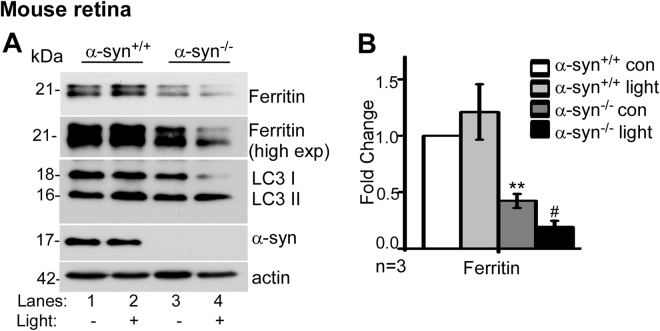
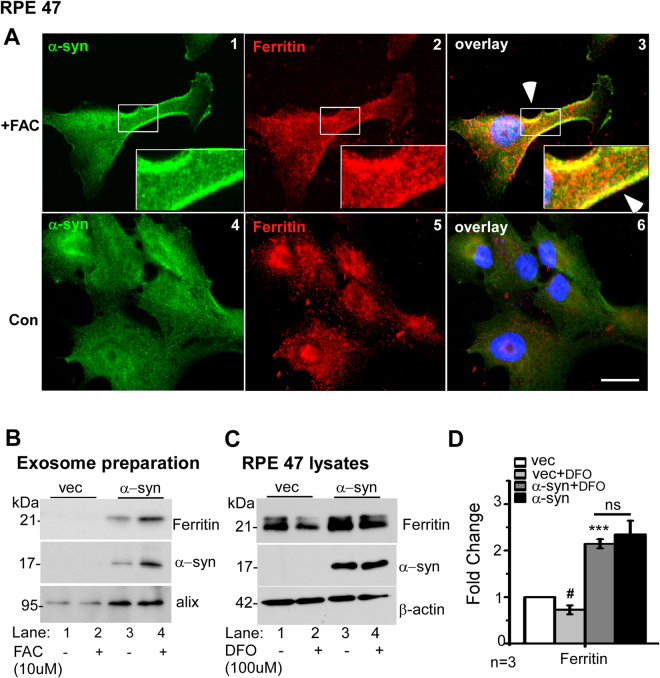
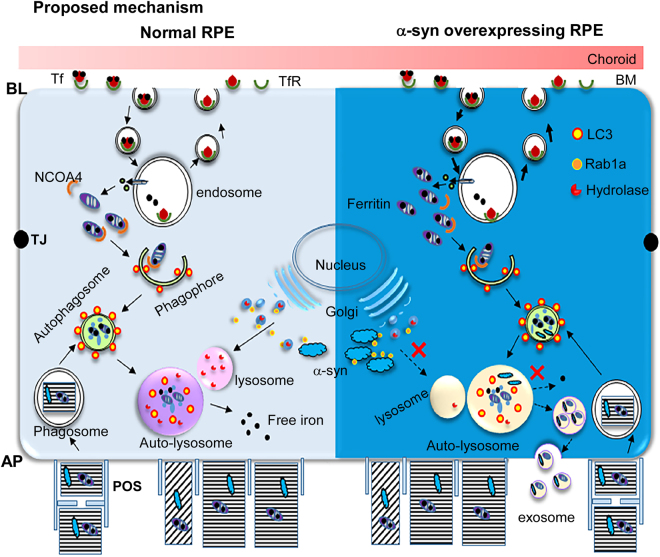
Retinal degeneration is prominent in Parkinson's disease (PD), a neuromotor disorder associated with aggregation of α-synuclein (α-syn) in the substantia-nigra (SN). Although α-syn is expressed in the neuroretina, absence of prominent aggregates suggests altered function as the likely cause of retinal pathology. We demonstrate that α-syn impairs ferritinophagy, resulting in the accumulation of iron-rich ferritin in the outer retina in-vivo and retinal-pigment-epithelial (RPE) cells in-vitro. Over-expression of Rab1a restores ferritinophagy, suggesting that α-syn impairs lysosomal function by disrupting the trafficking of lysosomal hydrolases. Surprisingly, upregulation of ferritin in RPE cells by exogenous iron in-vitro stimulated the release of ferritin and α-syn in exosomes, suggesting that iron overload due to impaired ferritinophagy or other cause(s) is likely to initiate prion-like spread of α-syn and ferritin, creating retinal iron dyshomeostasis and associated cytotoxicity. Since over-expression of α-syn is a known cause of PD, these results explain the likely cause of PD-associated retinal degeneration.


Conflict of interest statement

The authors declare that they have no competing interests.

Figures

Figure 1
Figure 1
α-Syn inhibits the degradation of ferritin and LC3II: Fig. 1: (A) Representative Western blot of retinal lysates from α-syn+/+ and α-syn−/− mice (lanes 1–3 vs. 4–6) shows expression of ferritin, LC3, α-syn, RPE65, and NCOA4. (B) Quantification by densitometry of ferritin and LC3II in α-syn−/− relative to α-syn+/+ samples. (C) Lysates of RPE 47 cells transfected with siRNA for α-syn, scrambled siRNA, and non-transfected controls were analyzed by Western blotting. Representative image shows expression of ferritin, LC3, RPE 65, NCOA4, α-syn and β-actin. (D) Expression of ferritin, LC3, NCOA4, α-syn and β-actin in non-transfected and RPE 47 cells stably expressing vector or α-syn. (E) Quantification of ferritin and LC3II expression by densitometry following knockdown of α-syn. (F) Quantification of ferritin and LC3II following over-expression of a-syn. (G) 59Fe-feriitin in vector and α-syn expressing RPE 47 cells pulsed with 59FeCl3 for 4 h (lanes 1 & 2) and chased for 0 h and 24 h. Western blotting of same volume of samples as a control for protein loading. n = 3 for all experiments. All values were normalized to β-actin that served as an internal control, and represent mean ± SEM of the indicated n (**p < 0.01, **p < 0.01 ***p < 0.001).
Figure 2
Figure 2
α-Syn impairs lysosomal function in RPE cells: (A) When expressed in cells, LC3-GFP-mCherry provides a convenient way to monitor the fusion of LC3 positive autophagosomes with lysosomes. Both GFP and mCherry fluoresce at the neutral pH of autophagosomes, emitting a yellow color. Upon fusion with lysosomes, GFP is quenched due to low pH, while mCherry continues to fluoresce. Efficient fusion of autophagosomes with lysosomes will therefore result in mainly red fluorescence, and the expected degradation of LC3II and ferritin. A block in the fusion of autophagosomes with lysosomes or elevated pH of lysosomes, mimicked pharmacologically by BafA1, will not quench GFP, resulting in yellow fluorescence, and sparing of LC3II and ferritin. (B) Representative images of LC3-GFP-mCherry transfected RPE 47 cells stably overexpressing vector or α-syn show a yellow fluorescence in vesicular structures representing autophagosomes, and red fluorescence in lysosomes due to quenching of GFP at low pH. (C) Western blot image demonstrating expression of ferritin, LC3, α-syn, and β-actin in RPE cells overexpressing α-syn or vector following treatment with 100 µM BafA1 for 12 h. (D) Quantification by densitometry after normalization with β-actin. n = 3. Values represent mean ± SEM of the indicated n (*p < 0.05, **p < 0.01, #p < 0.05, ##p < 0.01). Asterisk (*) and hash (#) signs show comparison of untreated α-syn expressing cells with vector (*) and Baf A1 treated cells with untreated controls (#) respectively.
Figure 3
Figure 3
Ferritin co-localizes with LC3 and Lamp1 in α-syn over-expressing cells: (A) Co-immunostaining of α-syn and vector-expressing cells for ferritin (green) and LC3 (red) in α-syn and vector expressing cells. (B) Co-immunostaining for ferritin (red) and Lamp1 (green) in the same cells. Scale bar 10 µm.
Figure 4
Figure 4
α-Syn impairs ferritinophagy following light-induced photoreceptor damage: (A) Western blot image demonstrating expression of ferritin, LC3, α-syn and β-actin in retinal lysates of light-exposed and control α-syn+/+ and α-syn−/− mice. (B) Quantification by densitometry after normalization with β-actin. n = 3, Values are mean ± SEM of the indicated n. **p < 0.01, #p < 0.05). Asterisk (*) indicates comparison of untreated α-syn−/− with untreated α-syn+/+ samples, and hash (#) indicates comparison of light-exposed α-syn−/− with untreated α-syn−/− controls.
Figure 5
Figure 5
α-Syn-induced lysosomal dysfunction is rescued by Rab1a: (A) Quantitative comparison of fluorescence intensity of Cathepsin-B, GCase, and lysosomal mass in vector and α-syn over-expressing cells co-transfected with Rab1a or vector. (B) Western blot image of Rab1a, ferritin, LC3, α-syn, and β-actin from vector and α-syn over-expressing cells co-transfected with Rab1a or vector. (C) Quantification of ferritin, LC3, and α-syn expression from panel B. All values were normalized to β-actin that served as an internal control. n = 3. *p < 0.05, **p < 0.01, ***p < 0.001, #p < 0.05, ##p < 0.01, ###p < 0.001). Values are mean ± SEM of the indicated n. Asterisk (*) and hash (#) signs are used to show comparison with control vector (*) and α-syn (#) expressing cells respectively.
Figure 6
Figure 6
Excess iron induces exosomal release of α-syn and ferritin: (A) Co-immunostaining of α-syn-expressing cells exposed to FAC (panels 1–3) or vehicle (panels 4–6) for α-syn (green) and ferritin (red). (B) Western blotting image of ferritin, α-syn and the exosomal marker alix from vector and α-syn over-expressing cells exposed to vehicle or FAC. (C) Western blot image of ferritin, α-syn, and β-actin from vector and α-syn over-expressing cells exposed DFO. (D) Quantification of ferritin from panel C. n = 3 #p < 0.05; ***p < 0.001). Asterisk (*) and hash (#) signs are used to show comparison of α-syn over-expressing cells with vector controls (*), and DFO treated vector-expressing cells with untreated controls (#). ns: non-significant.
Figure 7
Figure 7
Proposed mechanism. Left panel, wild type RPE cells (light blue): Iron is taken up from the basolateral domain of RPE cells by the classical Tf/TfR pathway, and excess is stored in ferritin. In addition, RPE cells accumulate iron from phagocytosed photoreceptor outer segments that is stored in ferritin. The release of iron from ferritin requires its degradation, a process mediated by NCOA4 that chaperones it to the phagophore that eventually matures into an autophagosome. Autophagosomes fuse with lysosomes, where hydrolases degrade ferritin and release the stored iron. These hydrolases are trafficked to lysosomes from the Golgi with the help of adaptor protein Rab1a. α-Syn is known to interact with Rab1a and inhibit its function, thereby disrupting the trafficking of lysosomal hydrolases. Right panel, α-syn overexpressing RPE cells (dark blue): Over-expression of α-syn sequesters Rab1a, resulting in impaired lysosomal activity and accumulation of iron-rich ferritin in lysosomes. Since α-syn is degraded by the same pathway, inhibition of lysosomal function by α-syn combined with upregulation of ferritin due to iron overloading results in the release of ferritin and α-syn containing exosomes to the extracellular milieu, probably from the AP domain of RPE cells. Abbreviations: AP: apical, BL: basolateral, TJ: tight junction, BM: Bruch’s membrane, Tf: transferrin, TfR: transferrin receptor, NCOA4: nuclear receptor coactivator 4, POS: photoreceptor outer segment.

Similar articles

Cited by

References

    1. Shulman JM, De Jager PL, Feany MB. Parkinson’s disease: genetics and pathogenesis. Annual review of pathology. 2011;6:193–222. doi: 10.1146/annurev-pathol-011110-130242. - DOI - PubMed
    1. Archibald NK, Clarke MP, Mosimann UP, Burn DJ. The retina in Parkinson’s disease. Brain: a journal of neurology. 2009;132:1128–1145. doi: 10.1093/brain/awp068. - DOI - PubMed
    1. Armstrong RA. Visual symptoms in Parkinson’s disease. Parkinson’s disease. 2011;2011:908306. - PMC - PubMed
    1. Archibald NK, Clarke MP, Mosimann UP, Burn DJ. Retinal thickness in Parkinson’s disease. Parkinsonism Relat Disord. 2011;17:431–436. doi: 10.1016/j.parkreldis.2011.03.004. - DOI - PubMed
    1. Bodis-Wollner I, Kozlowski PB, Glazman S, Miri S. alpha-synuclein in the inner retina in parkinson disease. Ann Neurol. 2014;75:964–966. doi: 10.1002/ana.24182. - DOI - PubMed

Publication types

MeSH terms