. 2017 Oct 9;8(1):808.
doi: 10.1038/s41467-017-01014-4.

A sexually dimorphic pre-stressed translational signature in CA3 pyramidal neurons of BDNF Val66Met mice

Affiliations

A sexually dimorphic pre-stressed translational signature in CA3 pyramidal neurons of BDNF Val66Met mice

Jordan Marrocco et al. Nat Commun. .

Abstract

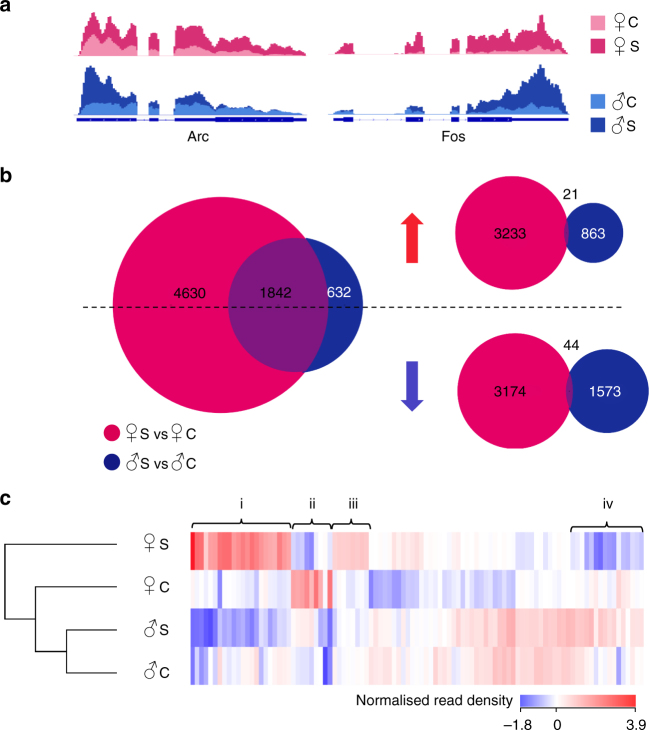
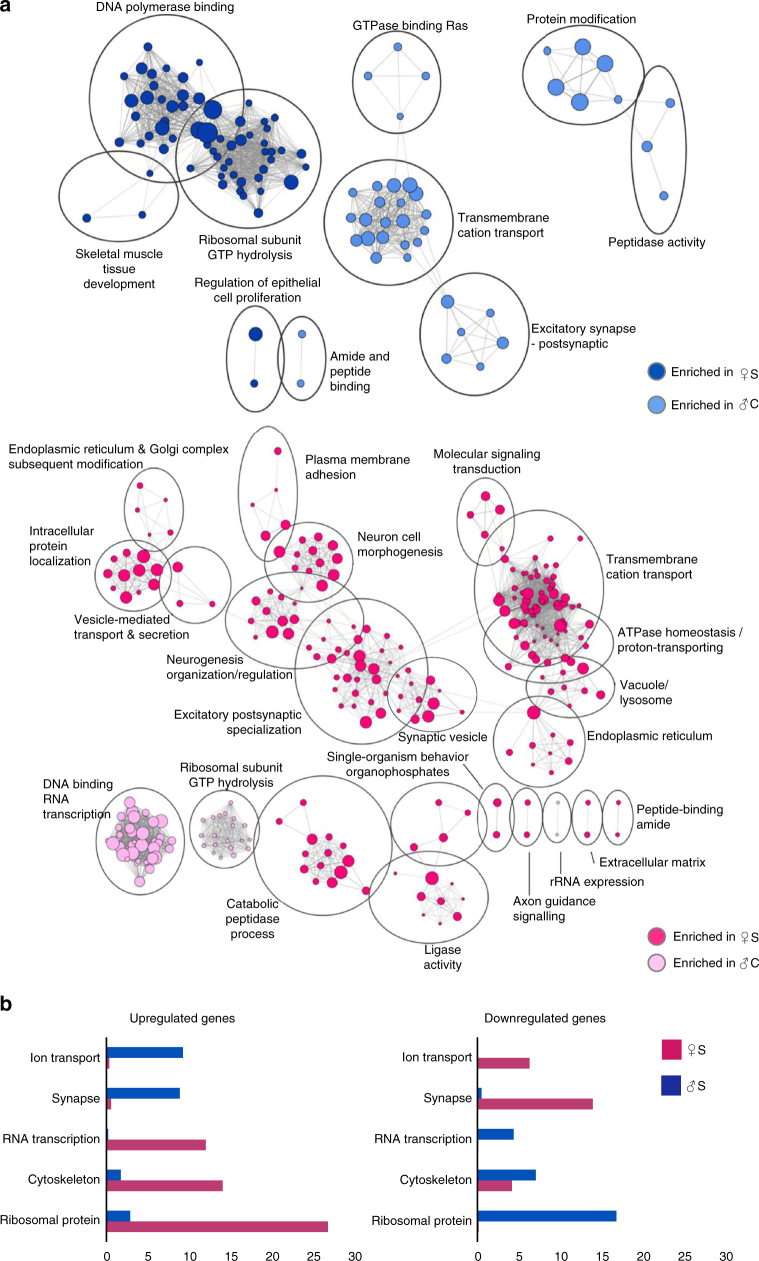
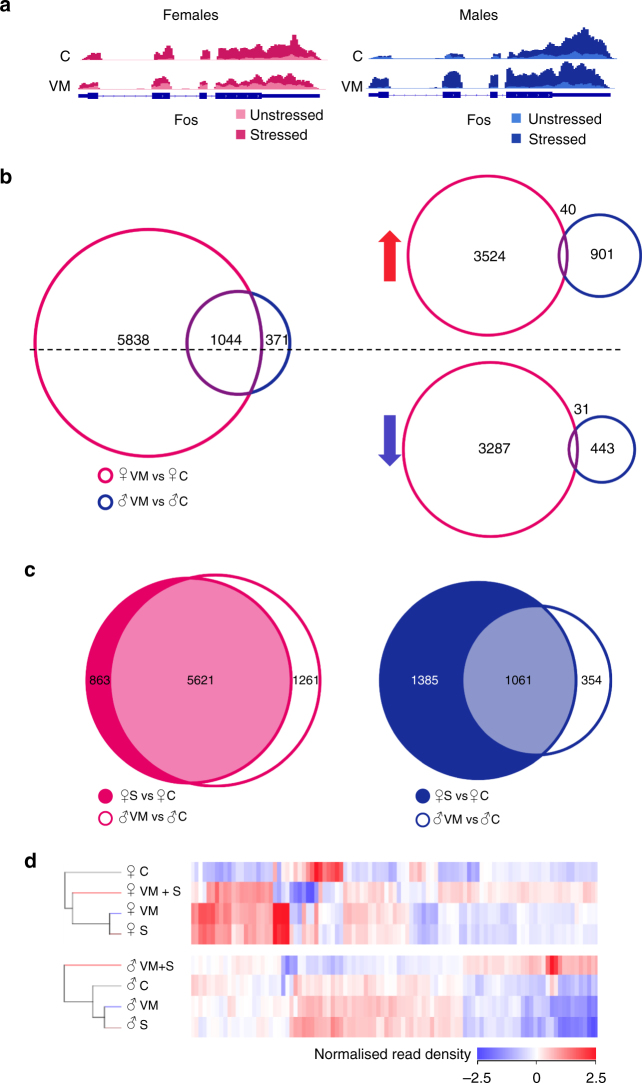
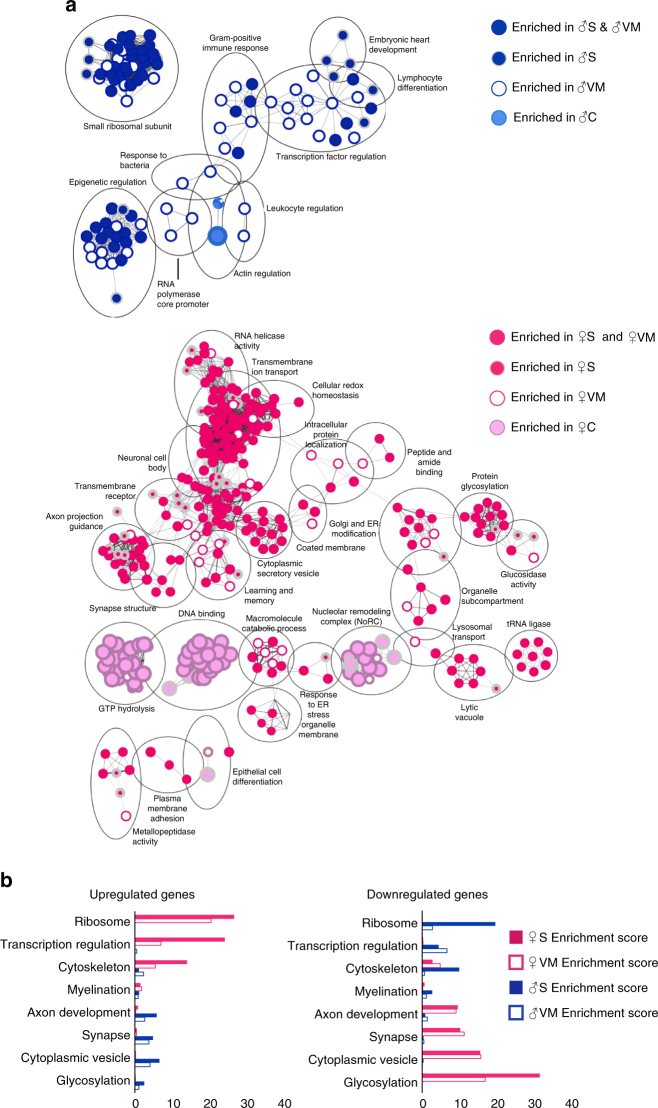
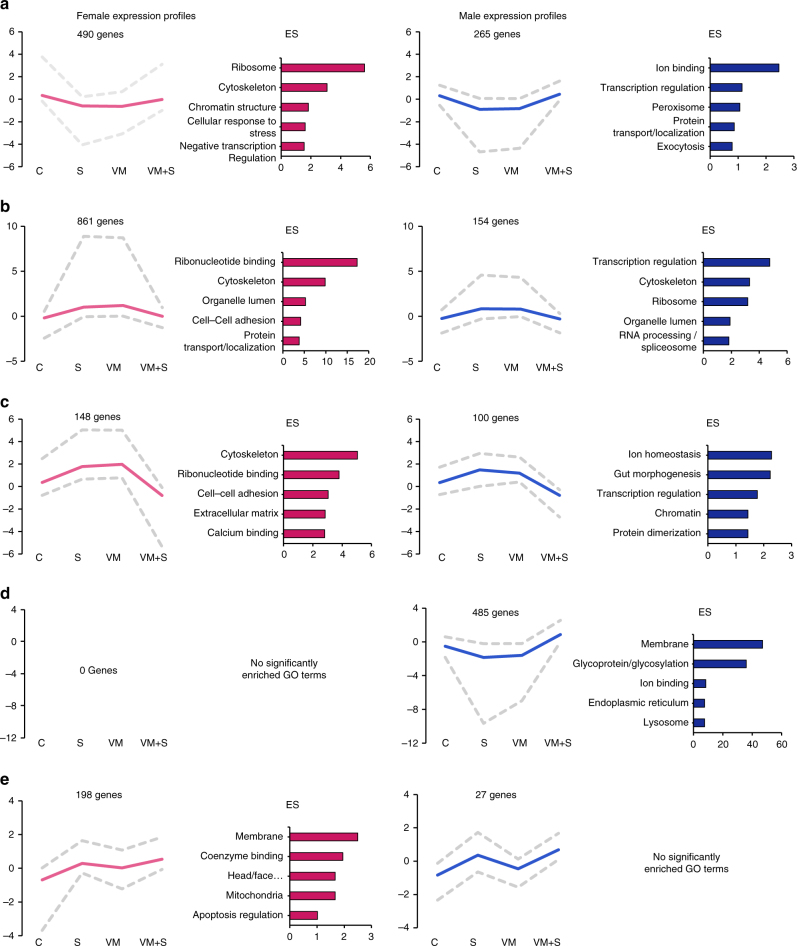
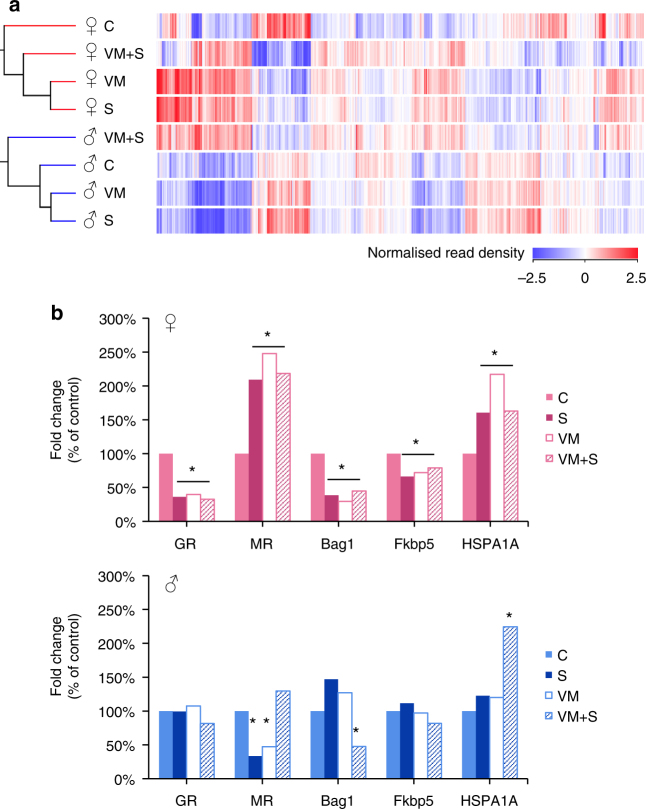
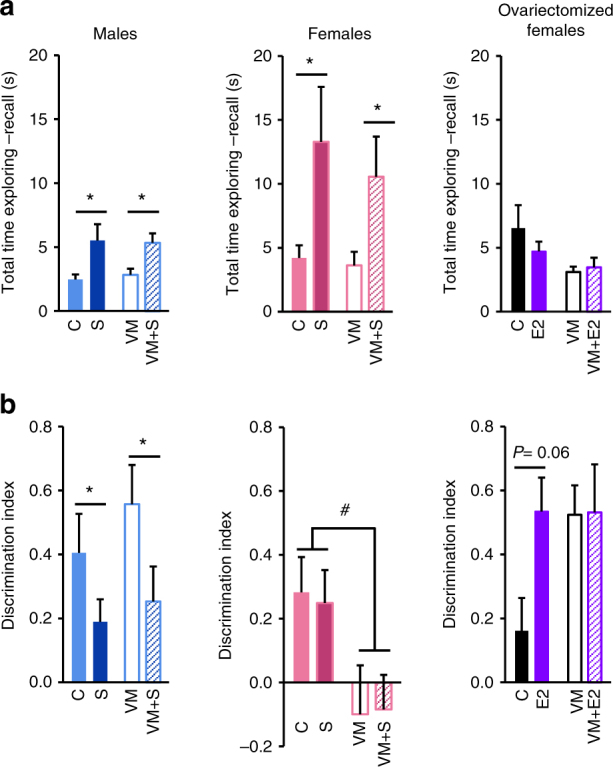
Males and females use distinct brain circuits to cope with similar challenges. Using RNA sequencing of ribosome-bound mRNA from hippocampal CA3 neurons, we found remarkable sex differences and discovered that female mice displayed greater gene expression activation after acute stress than males. Stress-sensitive BDNF Val66Met mice of both sexes show a pre-stressed translational phenotype in which the same genes that are activated without applied stress are also induced in wild-type mice by an acute stressor. Behaviourally, only heterozygous BDNF Val66Met females exhibit spatial memory impairment, regardless of acute stress. Interestingly, this effect is not observed in ovariectomized heterozygous BDNF Val66Met females, suggesting that circulating ovarian hormones induce cognitive impairment in Met carriers. Cognitive deficits are not observed in males of either genotype. Thus, in a brain region not normally associated with sex differences, this work sheds light on ways that genes, environment and sex interact to affect the transcriptome's response to a stressor.Animals' response to acute stress is known to be influenced by sex and genetics. Here the authors performed RNA-seq on actively translated mRNAs in hippocampal CA3 neurons in mice, and document the effects of sex and genotype (i.e., BDNF Val66Met) on acute stress-induced gene expression.


Conflict of interest statement

The authors declare no competing financial interests.

Figures

Fig. 1
Fig. 1
Acute stress affects CA3 neurons in a sex-dependent manner and alters a greater number of genes in females than in males. a Histogram of mapped reads showing expression of Arc and Fos, as genes representative of the immediate early gene transcription (IEG) cascade. Blue line represents the introns (thin) and exons (thick). Shaded areas indicate the number of normalized reads for female controls (light pink), stressed female (dark pink), male controls (light blue), and stressed male (dark blue). As expected, acute stress increases IEG expression in both males and females. b (Left) Venn diagram depicting the number of genes altered by acute stress in females (pink circle), males (blue circle), and in both sexes (purple overlap) (Z-score < 0.001; absolute fold change > 1.5). (Right) Venn diagrams are broken into up-regulated (red arrow) and down-regulated (blue arrow) genes. c Heat map representing the normalized read density of the 100 genes with the highest variance across all groups. Genes were clustered based on similar expression profile: (i) Genes up-regulated by stress in females and down-regulated by stress in males; (ii) Genes down-regulated by stress in females and unaffected by stress in males; (iii) Genes up-regulated by stress in females and unaltered by stress in males; (iv) Genes down-regulated by stress in females and up-regulated by stress in males. C control, S stressed
Fig. 2
Fig. 2
Acute stress regulates sex-dimorphic pathways in CA3 neurons and induces more pathways in females than in males. a Gene set enrichment map of the top 10% most enriched pathways in stressed males or females, i.e., up-regulated by stress (dark blue circles and dark pink circles, respectively) or in control males or females, i.e., down-regulated by stress (light blue circles and light pink circles, respectively) (Z-score < 0.001; absolute fold change > 1.5). Circle size correlates to the number of genes in the pathway. Grey lines connect pathways that share the same genes. Pathways are clustered based on number of shared genes and named based on biological function. b Database for Annotation, Visualization and Integrated Discovery (DAVID) enrichment scores. Up-regulated (left) and down-regulated (right) genes in stressed females (pink) and stressed males (blue) are clustered based on the GO scores and given an enrichment score. Five GO terms showing the highest enrichment score are presented as a bar graph. C control, S stressed
Fig. 3
Fig. 3
Male and female BDNFMet/+ mice show a similar transcriptional profile to stressed BDNF+/+ mice in CA3 neurons. a Histogram of mapped reads for the gene encoding c-Fos (Fos). Blue lines represent the introns (thin) and exons (thick). Shaded areas indicate the number of normalized reads for female controls (light pink), stressed females (dark pink), male controls (light blue) and stressed males (dark blue), for both BDNF+/+ and BDNFMet/+ mice. Acute stress is required to elevate c-Fox expression. b (Left) Venn diagram depicting the number of genes altered in unstressed BDNFMet/+ females (pink circle), males (blue circle) and in both sexes (purple overlap) (Z-score < 0.001; absolute fold change > 1.5) when compared with unstressed BDNF+/+. (Right) Venn diagrams are broken into up-regulated (red arrow) and down-regulated (blue arrow) genes. c (Left) Venn diagram depicting the number of genes affected in stressed BDNF+/+ (dark pink circle) or unstressed BDNFMet/+ females (white circle), or altered in both groups (light pink overlap) when compared with unstressed BDNF+/+ females (Z-score < 0.001; absolute fold change > 1.5). (Right) Venn diagram representing the number of genes affected in stressed BDNF+/+ males (dark blue circle) or unstressed BDNFMet/+ males (white circle), or altered in both groups (light blue overlap) when compared with control males (Z-score < 0.001; absolute fold change > 1.5). d Heat map representing the normalized read density of the same 100 genes, as in Fig. 1c across all groups in both males and females. The cladogram to the left indicates the similarity in gene expression profiles for each group. C unstressed BDNF+/+, S stressed BDNF+/+, VM unstressed BDNFMet/+, VM + S stressed BDNFMet/+
Fig. 4
Fig. 4
The similarity between pathways induced in stressed BDNF+/+mice and those induced in unstressed BDNFMet/+ mice are greater in females than in males. a Gene set enrichment map of the top 10% most enriched pathways in stressed BDNF+/+ males or females (dark blue circles with grey outline and dark pink circles with grey outline, respectively), enriched in unstressed BDNFMet/+ males or females (white circle with dark blue outline and white circle with dark pink outline, respectively), enriched in both stressed BDNF+/+ and unstressed BDNFMet/+ males or females (dark blue circle with dark blue outline and dark pink circle with dark blue outline, respectively), or enriched in unstressed BDNF+/+ males or females (light blue circle with light blue outline and light pink circle with light pink outline, respectively) (Z-score < 0.001; absolute fold change > 1.5). Circle size correlates to the number of genes in the pathway. Grey lines connect pathways that share genes. Pathways are clustered based on number of shared genes and named based on biological function. b DAVID enrichment scores. Up-regulated or down-regulated genes across the groups in females (pink) and males (blue) are clustered based on their GO scores and given an enrichment score. Eight GO terms showing the highest enrichment score are presented as a bar graph. C unstressed BDNF+/+, S stressed BDNF+/+, VM unstressed BDNFMet/+
Fig. 5
Fig. 5
Clustering genes by expression profile reveals similar patterns in stressed BDNF+/+ and unstressed BDNFMet/+. ae Genes were clustered based on their fold change in stressed BDNF+/+ (S), unstressed BDNFMet/+ (VM), and stressed BDNFMet/+ (VM + S) males and females versus unstressed BDNF+/+. Fold change direction and significance was determined as follows: up-regulated (z-score ≤ 0.001, fold change ≥ 1.5), down-regulated (z-score ≤ 0.001, fold change ≤ -1.5), or unaltered (z-score ≥ 0.001 and/or absolute fold change ≤ 1.5). Genes with the same expression profiles were clustered together. The maximum, mean, and minimum normalized read density for each clustered profile is presented as a line graph. GO analysis was performed using the DAVID database. The top five most enriched terms for each cluster are presented as a bar graph of their enrichment score (ES). Left: Females, Right: Males
Fig. 6
Fig. 6
Similarities in unstressed BDNFMet/+ and stressed BDNF+/+ mice in regard to glucocorticoid receptor-binding genes are sex-specific. a Heat map representing the normalized read density of GR-binding genes across all groups in both males and females. The cladogram to the left indicates the similarity in gene expression profiles. b Bar charts depicting fold change of selected genes as per cent of unstressed wild type mice in females (left) and males (right). C unstressed BDNF+/+, S stressed BDNF+/+, VM unstressed BDNFMet/+, VM + S stressed BDNFMet/+
Fig. 7
Fig. 7
The BDNF Met allele interacts with a spatial memory task in females but not in males. a Total time exploring either object during the recall phase. b Discrimination index ((displaced−stationary)/(displaced + stationary)) of BDNF+/+ and BDNFMet/+ mice during the recall day. A subset of mice in both groups had been exposed to acute stress before testing. While acute stress affected males and not females, BDNFMet/+ females showed a deficit in the discrimination index compared with BDNF+/+ females. Values are means + SEM of 8–17 determinations. *P < 0.05 versus the unstressed matched genotype; #P < 0.05 versus wild type. Intact mice: C unstressed BDNF+/+ (n = 11 male, n = 17 female), S stressed BDNF+/+ (n = 8 male, n = 11 female), VM unstressed BDNFMet/+(n = 15 male, n = 11 female), VM + S stressed BDNFMet/+ (n = 14 male, n = 9 female). Ovariectomized mice: C unstressed ovariectomized BDNF+/+ females (n = 8), E2 unstressed ovariectomized BDNF+/+ females treated with oestradiol (E2) (n = 9), VM unstressed ovariectomized BDNFMet/+ females (n = 10), VM + E2 unstressed ovariectomized BDNFMet/+ females treated with E2 (n = 9)

Similar articles

Cited by

References

    1. McEwen BS, Milner TA. Understanding the broad influence of sex hormones and sex differences in the brain. J. Neurosci. Res. 2017;95:24–39. doi: 10.1002/jnr.23809. - DOI - PMC - PubMed
    1. Beery AK, Zucker I. Sex bias in neuroscience and biomedical research. Neurosc. Biobehav. Rev. 2011;35:565–572. doi: 10.1016/j.neubiorev.2010.07.002. - DOI - PMC - PubMed
    1. Shansky RM, Woolley CS. Considering sex as a biological variable will be valuable for neuroscience research. J. Neurosci.: Off. J. Soc. Neurosci. 2016;36:11817–11822. doi: 10.1523/JNEUROSCI.1390-16.2016. - DOI - PMC - PubMed
    1. Joel D, McCarthy MM. Incorporating sex as a biological variable in neuropsychiatric research: where are we now and where should we be? Neuropsychopharmacol.: Off. Publ. Am. Coll. Neuropsychopharmacol. 2017;42:379–385. doi: 10.1038/npp.2016.79. - DOI - PMC - PubMed
    1. Bale TL, Epperson CN. Neuropsychopharmacol.: Off. Publ. Am. Coll. Neuropsychopharmacol. 2017. Sex as a biological variable: who, what, when, why, and how; pp. 386–396. - PMC - PubMed

Publication types