

Metabolic Signatures in Response to Abscisic Acid (ABA) Treatment in Brassica napus Guard Cells Revealed by Metabolomics
- PMID: 28993661
- PMCID: PMC5634414
- DOI: 10.1038/s41598-017-13166-w
Metabolic Signatures in Response to Abscisic Acid (ABA) Treatment in Brassica napus Guard Cells Revealed by Metabolomics
Abstract
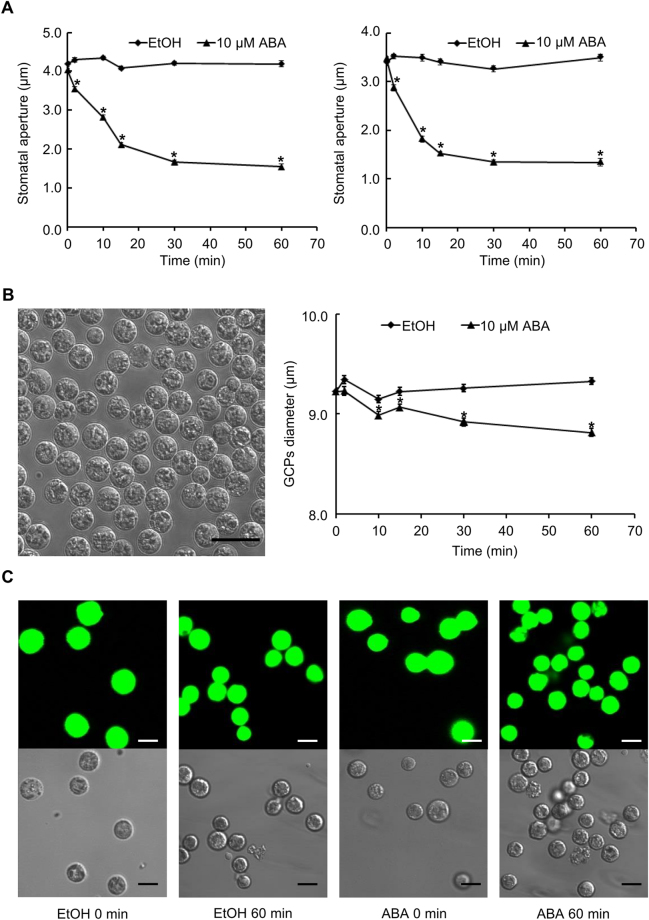
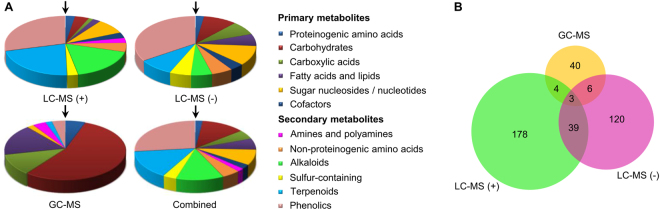
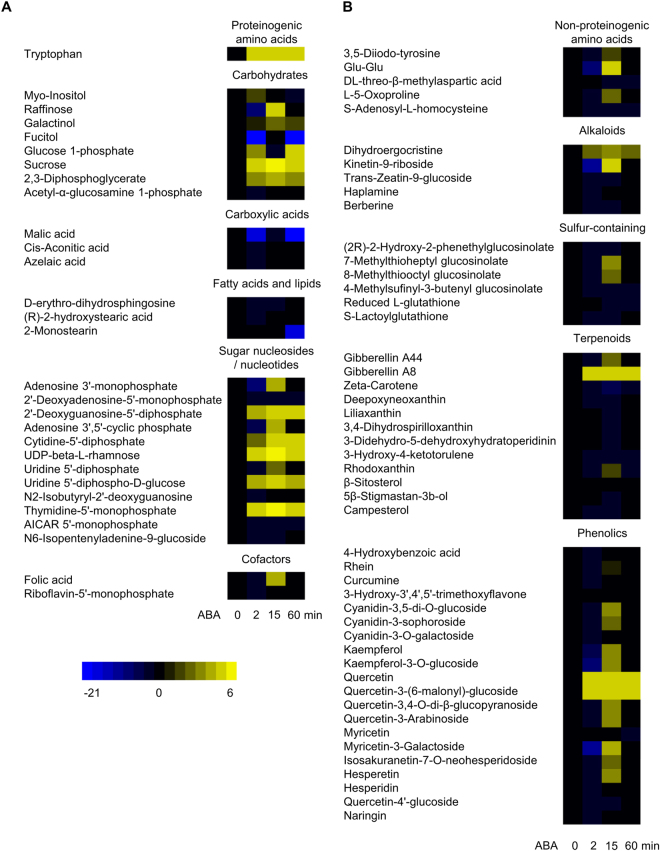
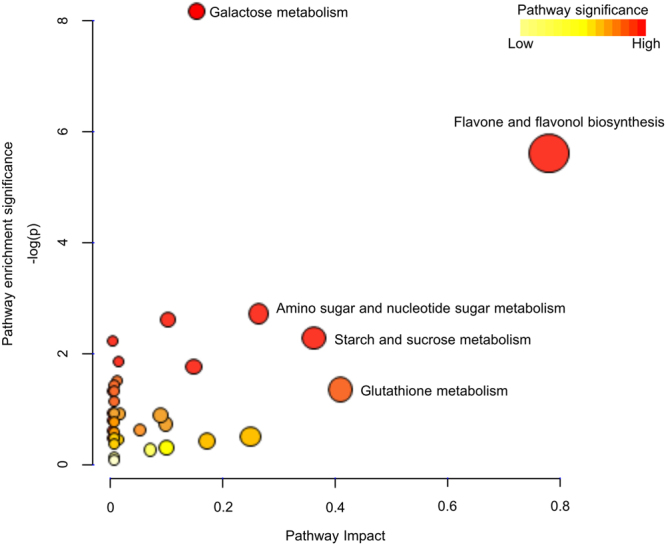
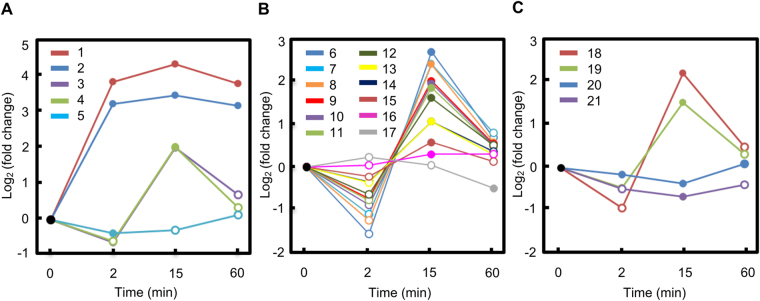
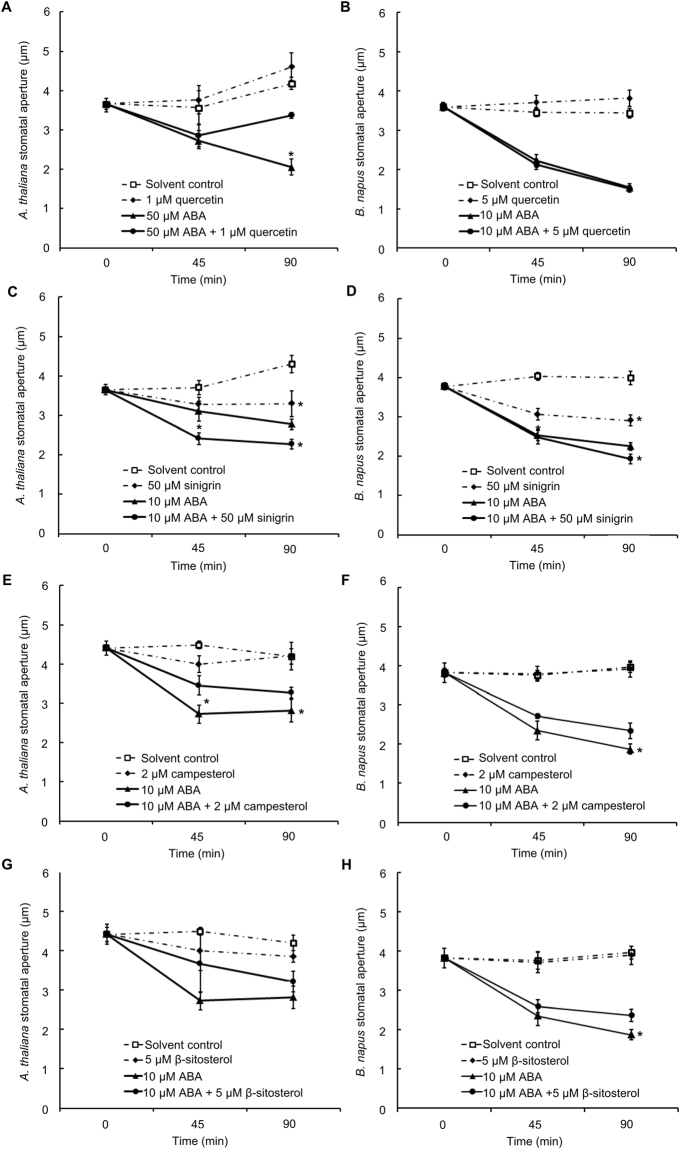
Drought can severely damage crops, resulting in major yield losses. During drought, vascular land plants conserve water via stomatal closure. Each stomate is bordered by a pair of guard cells that shrink in response to drought and the associated hormone abscisic acid (ABA). The activation of complex intracellular signaling networks underlies these responses. Therefore, analysis of guard cell metabolites is fundamental for elucidation of guard cell signaling pathways. Brassica napus is an important oilseed crop for human consumption and biodiesel production. Here, non-targeted metabolomics utilizing gas chromatography mass spectrometry (GC-MS/MS) and liquid chromatography mass spectrometry (LC-MS/MS) were employed for the first time to identify metabolic signatures in response to ABA in B. napus guard cell protoplasts. Metabolome profiling identified 390 distinct metabolites in B. napus guard cells, falling into diverse classes. Of these, 77 metabolites, comprising both primary and secondary metabolites were found to be significantly ABA responsive, including carbohydrates, fatty acids, glucosinolates, and flavonoids. Selected secondary metabolites, sinigrin, quercetin, campesterol, and sitosterol, were confirmed to regulate stomatal closure in Arabidopsis thaliana, B. napus or both species. Information derived from metabolite datasets can provide a blueprint for improvement of water use efficiency and drought tolerance in crops.
Conflict of interest statement
The authors declare that they have no competing interests.
Figures
Similar articles
-
Analysis of abscisic acid responsive proteins in Brassica napus guard cells by multiplexed isobaric tagging.J Proteomics. 2010 Feb 10;73(4):790-805. doi: 10.1016/j.jprot.2009.11.002. Epub 2009 Nov 11. J Proteomics. 2010. PMID: 19913118
-
Metabolomics of red-light-induced stomatal opening in Arabidopsis thaliana: Coupling with abscisic acid and jasmonic acid metabolism.Plant J. 2020 Mar;101(6):1331-1348. doi: 10.1111/tpj.14594. Epub 2019 Dec 15. Plant J. 2020. PMID: 31677315
-
Jasmonate-mediated stomatal closure under elevated CO2 revealed by time-resolved metabolomics.Plant J. 2016 Dec;88(6):947-962. doi: 10.1111/tpj.13296. Epub 2016 Oct 5. Plant J. 2016. PMID: 27500669
-
Protein phosphorylation in stomatal movement.Plant Signal Behav. 2014;9(11):e972845. doi: 10.4161/15592316.2014.972845. Plant Signal Behav. 2014. PMID: 25482764 Free PMC article. Review.
-
Mechanism of Stomatal Closure in Plants Exposed to Drought and Cold Stress.Adv Exp Med Biol. 2018;1081:215-232. doi: 10.1007/978-981-13-1244-1_12. Adv Exp Med Biol. 2018. PMID: 30288712 Review.
Cited by
-
Starch metabolism in guard cells: At the intersection of environmental stimuli and stomatal movement.Plant Physiol. 2024 Nov 4;196(3):1758-1777. doi: 10.1093/plphys/kiae414. Plant Physiol. 2024. PMID: 39115378 Free PMC article. Review.
-
The Imaging of Guard Cells of thioglucosidase (tgg) Mutants of Arabidopsis Further Links Plant Chemical Defence Systems with Physical Defence Barriers.Cells. 2021 Jan 25;10(2):227. doi: 10.3390/cells10020227. Cells. 2021. PMID: 33503919 Free PMC article.
-
The Cellular and Subcellular Organization of the Glucosinolate-Myrosinase System against Herbivores and Pathogens.Int J Mol Sci. 2022 Jan 29;23(3):1577. doi: 10.3390/ijms23031577. Int J Mol Sci. 2022. PMID: 35163500 Free PMC article. Review.
-
Transcriptome Analysis in Chinese Cabbage (Brassica rapa ssp. pekinensis) Provides the Role of Glucosinolate Metabolism in Response to Drought Stress.Molecules. 2018 May 15;23(5):1186. doi: 10.3390/molecules23051186. Molecules. 2018. PMID: 29762546 Free PMC article.
-
Poly-γ-glutamic acid induces system tolerance to drought stress by promoting abscisic acid accumulation in Brassica napus L.Sci Rep. 2020 Jan 14;10(1):252. doi: 10.1038/s41598-019-57190-4. Sci Rep. 2020. PMID: 31937837 Free PMC article.
References
-
- Taiz, L. & Zeiger, E. Plant Physiology. 756–757 (Sinauer Associates, Inc., 2010).
Publication types
MeSH terms
Substances
LinkOut - more resources
Full Text Sources
Other Literature Sources
Miscellaneous
