. 2017 Sep 25:8:1657.
doi: 10.3389/fpls.2017.01657. eCollection 2017.

An NAM Domain Gene, GhNAC79, Improves Resistance to Drought Stress in Upland Cotton

Affiliations

An NAM Domain Gene, GhNAC79, Improves Resistance to Drought Stress in Upland Cotton

Yaning Guo et al. Front Plant Sci. .

Abstract

Plant-specific NAC proteins comprise one of the largest transcription factor families in plants and play important roles in plant development and the stress response. Gossypium hirsutum L. is a major source of fiber, but its growth and productivity are limited by many biotic and abiotic stresses. In this study, the NAC domain gene GhNAC79 was functionally characterized in detail, and according to information about the cotton genome sequences, it was located on scaffold42.1, containing three exons and two introns. Promoter analysis indicated that the GhNAC79 promoter contained both basic and stress-related elements, and it was especially expressed in the cotyledon of Arabidopsis. A transactivation assay in yeast demonstrated that GhNAC79 was a transcription activator, and its activation domain was located at its C-terminus. The results of qRT-PCR proved that GhNAC79 was preferentially expressed at later stages of cotyledon and fiber development, and it showed high sensitivity to ethylene and meJA treatments. Overexpression of GhNAC79 resulted in an early flowering phenotype in Arabidopsis, and it also improved drought tolerance in both Arabidopsis and cotton. Furthermore, VIGS-induced silencing of GhNAC79 in cotton led to a drought-sensitive phenotype. In summary, GhNAC79 positively regulates drought stress, and it also responds to ethylene and meJA treatments, making it a candidate gene for stress studies in cotton.

Keywords: GhNAC79; cotton; development; drought; stress.


Figures
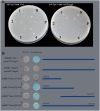
FIGURE 1
FIGURE 1
Transcriptional activation activity analysis of GhNAC79. The GhNAC79 sequence was divided into four fragments, which are marked with 1–4 respectively. (A) The phenotype of yeast strains growing on SD/-Trp/25 mM 3-AT or SD/-Trp/25 mM 3-AT/x-a-gal media. (B) The sequence information for different fragments. N/pGBKT7-LaminC + pGADT7-LargeT: negative control; P/pGBKT7-53 + pGADT7-LargeT: positive control.
FIGURE 2
FIGURE 2
The expression patterns of GhNAC79 in special tissues. (A) Samples of roots, stems, cotyledons, true leaves, flowers, and different developmental fibers were collected, and qRT-PCR was conducted to explore the expression patterns of GhNAC79. Data are shown as the mean ± SD (n = 3). GhHIS3 was used as the reference gene. (B–K) The GhNAC79 promoter was transformed into Arabidopsis with GUS as the indicator, and photographs were taken under a stereomicroscope. (B–F) Different tissues of wild type Arabidopsis. (G–K) Different tissues of transgenic Arabidopsis.
FIGURE 3
FIGURE 3
Expression patterns of GhNAC79 during cotyledon development. (A) Seven cotyledon developmental stages. Bar = 2.5 cm. (B,C) Changes in MDA and soluble protein contents during cotyledon development. D indicates the number of days after the cotyledon had spread out. (D) Expression patterns of GhNAC79 during cotyledon development. One-way ANOVA was based on varying the times for the two varieties. Different letters indicate a significant difference between two values (p < 0.01); capital letters are used for CCRI10 and lowercase for Liao4086. A t-test was conducted between two varieties at the same time point. Values between two varieties are significantly different at the 0.05 confidence level; ∗∗Values between two varieties are significantly different at the 0.01 confidence level. Data are presented as the mean ± SD (n = 3). GhHIS3 was used as the reference gene.
FIGURE 4
FIGURE 4
The expression patterns of GhNAC79 in response to stresses and plant hormones. (A,B) Cotton seedlings were cultivated in sealed glass bottles containing MS medium with different treatments. After an obvious phenotype appeared, root and leaf samples were collected separately. (A) Expression patterns of GhNAC79 in response to different stresses and plant hormones in leaves. (B) Expression patterns of GhNAC79 in response to different stresses and plant hormones in roots. (C,D) Expression patterns of GhNAC79 in response to drought and salt treatments. (C) Detached leaves were submerged in 20% PEG6000 or 200 mM NaCl, and samples were collected at different time points with h indicating the number of hours after treatment. (D) Roots of cotton seedlings were submerged in 20% PEG6000 or 200 mM NaCl, and samples were collected at different time points with D indicating the number of days after treatment. (E) Expression patterns of GhNAC79 in response to ABA, meJA and ethylene treatments with h indicating the number of hours after treatment. Data are presented as the mean ± SD (n = 3). GhHIS3 was used as the reference gene.
FIGURE 5
FIGURE 5
Phenotypes of transgenic Arabidopsis. (A) Construction of 35S::GhNAC79 vector. (B) Expression level of GhNAC79 in transgenic Arabidopsis and wild type. Data are presented as the mean ± SD (n = 3) with GhHIS3 as the reference gene. ∗∗Values significantly different from wild type at the 0.01 confidence level. (C) An early flowering phenotype of transgenic Arabidopsis compared with wild type; Line 3, Line 5, Line 10, and Line 17 were the four lines of transgenic plants.
FIGURE 6
FIGURE 6
Overexpression of GhNAC79 in Arabidopsis enhanced drought tolerance. (A,B) Plants were treated with 20% PEG6000 at 20 days after sowing; wild type represents the wild type, and OE3, OE5, OE10, and OE17 represent the four lines of transgenic Arabidopsis. (A) Phenotypes of transgenic Arabidopsis and wild type under normal management. (B) Phenotypes of all plants after drought treatment. (C,D) Transgenic plants and wild type were treated with 20% PEG6000 at 14 days after sowing. (C) Phenotypes of transgenic plants and wild type. (D) Stomatal aperture of transgenic Arabidopsis and wild type. (E) Phenotypes of transgenic Arabidopsis and wild type after treatment with 100 mM mannitol in 1/2 MS medium. (F) Differences in dry/wet ratios between transgenic plants and the wild type after mannitol treatment. Values significantly different from wild type at the 0.05 confidence level. ∗∗Values significantly different from wild type at the 0.01 confidence level.
FIGURE 7
FIGURE 7
Overexpression of GhNAC79 enhanced drought tolerance in cotton. (A,B) pCLCrVA-pCLCrVB system. (A) The expression of GhNAC79 in virus-infected plants and the control (pCLCrVA). All virus-infected plants were divided into four groups and marked 1–4. (B) After drought treatment, the phenotypes of virus-infected cotton seedling and the control with pCLCrVA::PDS as the indicator, pCLCrVA as the control, and pCLCrVA::GhNAC79 representing the virus-infected cotton seedlings. (C,D) pYL156-pYL192 system. (C) The expression level of GhNAC79 in virus-infected plants and the control (pYL156). All virus-infected plants were divided into four groups and marked 1–4. (D) After drought treatment, the phenotypes of virus-infected cotton seedlings and the control with pYL156::PDS as the indicator, pYL156 as the control, and pYL156::GhNAC79 representing the virus-infected cotton seedlings. (E–G) The phenotype of cotton overexpressing GhNAC79 at the T1 stage. Line 8 and Line 36 were two lines of transgenic cotton, and the control was CCRI24 (a cotton cultivar used as a transgenic recipient). (E) Stomatal movement of transgenic cotton and control. (F,G) After drought treatment, transgenic cotton showed higher drought resistance compared with the control. (F) Seven days after drought treatment; (G) 14 days after drought treatment. Values significantly different from the control at the 0.05 confidence level. ∗∗Values significantly different from the control at the 0.01 confidence level. Data are presented as the mean ± SD (n = 3). GhHIS3 was the reference gene.
FIGURE 8
FIGURE 8
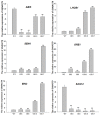
Expression levels of 6 senescence-related genes in transgenic and wild type Arabidopsis. ∗∗Values significantly different from wild type at the 0.01 confidence level. Data are presented as the mean ± SD (n = 3). GhHIS3 was used as the reference gene.

Similar articles

Cited by

References

    1. Ahuja I., de Vos R. C., Bones A. M., Hall R. D. (2010). Plant molecular stress responses face climate change. Trends Plant Sci. 15 664–674. 10.1016/j.tplants.2010.08.002 - DOI - PubMed
    1. Aida M., Ishida T., Fukaki H., Fujisawa H., Tasaka M. (1997). Genes involved in organ separation in Arabidopsis: an analysis of the cup-shaped cotyledon mutant. Plant Cell 9 841–857. 10.1105/tpc.9.6.841 - DOI - PMC - PubMed
    1. Albertos P., Romero-Puertas M. C., Tatematsu K., Mateos I., Sánchez-Vicente I., Nambara E., et al. (2015). S-nitrosylation triggers ABI5 degradation to promote seed germination and seedling growth. Nat. Commun. 6 8669 10.1038/ncomms9669 - DOI - PMC - PubMed
    1. Balazadeh S., Siddiqui H., Allu A. D., Matallana-Ramirez L. P., Caldana C., Mehrnia M., et al. (2010). A gene regulatory network controlled by the NAC transcription factor ANAC092/AtNAC2/ORE1 during salt-promoted senescence. Plant J. 62 250–264. 10.1111/j.1365-313X.2010.04151.x - DOI - PubMed
    1. Bartels D., Sunkar R. (2005). Drought and salt tolerance in plants. Crit. Rev. Plant Sci. 24 23–58. 10.1080/07352680590910410 - DOI

LinkOut - more resources