. 2017 Dec 15;595(24):7347-7368.
doi: 10.1113/JP274842. Epub 2017 Nov 9.

Calcium and electrical dynamics in lymphatic endothelium

Affiliations

Calcium and electrical dynamics in lymphatic endothelium

Erik J Behringer et al. J Physiol. .

Abstract

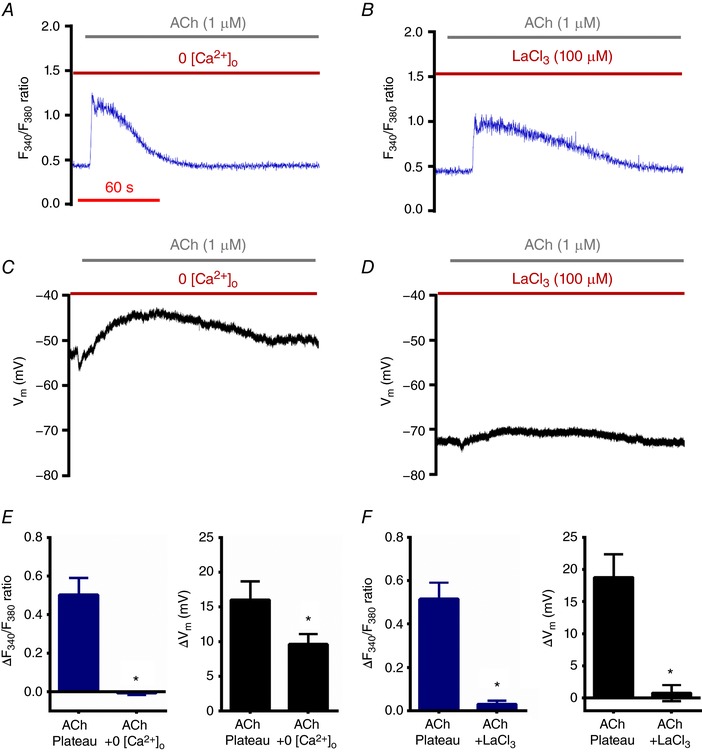
Key points: Endothelial cell function in resistance arteries integrates Ca2+ signalling with hyperpolarization to promote relaxation of smooth muscle cells and increase tissue blood flow. Whether complementary signalling occurs in lymphatic endothelium is unknown. Intracellular calcium and membrane potential were evaluated in endothelial cell tubes freshly isolated from mouse collecting lymphatic vessels of the popliteal fossa. Resting membrane potential measured using intracellular microelectrodes averaged ∼-70 mV. Stimulation of lymphatic endothelium by acetylcholine or a TRPV4 channel agonist increased intracellular Ca2+ with robust depolarization. Findings from Trpv4-/- mice and with computational modelling suggest that the initial mobilization of intracellular Ca2+ leads to influx of Ca2+ and Na+ through TRPV4 channels to evoke depolarization. Lymphatic endothelial cells lack the Ca2+ -activated K+ channels present in arterial endothelium to generate endothelium-derived hyperpolarization. Absence of this signalling pathway with effective depolarization may promote rapid conduction of contraction along lymphatic muscle during lymph propulsion.

Abstract: Subsequent to a rise in intracellular Ca2+ ([Ca2+ ]i ), hyperpolarization of the endothelium coordinates vascular smooth muscle relaxation along resistance arteries during blood flow control. In the lymphatic vasculature, collecting vessels generate rapid contractions coordinated along lymphangions to propel lymph, but the underlying signalling pathways are unknown. We tested the hypothesis that lymphatic endothelial cells (LECs) exhibit Ca2+ and electrical signalling properties that facilitate lymph propulsion. To study electrical and intracellular Ca2+ signalling dynamics in lymphatic endothelium, we excised collecting lymphatic vessels from the popliteal fossa of mice and removed their muscle cells to isolate intact LEC tubes (LECTs). Intracellular recording revealed a resting membrane potential of ∼-70 mV. Acetylcholine (ACh) increased [Ca2+ ]i with a time course similar to that observed in endothelium of resistance arteries (i.e. rapid initial peak with a sustained 'plateau'). In striking contrast to the endothelium-derived hyperpolarization (EDH) characteristic of arteries, LECs depolarized (>15 mV) to either ACh or TRPV4 channel activation. This depolarization was facilitated by the absence of Ca2+ -activated K+ (KCa ) channels as confirmed with PCR, persisted in the absence of extracellular Ca2+ , was abolished by LaCl3 and was attenuated ∼70% in LECTs from Trpv4-/- mice. Computational modelling of ion fluxes in LECs indicated that omitting K+ channels supports our experimental results. These findings reveal novel signalling events in LECs, which are devoid of the KCa activity abundant in arterial endothelium. Absence of EDH with effective depolarization of LECs may promote the rapid conduction of contraction waves along lymphatic muscle during lymph propulsion.

Keywords: TRP channels; calcium-activated K+ channel; endothelium-derived hyperpolarizing factor; mathematical model.


Figures

Figure 1
Figure 1. Lack of KCa channel activity governing V m in lymphatic endothelium and absence of SKCa and IKCa transcript expression
A, respective bars indicate changes in resting V m in response to acetylcholine (ACh; 1 μm), TRPV4 activation (GSK101; 100 nm), inward rectifying K+ channel blockade (BaCl2; 100 μm), SKCa/IKCa activation (NS309; 1 μm), SKCa/IKCa blockade (apamin (Ap; 300 nm) + charybdotoxin (ChTx; 100 nm)), large conductance Ca2+‐activated K+ (BKCa) channel block (paxilline (Pax); 1 μm), ATP‐sensitive K+ (KATP) channel activation (levcromakalim (Levcro); 10 μm) and KATP channel blockade (glyburide (Gly; 10 μm)). Depolarization (P < 0.05) occurred in response to ACh, GSK and BaCl2 for ‘(n)’ experiments. Resting V m of LECTs varied from ∼−50 to −80 mV, and therefore respective treatment effects are reported as changes (ΔV m) from resting V m preceding treatment. B, endpoint PCR images indicating mRNA expression of SKCa (Kcnn3), IKCa (Kcnn4), smooth muscle α‐actin (Acta2) and vascular endothelial cadherin (Cdh5) for individual popliteal artery, collecting lymphatic vessel, arterial endothelial cell tube (AECT) and lymphatic endothelial cell tube (LECT). The intact artery and intact lymphatic vessel both expressed mRNA for SKCa and IKCa. In contrast, the LECT did not express mRNA for either SKCa or IKCa, while the AECT expressed abundant mRNA for both of these genes. Brain and thoracic aorta were used as positive controls for KCa channels and cell type‐specific markers (i.e. smooth muscle α‐actin and endothelial cadherin), respectively. For negative controls (Control), no template was loaded.
Figure 2
Figure 2. Lack of EDH in lymphatic endothelium
A, brightfield image of an AECT isolated from a popliteal artery. B, as in A for a LECT isolated from a popliteal lymphatic vessel; note the valve (arrow) in B that is absent in A. Scale bars (white) in A and B indicate 50 μm. C, recording of Fura‐2 fluorescence response to ACh for an AECT. D, as in C for a LECT. In both traces, note rapid increase in the F 340/F 380 ratio (‘peak’; ≤20 s of ACh onset) that was sustained (i.e. ‘plateaued’) for the duration of ACh exposure. E, simultaneous recording of V m during ACh from an AECT. F, as in E from a LECT. Note that the change V m in E is hyperpolarization that mirrors dynamics in [Ca2+]i in C. In contrast a gradual depolarization occurs in in F that begins approximately during the [Ca2+]i peak phase in D. G, summary of changes in F 340/F 380 values for AECTs and LECTs in response to ACh during the peak (≤20 s of ACh onset) and plateau (90 s following peak) phase of responses. H, as in G for corresponding changes in V m. Data represent n = 4 AECTs and n = 13 LECTs. * P < 0.05, responses different from artery.
Figure 3
Figure 3. Acetylcholine depolarizes endothelium of intact lymphatic vessels
A, recording of V m in the endothelial layer of a pressurized (3 cmH2O) Ing‐Ax lymphatic collecting vessel at rest and during ACh (1 μm). Note ∼50 mV depolarization to ACh treatment. B, summary of lymphatic endothelium resting V m in pressurized Ing‐Ax vessels and in response to ACh. * P < 0.05, response different from control. Data represent n = 3 Ing‐Ax lymphatic vessels, each from a separate C57BL/6 mouse.
Figure 4
Figure 4. Role of [Ca2+]o during depolarization of V m to ACh in lymphatic endothelium
A, recording of Fura‐2 fluorescence during ACh in the absence of [Ca2+]o in a LECT. B, as in A, in the presence of 2 mm [Ca2+]o and during treatment with LaCl3, a broad‐spectrum blocker of Ca2+‐permeable channels in the plasma membrane. Note that the plateau phase is abolished in both A and B (compare to Fig. 2 D). C, as in A, with recording of V m. D, as in B, with recording of V m. Note that depolarization is impaired in C and D (compare to Fig. 2 F). E, summary of changes in F 340/F 380 ratio (left) and V m (right) during the plateau phase (90 s) of the response to ACh in the presence and absence of 2 mm [Ca2+]o. F, as in E, indicating treatment with LaCl3 (+2 mm [Ca2+]o). Values were obtained at the same time points in paired experiments (ACh versus ACh + LaCl3) corresponding to the abolished F 340/F 380 plateau (∆F 340/F 380 ≈ 0 recorded, ∼ 2.5 min after ACh onset) via treatment with LaCl3. Data represent n = 5 paired experiments with ACh ± 2 mm [Ca2+]o and n = 4 paired experiments with ACh ± LaCl3. * P < 0.05, responses different from ACh (with 2 mm [Ca2+]o) alone.
Figure 5
Figure 5. Opening of TRPV4 channels leads to depolarization of lymphatic endothelium
A, recording of Fura‐2 fluorescence during GSK101 (with 2 mm [Ca2+]o) in lymphatic endothelium. B, as in A, with 0 [Ca2+]o. C, as in A, with LaCl3. Note that increases in F 340/F 380 are abolished in B and C. D, as in A, with recording of V m. E, as in B, with recording of V m. F, as in C, with recording of V m. Note that the depolarization in E (GSK101 + 0 [Ca2+]o) is absent in F (GSK101 + LaCl3). G, summary of changes in F 340/F 380 ratio at 3 min following onset of GSK101 with 2 mm [Ca2+]o present, GSK101 + 0 [Ca2+]o and with GSK101 + LaCl3. H, as in G, for changes in V m. * P < 0.05, responses different from GSK101 with 2 mm [Ca2+]o. Data represent n = 5 experiments for GSK101 with 2 mm [Ca2+]o), n = 4 for GSK101 with 0 [Ca2+]o and n = 4 for GSK101 with LaCl3.
Figure 6
Figure 6. Lack of TRPV4 channels reduces [Ca2+]i and eliminates depolarization to ACh and GSK101 in lymphatic endothelium
A, recording of Fura‐2 fluorescence during ACh with 2 mm [Ca2+]o in a LECT isolated from a Trpv4 −/− mouse. B, as in A, with GSK101. C, as in a A, with recording of V m. D, as in B, with recording of V m. Note that the plateau in F 340/F 380 and depolarization are diminished during ACh treatment (A and C) and are abolished during GSK101 treatment (B and D) when compared to LECTs from C57BL/6 (WT) mice. D, as in B, with recording of V m. E, summary of changes in F 340/F 380 values (left) and V m (right) during the ACh plateau phase (90 s) in LECTs isolated from WT (n = 13) vs. Trpv4 −/− mice (n = 4). F, as in E, indicating data at 3 min following onset of GSK101 treatment (WT and Trpv4 −/−; n = 5 each). For E, WT data during ACh treatment were taken from Fig. 2 G (∆[Ca2+]i) and Fig. 2 H (∆V m). For F, WT data during GSK101 treatment were taken from Fig. 5 G (∆[Ca2+]i) and Fig. 5 H (∆V m). * P < 0.05, responses different between LECTs isolated from WT versus Trpv4 −/− mice.
Figure 7
Figure 7. Schematic diagram of ion channels and pumps in computational model of lymphatic endothelium
A variety of channels and pumps are present in LECs; see ‘Methods’ for detailed description. K+ currents are in green, Na+ currents are in red, Cl currents are in black and Ca2+ currents are in blue. ACh stimulation leads to IP3 formation and activation of the IP3R on the endoplasmic reticulum. Calcium ions in the cytosol and endoplasmic reticulum are buffered with calmodulin (CaM) and calreticulin (CRT).
Figure 8
Figure 8. Computational modelling: intracellular Ca2+ changes with V m during stimulation with ACh
A, [Ca2+]i changes during ACh stimulation in lymphatic endothelium. The pattern of rapid increase in [Ca2+]i followed by a sustained plateau is similar to the one observed in Fura‐2 experiments (Fig. 2 D). B, as in A, in the absence of [Ca2+]o in lymphatic endothelium, or C, in the presence of 2 mm [Ca2+]o and during virtual blockade of TRPV4 and Orai channels. Note that removal of the Ca2+ from outside or blockade of membrane Ca2+ channels in the model also results in an abolished plateau phase (compare to Fig. 4 A and B). D, V m during ACh for lymphatic endothelium showing the depolarization similar to experimental recordings (Fig. 2 F). E, as in D, with V m calculated during ACh in the absence of [Ca2+]o, or F, in the presence of 2 mm [Ca2+]o and during virtual blockade of TRPV4 and Orai channels (compare to Fig. 4 C and D). Note that depolarization is abolished only with LaCl3 and not in the absence of [Ca2+]o, suggesting a role for Na+ currents in depolarization.
Figure 9
Figure 9. Computational modelling: intracellular Ca2+ changes with V m during continuous stimulation with GSK101
A, [Ca2+]i changes during GSK101 (with 2 mm [Ca2+]o) in lymphatic endothelium. Opening TRPV4 channels leads to an increase in [Ca2+]i similar to that observed in Fura‐2 experiments (Fig. 5 A). B, as in A, in the absence of [Ca2+]o in lymphatic endothelium, or C, in the presence of 2 mm [Ca2+]o and during virtual blockade of TRPV4 and Orai channels. Note that removal of external Ca2+ or blockade of membrane Ca2+ channels in the model abolished any change in [Ca2+]i (compare to Fig. 5 B and C). D, V m during GSK (with 2 mm [Ca2+]o) for lymphatic endothelium showing depolarization similar to experimental recording (Fig. 5 D). E, as in D, calculated V m during GSK101 in the absence of [Ca2+]o in lymphatic endothelium, or F, in the presence of 2 mm [Ca2+]o and during virtual blockade of TRPV4 and Orai channels. Note that depolarization is present in E (GSK + 0 [Ca2+]o) but not in F (GSK + LaCl3) similar to the experimental recording (compare to Fig. 5 E and F). Further, note similarities in C and F compared to Fig. 5 C and F, respectively, consistent with recordings obtained from LECTs of Trpv4 −/− mice.
Figure 10
Figure 10. Computational modelling: dynamics in ionic fluxes and open probability of key channels, exchangers, and pumps
A, V m under baseline conditions (time < 0 s) and during ACh (starting at time 0 s). B, as in A for the equilibrium potential for Ca2+ (E Ca), equilibrium potential for Na+ (E Na), equilibrium potential for K+ (E K) and equilibrium potential for Cl (E Cl). C, for [K+], [Na+], [Cl] and [Ca2+]IS. D, for [Ca2+]i and [IP3]i. E, for I IP3R, I SERCA and I leak. F, I PMCA, I TRP,Ca, I TRPV4,Ca and I Orai. G, for 3 × I NaK, I TRP,Na, I TRPV4,Na. H, for −2 × I NaK (negative sign is to account for inward K+ current by NaK), I Kir and I leak,K. I, for I CaCC and I VRAC. In C, [Na+] is plotted multiplied by a factor of 10, and [Ca2+]IS by a factor of 100 for visualization. Note that negative currents are inward and positive currents are outward. V m is shown in cyan and [IP3] is in magenta while concentration and currents for K+ are in green, Na+ are in red, Cl are in black and Ca2+ are in blue. For direct comparison, this figure contains similar types of data to Fig. 7 from Silva et al. (2007), which shows the model for mesenteric artery endothelium in response to ACh.

Comment in

References

    1. Aspelund A, Robciuc MR, Karaman S, Makinen T & Alitalo K (2016). Lymphatic system in cardiovascular medicine. Circ Res 118, 515–530. - PubMed
    1. Bagher P & Segal SS (2011). Regulation of blood flow in the microcirculation: role of conducted vasodilation. Acta Physiol (Oxf) 202, 271–284. - PMC - PubMed
    1. Behringer EJ & Segal SS (2012). Tuning electrical conduction along endothelial tubes of resistance arteries through Ca2+‐activated K+ channels. Circ Res 110, 1311–1321. - PMC - PubMed
    1. Behringer EJ & Segal SS (2015). Membrane potential governs calcium influx into microvascular endothelium: integral role for muscarinic receptor activation. J Physiol 593, 4531–4548. - PMC - PubMed
    1. Behringer EJ, Socha MJ, Polo‐Parada L & Segal SS (2012). Electrical conduction along endothelial cell tubes from mouse feed arteries: confounding actions of glycyrrhetinic acid derivatives. Br J Pharmacol 166, 774–787. - PMC - PubMed

Publication types

Substances

LinkOut - more resources