MALDI Mass Spectrometry Imaging: A Novel Tool for the Identification and Classification of Amyloidosis
- PMID: 28994248
- PMCID: PMC5725723
- DOI: 10.1002/pmic.201700236
MALDI Mass Spectrometry Imaging: A Novel Tool for the Identification and Classification of Amyloidosis
Abstract
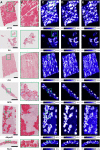
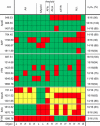
Amyloidosis is a group of diseases caused by extracellular accumulation of fibrillar polypeptide aggregates. So far, diagnosis is performed by Congo red staining of tissue sections in combination with polarization microscopy. Subsequent identification of the causative protein by immunohistochemistry harbors some difficulties regarding sensitivity and specificity. Mass spectrometry based approaches have been demonstrated to constitute a reliable method to supplement typing of amyloidosis, but still depend on Congo red staining. In the present study, we used matrix-assisted laser desorption/ionization mass spectrometry imaging coupled with ion mobility separation (MALDI-IMS MSI) to investigate amyloid deposits in formalin-fixed and paraffin-embedded tissue samples. Utilizing a novel peptide filter method, we found a universal peptide signature for amyloidoses. Furthermore, differences in the peptide composition of ALλ and ATTR amyloid were revealed and used to build a reliable classification model. Integrating the peptide filter in MALDI-IMS MSI analysis, we developed a bioinformatics workflow facilitating the identification and classification of amyloidosis in a less time and sample-consuming experimental setup. Our findings demonstrate also the feasibility to investigate the amyloid's protein composition, thus paving the way to establish classification models for the diverse types of amyloidoses and to shed further light on the complex process of amyloidogenesis.
Keywords: MALDI MS imaging; amyloidosis; formalin-fixed and paraffin-embedded; ion mobility separation.
© 2017 The Authors, Proteomics Published by WILEY-VCH Verlag GmbH & Co. KGaA, Weinheim.
Figures


Comment in
-
Proteomics with Mass Spectrometry Imaging: Beyond Amyloid Typing.Proteomics. 2018 Apr;18(7):e1700353. doi: 10.1002/pmic.201700353. Epub 2018 Mar 8. Proteomics. 2018. PMID: 29389069
References
-
- Puchtler H., Sweat F., Levine M., J. Histochem. Cytochem. 1962, 10, 355.
-
- Howie A. J., Brewer D. B., Micron 2009, 40, 285. - PubMed
-
- Howie A. J., Brewer D. B., Howell D., Jones A. P., Lab. Invest. 2008, 88, 232. - PubMed
-
- Sipe J. D., Benson M. D., Buxbaum J. N., Ikeda S. I., Merlini G., Saraiva M. J., Westermark P., Amyloid 2016, 23, 209. - PubMed
-
- Schönland S. O., Hegenbart U., Bochtler T., Mangatter A., Hansberg M., Ho A. D., Lohse P., Röcken C., Blood 2012, 119, 488. - PubMed
MeSH terms
Substances
LinkOut - more resources
Full Text Sources
Other Literature Sources
Medical
Research Materials

