

Impact of PET/CT system, reconstruction protocol, data analysis method, and repositioning on PET/CT precision: An experimental evaluation using an oncology and brain phantom
- PMID: 28994465
- PMCID: PMC5734628
- DOI: 10.1002/mp.12623
Impact of PET/CT system, reconstruction protocol, data analysis method, and repositioning on PET/CT precision: An experimental evaluation using an oncology and brain phantom
Abstract
Purpose: In longitudinal oncological and brain PET/CT studies, it is important to understand the repeatability of quantitative PET metrics in order to assess change in tracer uptake. The present studies were performed in order to assess precision as function of PET/CT system, reconstruction protocol, analysis method, scan duration (or image noise), and repositioning in the field of view.
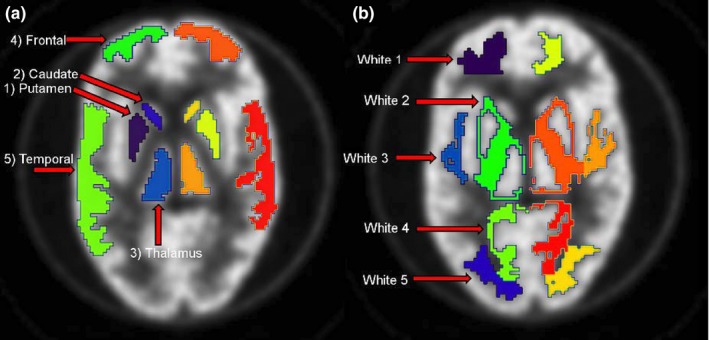
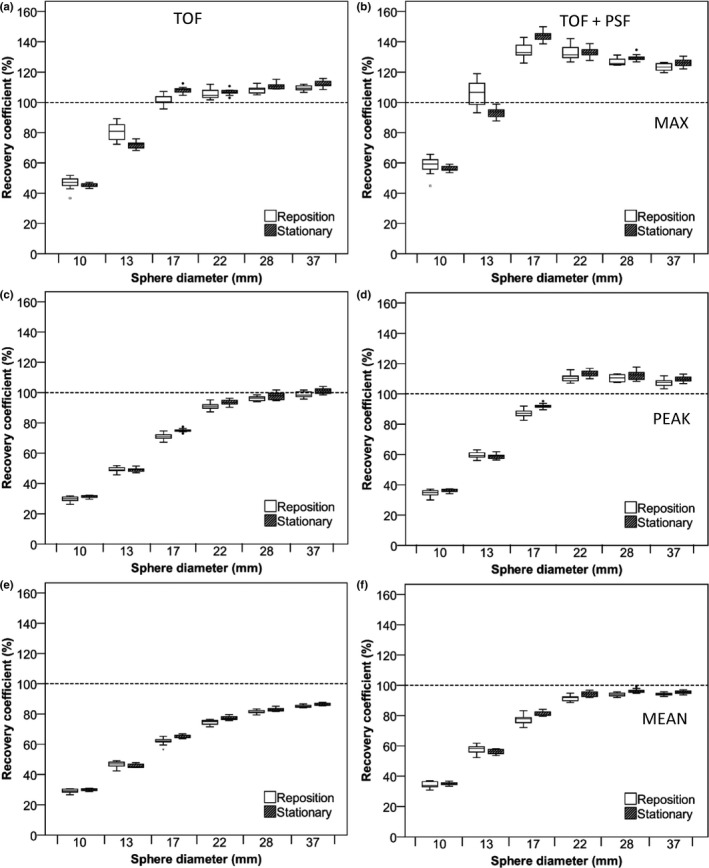
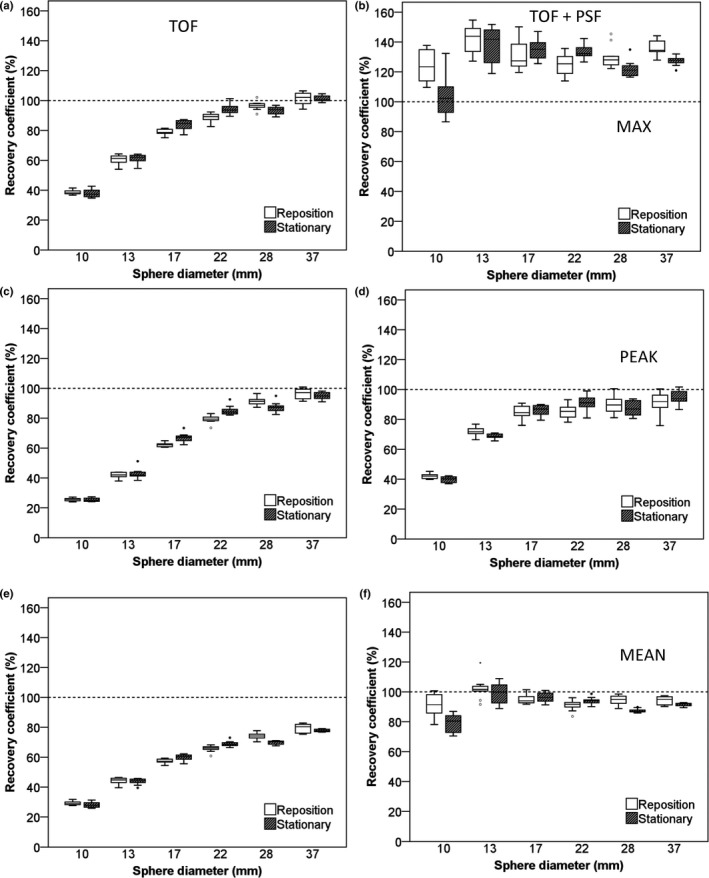
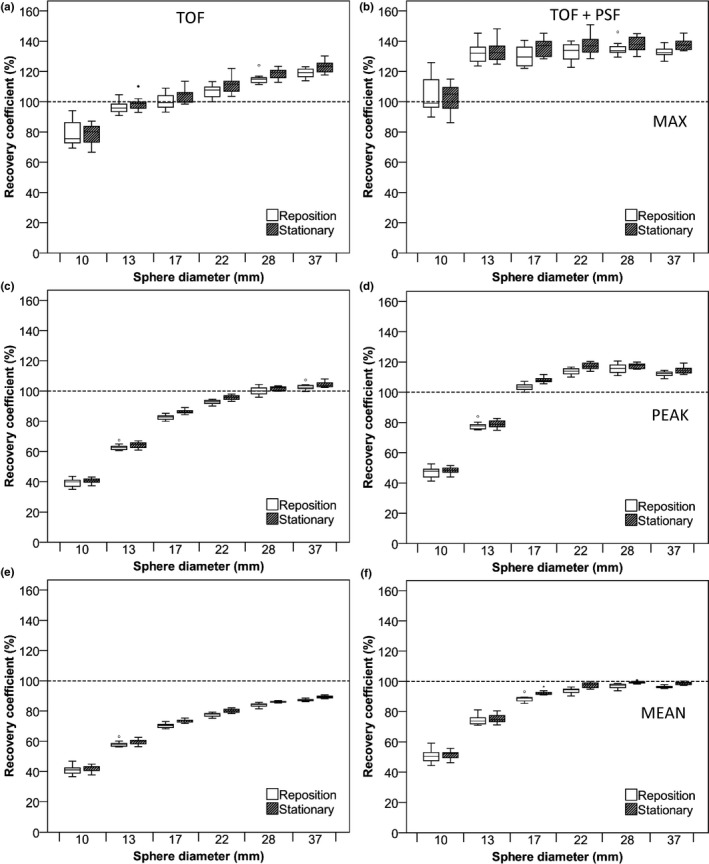
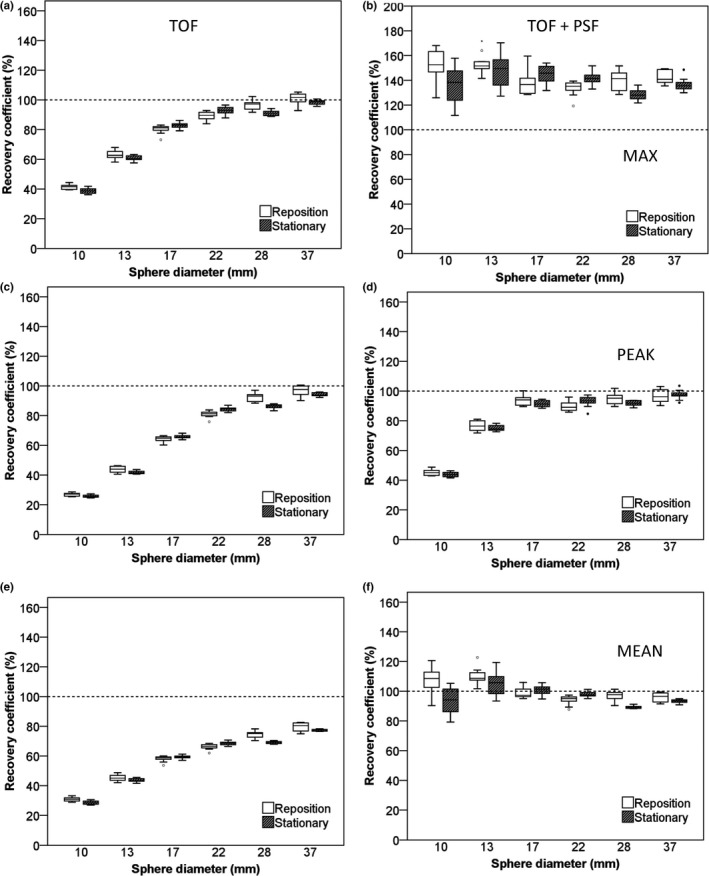
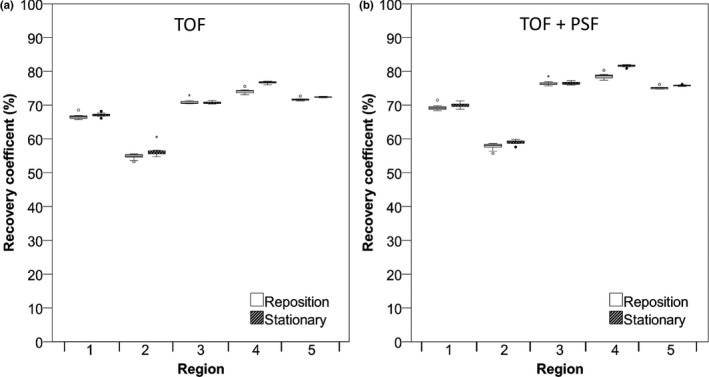
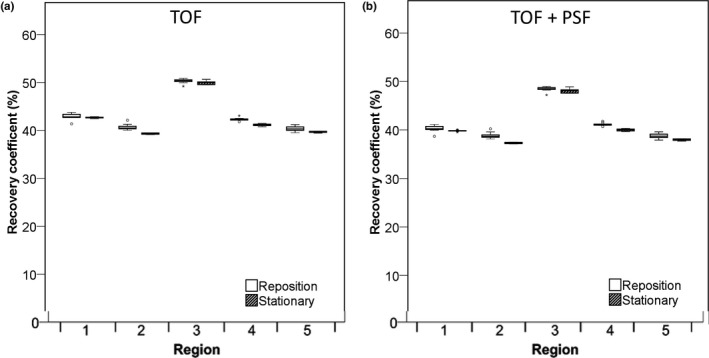
Methods: Multiple (repeated) scans have been performed using a NEMA image quality (IQ) phantom and a 3D Hoffman brain phantom filled with 18 F solutions on two systems. Studies were performed with and without randomly (< 2 cm) repositioning the phantom and all scans (12 replicates for IQ phantom and 10 replicates for Hoffman brain phantom) were performed at equal count statistics. For the NEMA IQ phantom, we studied the recovery coefficients (RC) of the maximum (SUVmax ), peak (SUVpeak ), and mean (SUVmean ) uptake in each sphere as a function of experimental conditions (noise level, reconstruction settings, and phantom repositioning). For the 3D Hoffman phantom, the mean activity concentration was determined within several volumes of interest and activity recovery and its precision was studied as function of experimental conditions.
Results: The impact of phantom repositioning on RC precision was mainly seen on the Philips Ingenuity PET/CT, especially in the case of smaller spheres (< 17 mm diameter, P < 0.05). This effect was much smaller for the Siemens Biograph system. When exploring SUVmax , SUVpeak , or SUVmean of the spheres in the NEMA IQ phantom, it was observed that precision depended on phantom repositioning, reconstruction algorithm, and scan duration, with SUVmax being most and SUVpeak least sensitive to phantom repositioning. For the brain phantom, regional averaged SUVs were only minimally affected by phantom repositioning (< 2 cm).
Conclusion: The precision of quantitative PET metrics depends on the combination of reconstruction protocol, data analysis methods and scan duration (scan statistics). Moreover, precision was also affected by phantom repositioning but its impact depended on the data analysis method in combination with the reconstructed voxel size (tissue fraction effect). This study suggests that for oncological PET studies the use of SUVpeak may be preferred over SUVmax because SUVpeak is less sensitive to patient repositioning/tumor sampling.
Keywords: 3D Hoffman brain phantom; IQ NEMA phantom; PET/CT; phantom repositioning; repeatability; reproducibility.
© 2017 The Authors. Medical Physics published by Wiley Periodicals, Inc. on behalf of American Association of Physicists in Medicine.
Figures
References
-
- Dehdashti F, Siegel BA, Griffeth LK, et al. Benign versus malignant intraosseous lesions: discrimination by means of PET with 2‐[F‐18]fluoro‐2‐deoxy‐D‐glucose. Radiology. 1996;200:243–247. - PubMed
-
- Hoekstra CJ, Hoekstra OS, Stroobants SG, et al. Methods to monitor response to chemotherapy in non‐small cell lung cancer with 18F‐FDG PET. J Nucl Med. 2002;43:1304–1309. - PubMed
-
- Hoekstra CJ, Paglianiti I, Hoekstra OS, et al. Monitoring response to therapy in cancer using [18F]‐2‐fluoro‐2‐deoxy‐D‐glucose and positron emission tomography: an overview of different analytical methods. Eur J Nucl Med. 2000;27:731–743. - PubMed
-
- Krak NC, van der Hoeven JJ, Hoekstra OS, Twisk JW, van der Wall E, Lammertsma AA. Measuring [(18)F]FDG uptake in breast cancer during chemotherapy: comparison of analytical methods. Eur J Nucl Med Mol Imaging. 2003;30:674–681. - PubMed
-
- Aoki J, Watanabe H, Shinozaki T, et al. FDG‐PET for preoperative differential diagnosis between benign and malignant soft tissue masses. Skeletal Radiol. 2003;32:133–138. - PubMed
Publication types
MeSH terms
Grants and funding
LinkOut - more resources
Full Text Sources
Other Literature Sources
Medical
