. 2017 Oct 10:4:170151.
doi: 10.1038/sdata.2017.151.

Clustergrammer, a web-based heatmap visualization and analysis tool for high-dimensional biological data

Affiliations

Clustergrammer, a web-based heatmap visualization and analysis tool for high-dimensional biological data

Nicolas F Fernandez et al. Sci Data. .

Abstract

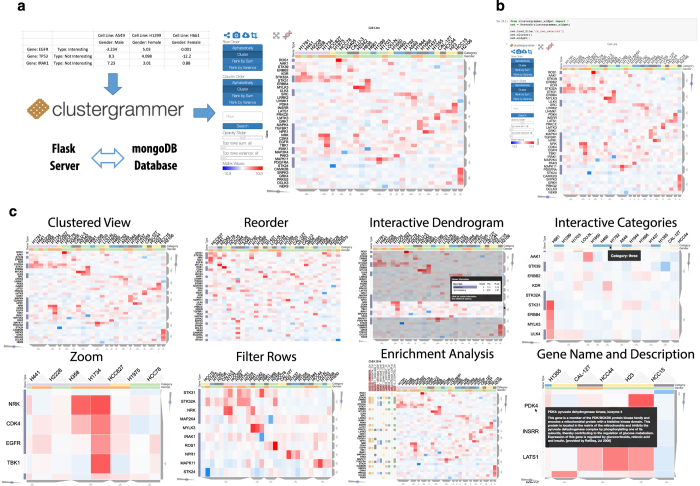
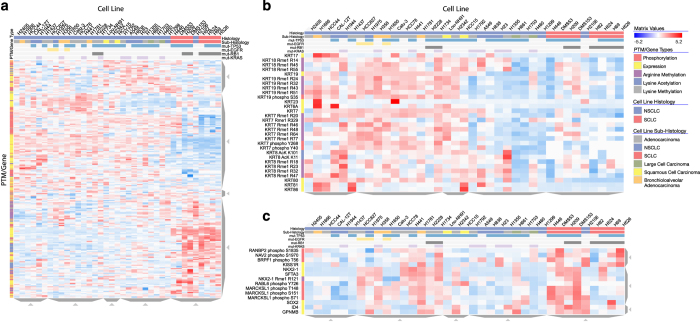
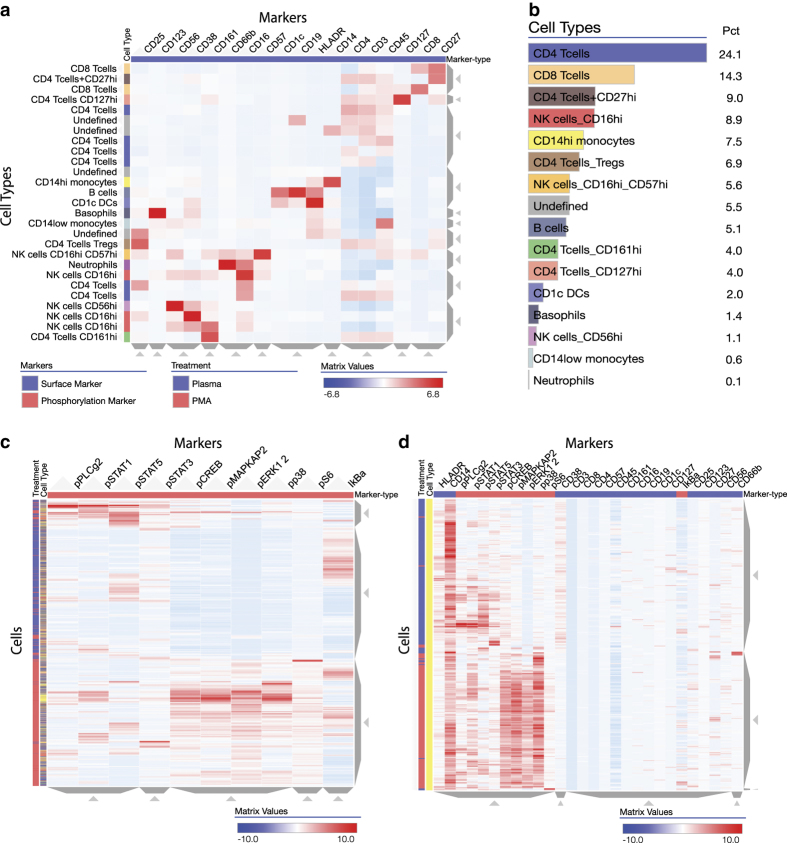
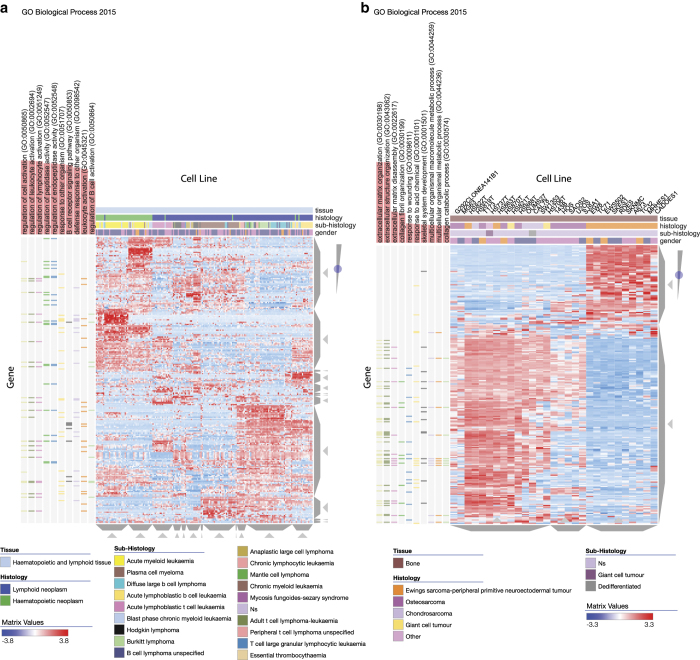
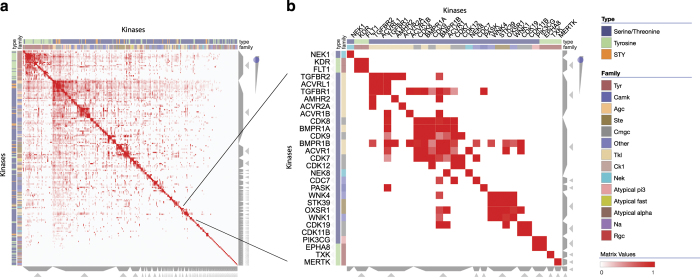
Most tools developed to visualize hierarchically clustered heatmaps generate static images. Clustergrammer is a web-based visualization tool with interactive features such as: zooming, panning, filtering, reordering, sharing, performing enrichment analysis, and providing dynamic gene annotations. Clustergrammer can be used to generate shareable interactive visualizations by uploading a data table to a web-site, or by embedding Clustergrammer in Jupyter Notebooks. The Clustergrammer core libraries can also be used as a toolkit by developers to generate visualizations within their own applications. Clustergrammer is demonstrated using gene expression data from the cancer cell line encyclopedia (CCLE), original post-translational modification data collected from lung cancer cells lines by a mass spectrometry approach, and original cytometry by time of flight (CyTOF) single-cell proteomics data from blood. Clustergrammer enables producing interactive web based visualizations for the analysis of diverse biological data.


Conflict of interest statement

The authors declare no competing financial interests.

Figures

Figure 1
Figure 1. Clustergrammer web app, Jupyter widget, and interactivity.
(a) Users can generate interactive and shareable heatmap visualizations using the Clustergrammer web application by uploading a matrix file at the homepage where they are redirected to a permanent and shareable visualization of the data. User data is clustered on the server side using default parameters. The visualization page includes three views of the data: a clustered heatmap, a similarity matrix heatmap of the columns, and a similarity matrix heatmap of the rows (not shown). (b) The Clustergrammer-widget can be used within a shareable Jupyter Notebook to produce interactive visualizations alongside code and markup text. (c) Clustergrammer implements many interactive features to enable intuitive data exploration including: zooming, panning, reordering, row filtering, interactive dendrograms, interactive categories, gene name/description lookup, and enrichment analysis.
Figure 2
Figure 2. Interactive Heatmap Tool Feature Comparison.
The heatmap compares interactive heatmap tools (shown as columns) based on their available features (shown as rows). The table was created using Clustergrammer where rows and columns are sorted by sum. Feature-categories are encoded using four colors. The interactive version can be found at https://maayanlab.github.io/interactive_heatmap_features/.
Figure 3
Figure 3. Lung cancer post-translational modification and gene expression regulation.
(a) Lung cancer cell lines (columns) were clustered based on a combination of PTMs and mRNA expression data (rows). (b) Zooming into a cluster containing Keratins with commonly up-regulated expression and post-translational modification in the NSCLC cluster. (c) Zooming into a cluster containing expression and methylation data for the lung associated transcription factor, NKX2-1.
Figure 4
Figure 4. Single blood cell CyTOF data in response to PMA treatment.
Single cell CyTOF data was obtained after exposing PBMCs to PMA and measuring 18 surface markers and 10 phospho-markers. (a) Clustergrammer was used to semi-automatically identify cell types based on surface marker expression. (b) Proportion of cell types based on semi-automatic identification from surface marker expression data. (c) Clustergrammer visualization of phospho-marker expression in single cells with cell type and treatment condition labels. (d) Zooming into the CD14hi monocyte cluster in phospho- and surface-marker space.
Figure 5
Figure 5. Cancer cell line encyclopedia (CCLE) gene expression data.
Clustergrammer was applied to visualize the CCLE gene expression data. The CCLE Explorer available at https://maayanlab.github.io/CCLE_Clustergrammer/ allows users to explore tissue expression using heatmaps that are pre-loaded with enrichment results from the Gene Ontology Biological Process from the Enrichr library. (a) Haematopoietic and Lymphoid tissue cell lines (columns) heatmap with Gene Ontology Biological Process enrichment. (b) Bone tissue cell lines (columns) heatmap with Gene Ontology Biological Process enrichment.
Figure 6
Figure 6. Network visualization.
(a) Clustergrammer was used to visualize a network of kinases based on shared substrates. The network includes 404 kinases and over 100,000 kinase-kinase associations. (b) Zoomed view of a cluster of kinases.

Similar articles

Cited by

References

Data Citations

    1. Hornbeck P., Rikova K., Fernandez N., Ma’ayan A. 2017. figshare. https://doi.org/10.6084/m9.figshare.5339689 - DOI - PMC - PubMed
    1. Rahman A., Fernandez N., Ma’ayan A. 2017. figshare. https://doi.org/10.6084/m9.figshare.5339698 - DOI
    1. 2012. Gene Expression Omnibus. GSE36133
    1. Rouillard A., Fernandez N., Ma’ayan A. 2017. figshare. https://doi.org/10.6084/m9.figshare.5339707 - DOI

References

    1. Clark N. R. & Ma’ayan A. Introduction to statistical methods to analyze large data sets: Principal components analysis. Science signaling 4, tr3 (2011). - PMC - PubMed
    1. Maaten L. V. D. & Hinton G. Visualizing data using t-SNE. Journal of Machine Learning Research 9, 2579–2605 (2008).
    1. Eisen M. B., Spellman P. T., Brown P. O. & Botstein D. Cluster analysis and display of genome-wide expression patterns. Proceedings of the National Academy of Sciences 95, 14863–14868 (1998). - PMC - PubMed
    1. Pavlopoulos G. A., Wegener A.-L. & Schneider R. A survey of visualization tools for biological network analysis. Biodata mining 1, 12 (2008). - PMC - PubMed
    1. Henson R. & Cetto L. The MATLAB bioinformatics toolbox. Encyclopedia of Genetics, Genomics, Proteomics and Bioinformatics 4, 105 (2005).

Publication types