. 2017 Oct 9;9(10):2026-2051.
doi: 10.18632/aging.101298.

Age-related gene expression in luminal epithelial cells is driven by a microenvironment made from myoepithelial cells

Affiliations

Age-related gene expression in luminal epithelial cells is driven by a microenvironment made from myoepithelial cells

Masaru Miyano et al. Aging (Albany NY). .

Abstract

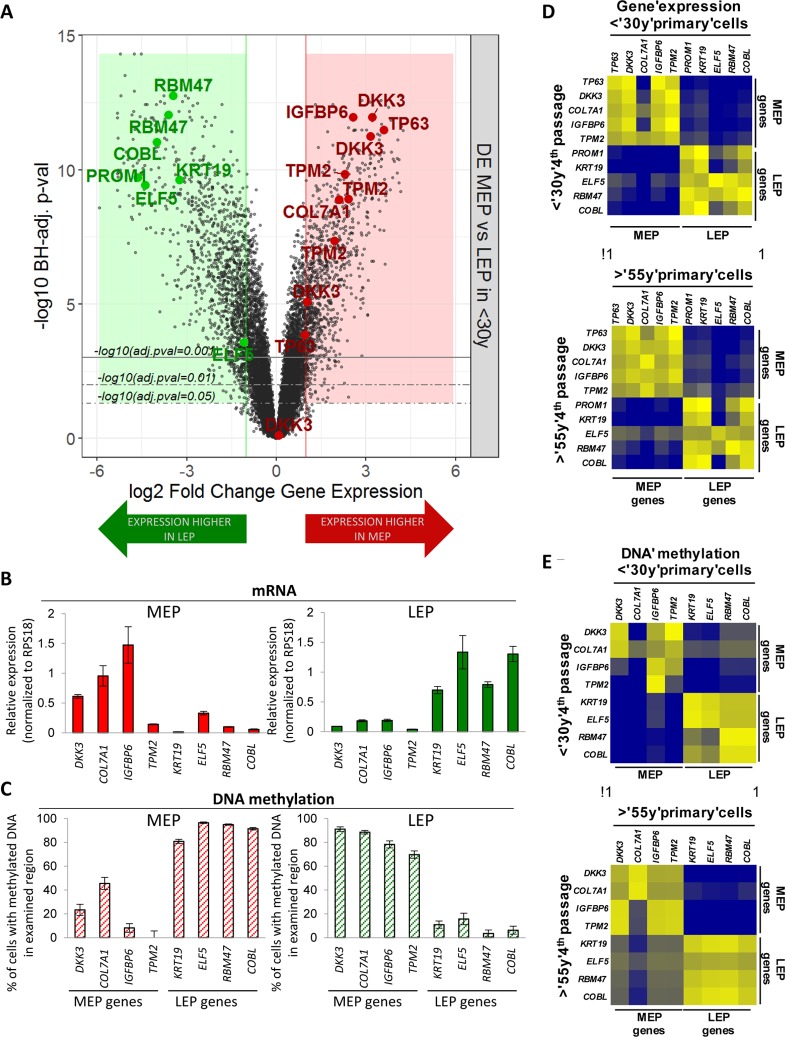
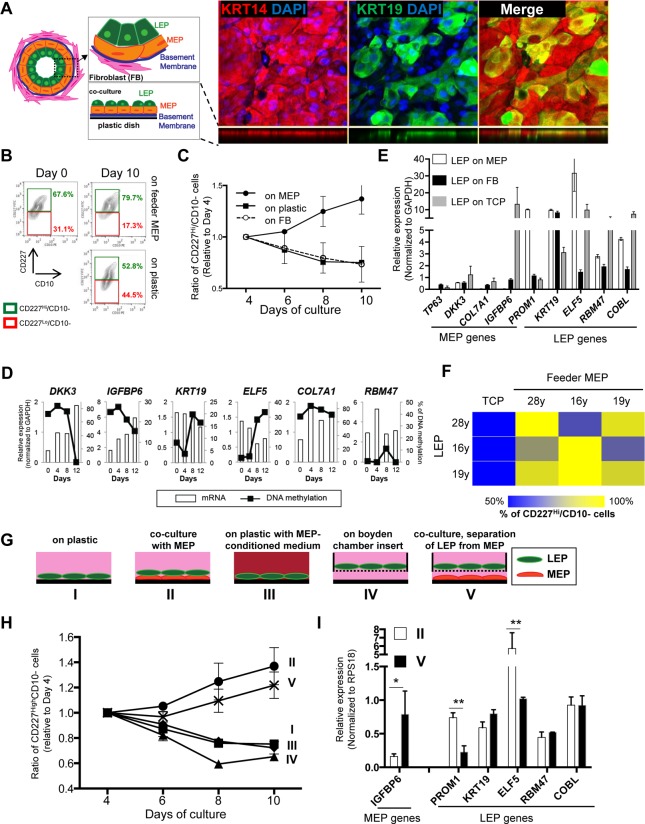
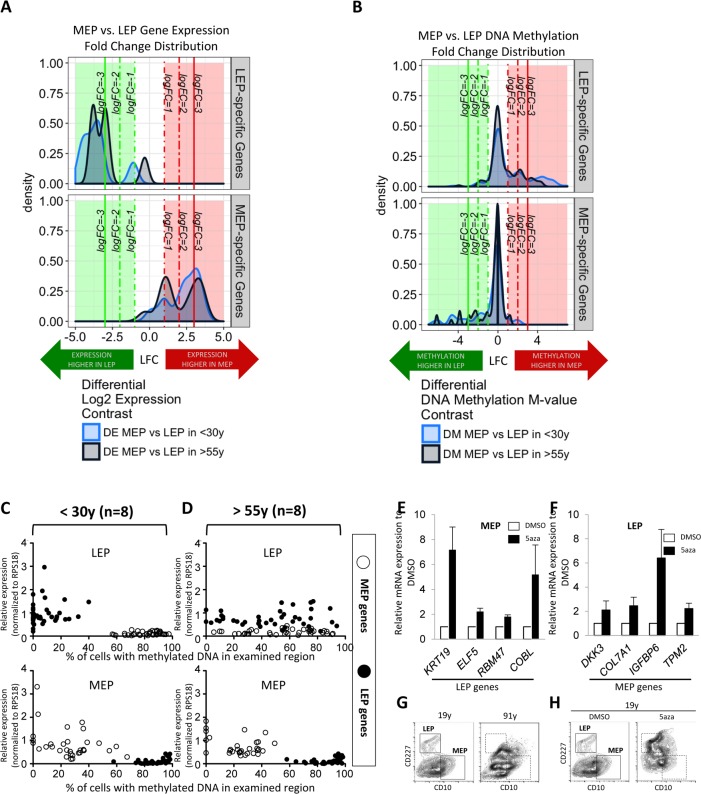
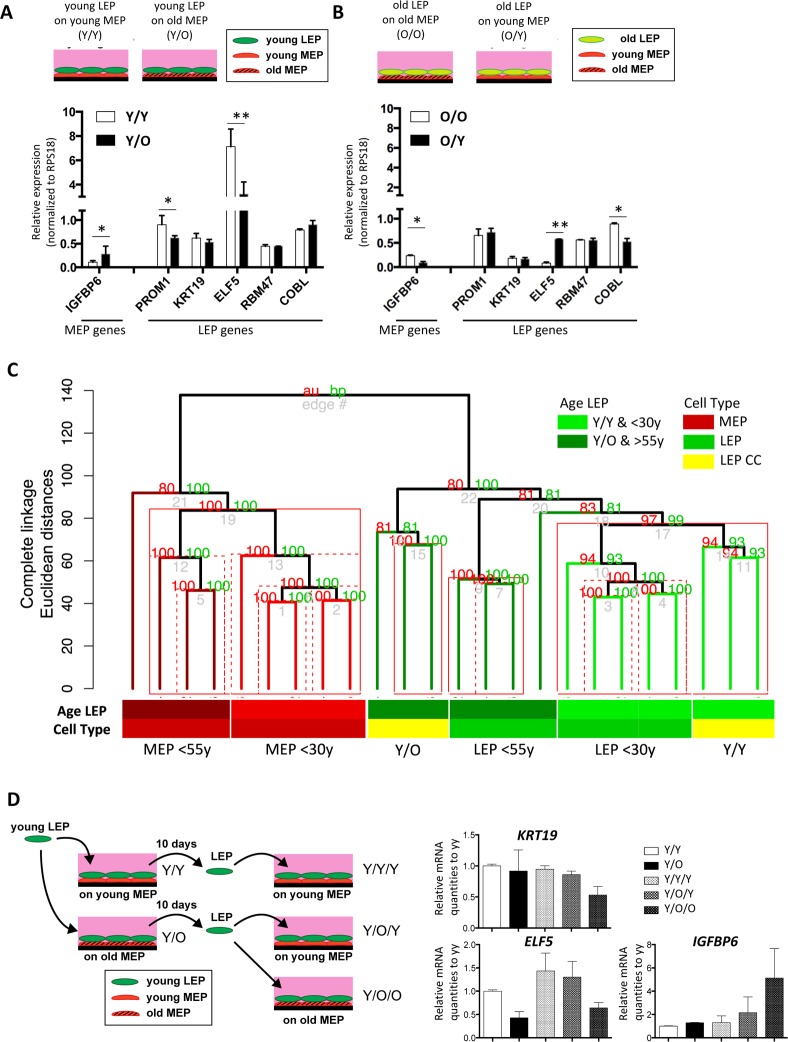
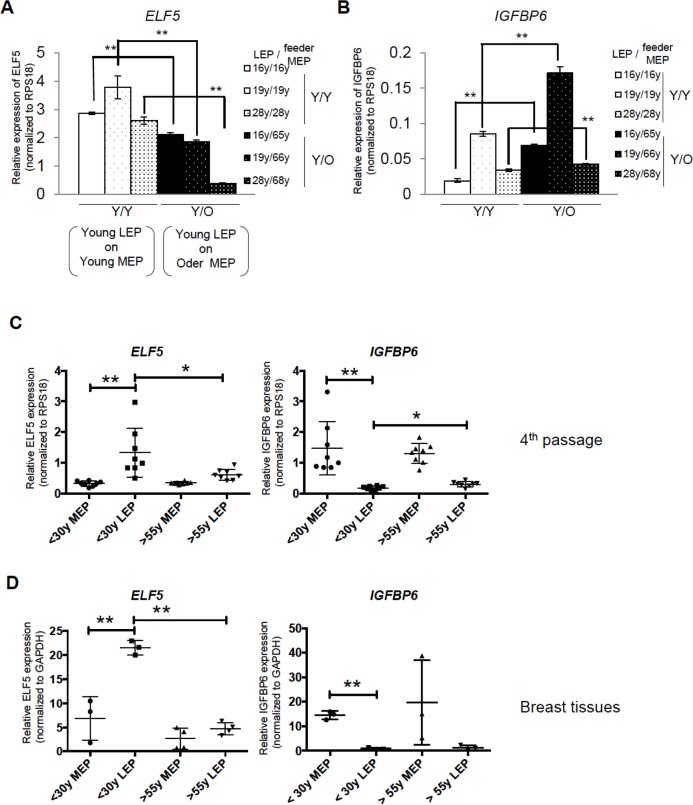
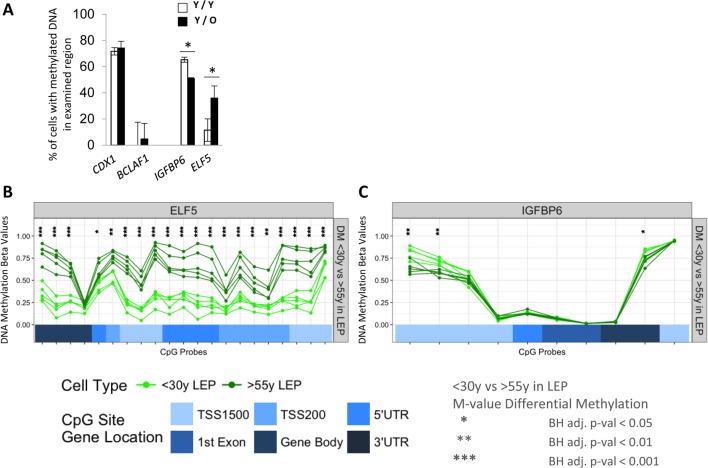
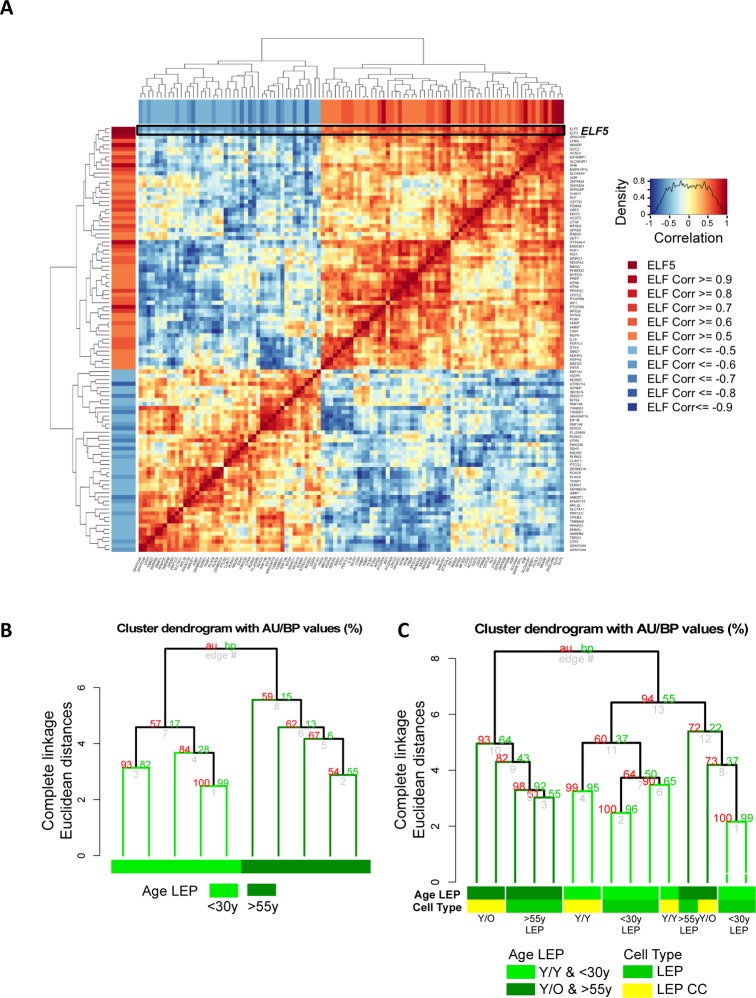
Luminal epithelial cells in the breast gradually alter gene and protein expression with age, appearing to lose lineage-specificity by acquiring myoepithelial-like characteristics. We hypothesize that the luminal lineage is particularly sensitive to microenvironment changes, and age-related microenvironment changes cause altered luminal cell phenotypes. To evaluate the effects of different microenvironments on the fidelity of epigenetically regulated luminal and myoepithelial gene expression, we generated a set of lineage-specific probes for genes that are controlled through DNA methylation. Culturing primary luminal cells under conditions that favor myoepithelial propogation led to their reprogramming at the level of gene methylation, and to a more myoepithelial-like expression profile. Primary luminal cells' lineage-specific gene expression could be maintained when they were cultured as bilayers with primary myoepithelial cells. Isogenic stromal fibroblast co-cultures were unable to maintain the luminal phenotype. Mixed-age luminal-myoepithelial bilayers revealed that luminal cells adopt transcription and methylation patterns consistent with the chronological age of the myoepithelial cells. We provide evidence that the luminal epithelial phenotype is exquisitely sensitive to microenvironment conditions, and that states of aging are cell non-autonomously communicated through microenvironment cues over at least one cell diameter.

Keywords: aging; breast cancer; epigenetic; mammary epithelia; microenvironment.


Conflict of interest statement

CONFLICTS OF INTEREST

The authors have no conflicts of interest to declare.

Figures

Figure 1
Figure 1. Lineage-specific gene expression and promoter methylation is consistent between HMEC in vivo and pre-stasis cultures
(A) Volcano plot based on differential expression (DE) analysis of 24,965 Illumina gene probes (19,499 mapped genes) in 4p MEP and LEP from <30y subjects by beadchip expression array. Y-axis indicates –log10 Benjamini-Hochberg (BH)-adjusted p-values from significance analysis and x-axis shows log2 fold change (LFC) in gene expression. Colored regions and lines highlight fraction of genes which show lineage-specific differential expression (absolute log2 fold change ≥ 1 and BH adj. p-val < 0.05, < 0.01, < 0.001) with negative LFC values (green area) indicating higher expression in LEP and positive LFC values (red area) higher expression in MEP. LEP-specific (green circle) and MEP-specific (red circle) genes used as lineage-specific probesets are annotated (19 Illumina gene probes). Validation of lineage specific (B) gene expression in and (C) corresponding promoter DNA methylation in FACS enriched MEP and LEP, using qPCR-based lineage gene probe sets. Lineage specific expression was inversely correlated with DNA methylation status in the promoter. Differential expression and methylation in each gene were significant (p < 0.01). Expression data was normalized to expression of RPS18. Data were shown by mean ± SEM. Correlation of (D) Lineage-specific gene expression and (E) promoter DNA methylation status in MEP and LEP between 4p HMEC strains and uncultured cell dissociated from organoids. Pearson's correlation value of gene expression and DNA methylation between organoids and 4p HMEC were 0.9670 and 0.9333, respectively.
Figure 2
Figure 2. Apical surfaces of myoepithelial cells provide a robust microenvironment for maintenance of the luminal lineage
(A) Schematic model of human mammary glands, co-culture and immunofluorescent staining in co-culture. Six days co-culture of LEP with MEP from 19y old were stained with antibodies against KRT14 (red) and KRT19 (green). Nuclei were stained with DAPI (blue). Orthogonal views were shown below each image. (B) Contour plots of CD10 and CD227 expression, as measured by FACS, comparing luminal cell populations on tissue culture plastic or co-cultured on a layer of MEP. LEP populations were maintained better after 10 days in co-culture (78.7%) compared to TCP (52.8%). (C) Line graphs showing the relative proportion of CD227+ LEP over time in co-culture with isogenic MEP or isogenic fibroblast (FB) feeders, or on plastic. (n=3) (D) Gene expression in LEP (white bars) and promoter methylation (black line) over 12 days of culture on TCP. LEP genes tend to be reduced with increasing methylation, whereas MEP gene expression is increased with reduced methylation. (E) Bar graphs showing differences in LEP- and MEP-specific gene expression in LEP cultured on FB feeders (black), TCP (gray) or on MEP feeders (white). Mean ±SD, normalized to expression of GAPDH (n=3). LEP gene expression is not maintained on FB feeders nor on plastic. (F) Heatmap showing the proportion of LEP, measured with FACS, remaining after 10 days co-culture with different combinations of MEP feeders from women <30y. (G) Schematic outlines that represent conditions I-V. (H) Line graphs showing proportion of LEP that is maintained over 10 days cultured in conditions (I-V). (n=3) (I) Bar graphs showing expression of lineage specific genes in LEP cultured 10 days in conditions II and V. Condition II was the only one to maintain a complete LEP phenotype over time. Mean ±SD, normalized to expression of RPS18 (n=3). * and ** showed statistical significances at p<0.05 and p<0.01, respectively.
Figure 3
Figure 3. Age-dependent gene expression in luminal cells is associated with specific DNA methylation patterns
LEP- and MEP-specific probe sets were used to identify age-dependent changes in lineage-specific gene expression and DNA methylation patterns in FACS enriched 4p LEP and MEP. Corresponding expression of probeset genes in LEP and MEP cells from 9 different 4p HMEC strains representing <30y and >55y age groups in Illumina HumanHT-12 v4 BeadChips (Set1) were assayed for lineage-specific differential expression (DE) between MEP and LEP across 19 Illumina gene probes (A). Infinium 450K methylation arrays were then used to evaluate lineage-specific differential methylation (DM) based on methylation M-values of probeset genes across 247 CpG sites for the same subjects (B). Kernel Density Estimates (KDE) of distributions of log2 fold changes (LFC) in expression (A) or DNA methylation (B) between MEP vs. LEP in <30y (light blue) and >55y (dark blue) subjects for LEP-specific (top panel) and MEP-specific genes (bottom panel) are shown. Colored regions and lines highlight fraction of genes or CpG sites which show lineage-specific differential expression or methylation respectively (≥ 1-, ≥ 2-, ≥ 3- absolute LFC and Benjamini-Hochberg, BH, adj. p-val < 0.05, < 0.01, < 0.001), with negative LFC values (green area) indicating higher expression/methylation in LEP and positive LFC values (red area) higher expression/methylation in MEP. (C and D) Dysregulation of lineage specific gene expression with age in LEP was associated with age-dependent DNA methylation patterns. The relationship between expression and methylation of lineage-specific genes in FACS enriched LEP and MEP from women (C) <30y or (D) >55y, is visualized using dot plots. LEP probes are shown as filled circles, MEP probes are shown as open circles. A change in the lineage-specific relationship was most prominent in older LEP. Eight strains were used for each age group, expression data were normalized to expression of RPS18. Bar graphs showing expression of (E) LEP genes in MEP treated with 5′aza, and (F) MEP genes in LEP treated with 5′aza, showing that these lineage specific genes were regulated in part by DNA methylation. (G) Contour plots representing CD10 and CD227 expression measured by FACS on HMEC from a 19y and a 91y woman, which are representative of the phenotypes typically observed in these extreme age groups. Corresponding areas were shown with dotted line boxes. (H) CD10 and CD227 expression in HMEC from a 19y woman treated with DMSO or DMSO+5′aza at 15 μM for 48h. Young HMEC phenocopied older HMEC following 5aza treatment. Gates used to delineate lineages are indicated with boxes.
Figure 4
Figure 4. Chronological age of the apical microenvironment determines age-dependent gene expression patterns in luminal cells
(A) Schematic shows co-culture conditions VI and VII, with young LEP atop of young or old MEP, respectively. Bar graph shows differences in LEP-specific gene expression, and IGFBP6 a MEP-specific gene, in young LEP after 10 days culture on young (white) or old (black) MEP feeders. Mean ±SD, normalized to expression of RPS18. (B) Schematic shows co-culture conditions, with old LEP atop of old or young MEP, respectively. Bar graph shows differences in LEP-specific gene expression, and in IGFBP6 a MEP-specific gene, in old LEP after 10 days culture on young (white) or old (black) MEP feeders. Mean ±SD, normalized to expression of RPS18 (n=3). * and ** showed statistical significances at p<0.05 and p<0.01, respectively. (C) Unsupervised hierarchical clustering of <30y LEP in Y/Y (n=3) and Y/O (n=3) co-cultures in parallel with <30y (n=5) and >55y (n=4) 4p LEP and MEP isogenic to the MEP strains used in co-culture (Illumina HumanHT-12 v4 BeadChips Set2). Clustering was performed on transcriptome-wide log2 gene expression levels (n=26,599 gene probes, m=20,577 mapped genes) using Euclidean distance measures and complete linkage. Percent Approximately Unbiased (AU) p-values in red, and percent Bootstrap Probability (BP) in green are calculated and annotated above each cluster (pvclust R package). Clusters with AU > 95% are highlighted by red rectangles, solid red rectangles denotes largest cluster supported by data. (D) Schematic of experimental outline for extended co-cultures. LEP were separated by FACS after 10 days co-culture either with young MEP (Y/Y) or old MEP (Y/O). LEP from Y/Y and Y/O were further co-cultured with young MEP (Y/Y/Y and Y/O/Y) or older MEP (Y/O/O). (E) Bar graphs showing gene expression levels of KRT19, ELF5 and IGFBP6 in LEP following the 7-day culture experiments. Expression was normalized to expression of RPS18 and shown by relative expression to those of Y/Y.
Figure 5
Figure 5. In vivo and primary cell age-dependent ELF5 and IGFBP6 expression were recapitulated in mixed age co-culture
Mixed combinations of MEP and LEP from different aged donors demonstrates that age is the important determinant of ELF5 and IGFBP6 expression. Bar graphs showing (A) ELF5 and (B) IGFBP6 gene expression after 10 days in co- culture with different combinations of young LEP on young or old feeder MEPs. Gene expression was normalized to RPS18. (C and D) Age-dependent expression levels of the two genes in co-culture recapitulate 4p and primary HMEC. Lineage-and age-dependent ELF5 or IGFBP6 gene expression was shown by dot plots in (C) 4p HMEC and in (D) breast tissues. * and ** showed statistical significances at p<0.05 and p<0.01, respectively.
Figure 6
Figure 6. Age of the apical microenvironment is a determinant of ELF5 and IGFBP6 promoter DNA methylation states
(A) Bar graphs showing the percent of IGFBP6 and ELF5 methylated promoter DNA in LEP after 10 days of culture on young (white) or old (black) MEP feeders. CDX1 and BCLAF1 are hyper- and hypomethylated gene controls. Data are presented as mean ±SD (n=3). * indicates statistical significances at p<0.05. DNA methylation analyses of (B) ELF5 and (C) in IGFBP6 using Infinium 450K methylation arrays. Analysis assessed percentage methylation (beta-values) and age-specific differential methylation (DM) across CpG sites in these genes for <30y LEP (green) and >55y LEP (dark green). DNA methylation beta-values across CpG sites are plotted in order of their chromosomal mapping, and range from 0-1 denoting hypo- (β-val < 0.25), hemi- (0.25 < β-val < 0.75) and hyper-methylated (β-val > 0.75) methylation levels. Corresponding annotated locations of CpG sites respective to gene regions: TSS1500, TSS200, 5′UTR, 1st Exon, Gene Body and 3′UTR (shades of blue) are shown in tracks below. Significance of age-specific differential methylation based on corresponding M-values between <30y and >55y LEP are denoted by asterisks: Benjamini-Hochberg, BH-, adj. p-val (*) < 0.05, (**) < 0.01, (***) < 0.001.
Figure 7
Figure 7. Microenvironment-imposed reduction of ELF5 causes an entire network of genes to change
Age‐related changes in ELF5 are associated with age‐specific changes in ELF5‐target genes in the LEP lineage. (A) Gene‐gene correlation matrix of ELF5 (2 gene probes) and 92 ELF5‐target genes (103 gene probes) found to have absolute correlation ≥ 0.5 with ELF5 in LEP from <30y and >55y age groups across 9 HMEC strains. Annotated in both the row and column bars of the correlation matrix is each ELF5‐target gene probe's correlation value to the ELF5 probes. (B) Hierarchical clustering based on log2 expression levels of ELF5 and the anti‐/correlated ELF5‐target genes in <30y and >55y 4p pre-stasis LEP, (C) and in Y/Y (n=3) and Y/O (n=3) co‐cultures with <30y (n=5) and >55y (n=4) 4p LEP isogenic to the MEP strains used in co‐culture, using Euclidean distance measures and complete linkage. Percent Approximately Unbiased (AU) p-values denoted in red, and percent Bootstrap Probability (BP) in green are calculated and annotated above each cluster.

References

    1. Gudjonsson T, Adriance MC, Sternlicht MD, Petersen OW, Bissell MJ. Myoepithelial cells: their origin and function in breast morphogenesis and neoplasia. J Mammary Gland Biol Neoplasia. 2005;10:261–72. https://doi.org/10.1007/s10911-005-9586-4 - DOI - PMC - PubMed
    1. Howeedy AA, Virtanen I, Laitinen L, Gould NS, Koukoulis GK, Gould VE. Differential distribution of tenascin in the normal, hyperplastic, and neoplastic breast. Lab Invest. 1990;63:798–806. - PubMed
    1. Benz CC. Impact of aging on the biology of breast cancer. Crit Rev Oncol Hematol. 2008;66:65–74. https://doi.org/10.1016/j.critrevonc.2007.09.001 - DOI - PMC - PubMed
    1. Quong J, Eppenberger-Castori S, Moore D, 3rd, Scott GK, Birrer MJ, Kueng W, Eppenberger U, Benz CC. Age-dependent changes in breast cancer hormone receptors and oxidant stress markers. Breast Cancer Res Treat. 2002;76:221–36. https://doi.org/10.1023/A:1020886801674 - DOI - PubMed
    1. Pelissier FA, Garbe JC, Ananthanarayanan B, Miyano M, Lin C, Jokela T, Kumar S, Stampfer MR, Lorens JB, LaBarge MA. Age-related dysfunction in mechanotransduction impairs differentiation of human mammary epithelial progenitors. Cell Reports. 2014;7:1926–39. https://doi.org/10.1016/j.celrep.2014.05.021 - DOI - PMC - PubMed

Publication types