

Low-energy defibrillation with nanosecond electric shocks
- PMID: 29016714
- PMCID: PMC5852636
- DOI: 10.1093/cvr/cvx172
Low-energy defibrillation with nanosecond electric shocks
Abstract
Aims: Reliable defibrillation with reduced energy deposition has long been the focus of defibrillation research. We studied the efficacy of single shocks of 300 ns duration in defibrillating rabbit hearts as well as the tissue damage they may cause.
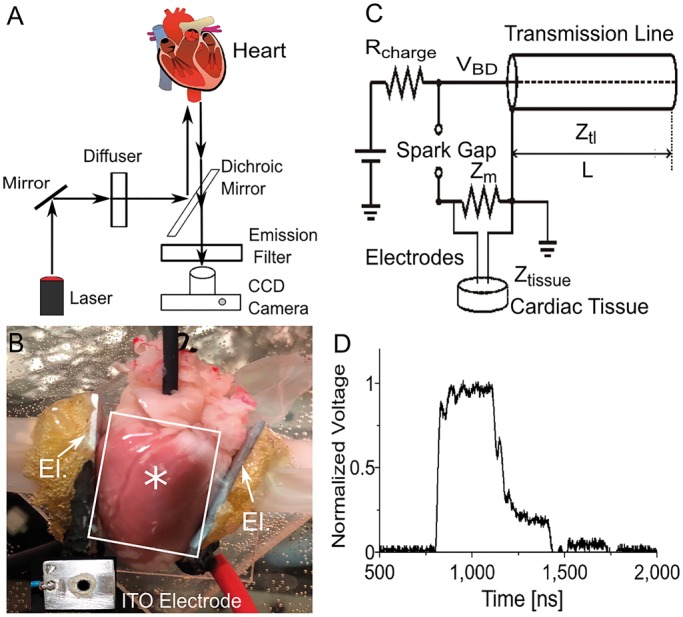
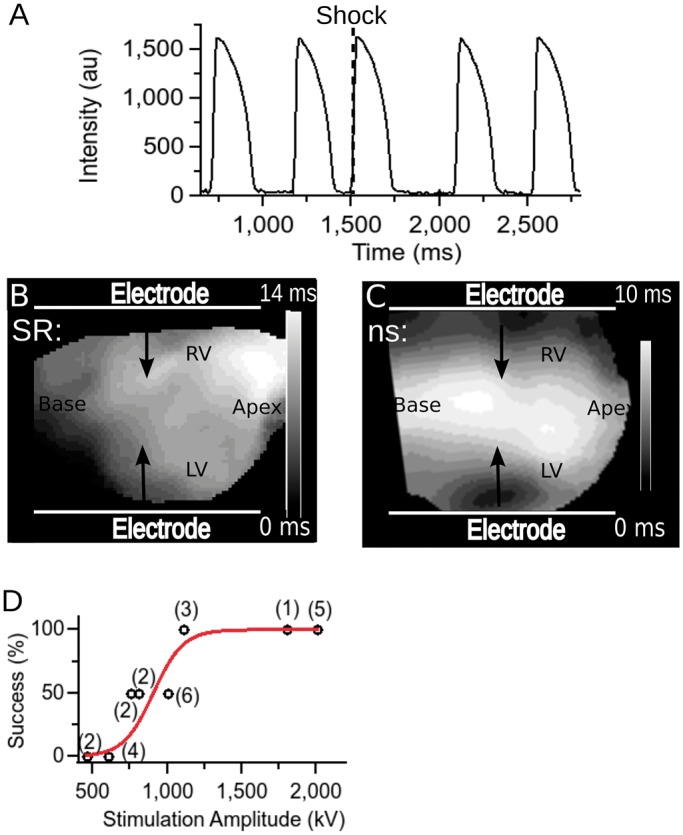
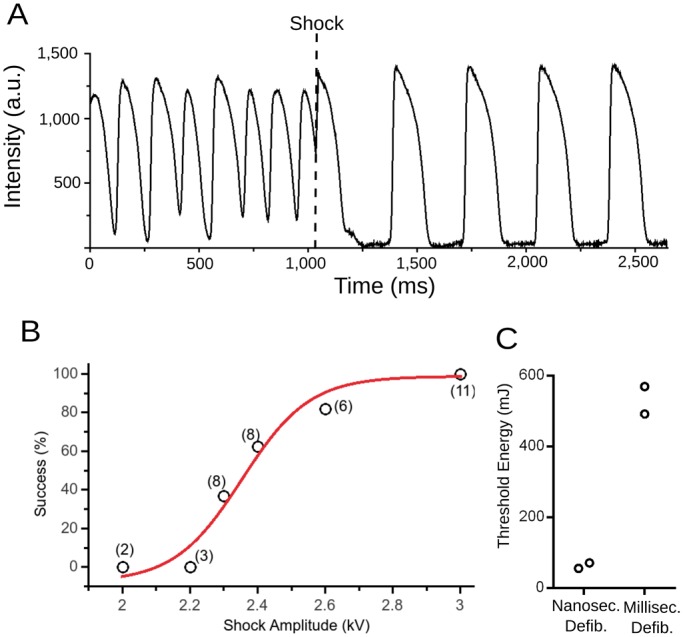
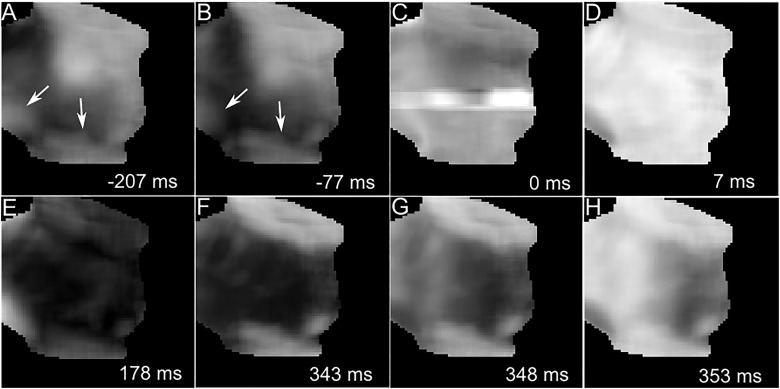
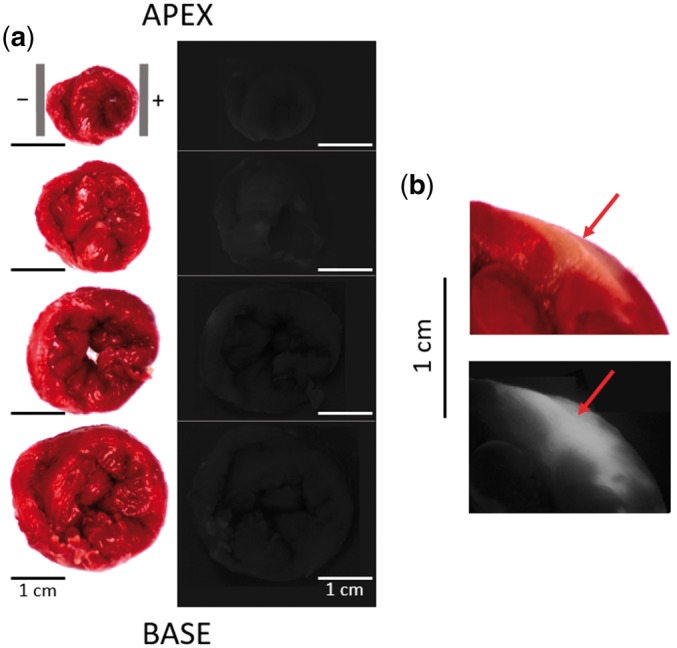
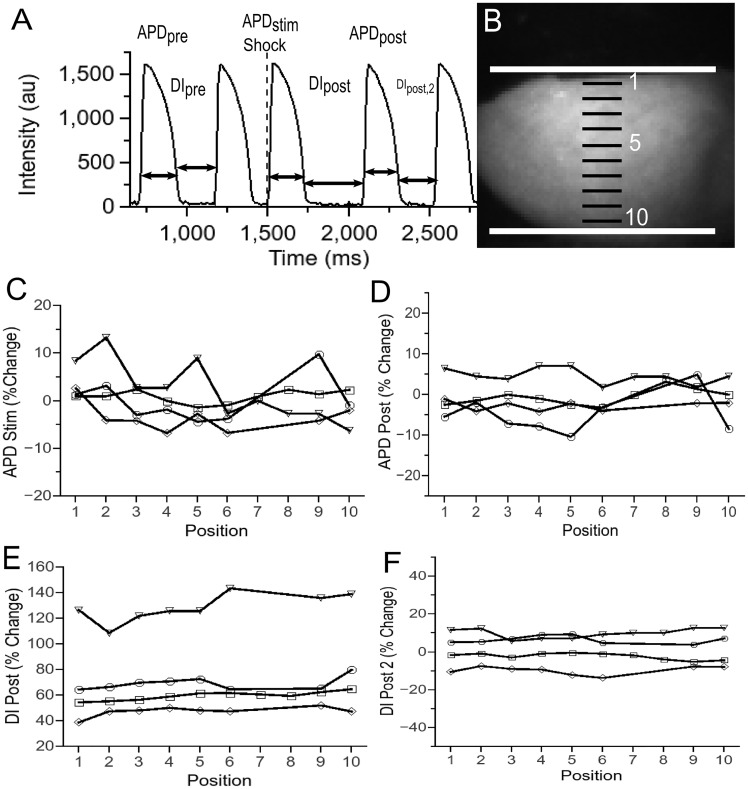
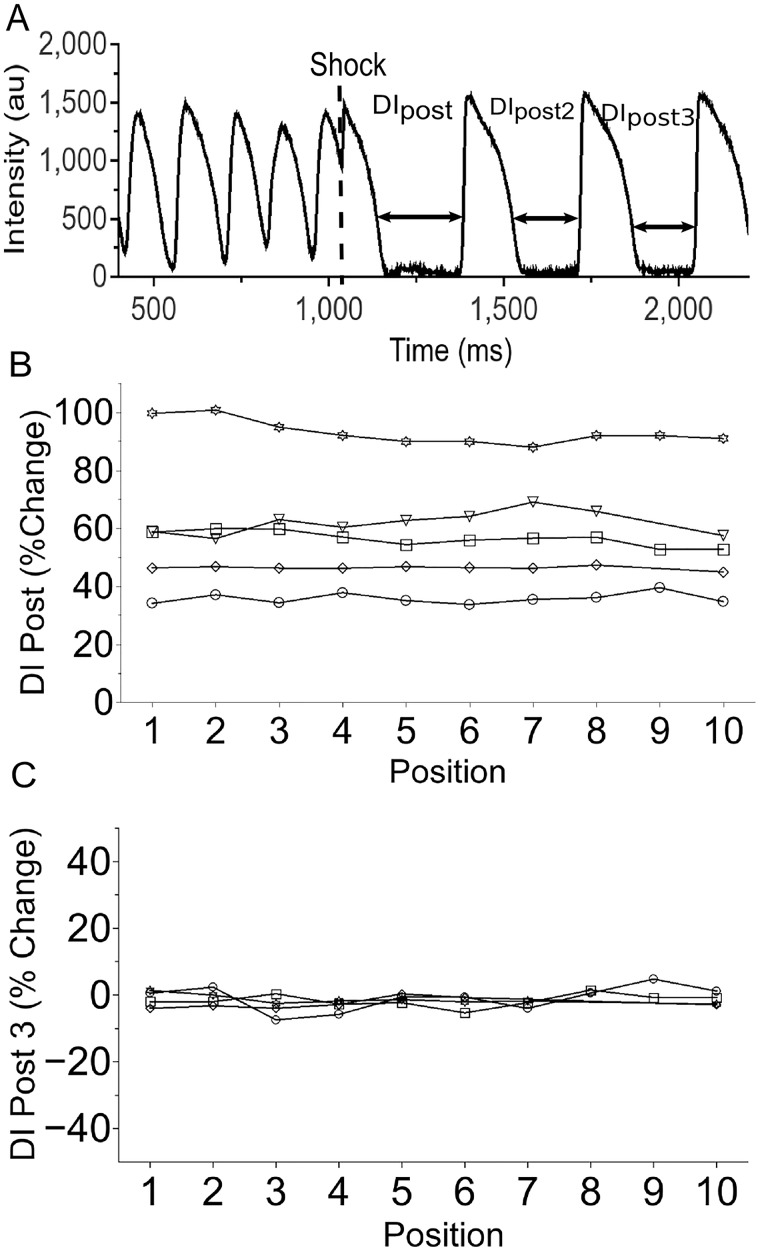
Methods and results: New Zealand white rabbit hearts were Langendorff-perfused and two planar electrodes were placed on either side of the heart. Shocks of 300 ns duration and 0.3-3 kV amplitude were generated with a transmission line generator. Single nanosecond shocks consistently induced waves of electrical activation, with a stimulation threshold of 0.9 kV (over 3 cm) and consistent activation for shock amplitudes of 1.2 kV or higher (9/9 successful attempts). We induced fibrillation (35 episodes in 12 hearts) and found that single shock nanosecond-defibrillation could consistently be achieved, with a defibrillation threshold of 2.3-2.4 kV (over 3 cm), and consistent success at 3 kV (11/11 successful attempts). Shocks uniformly depolarized the tissue, and the threshold energy needed for nanosecond defibrillation was almost an order of magnitude lower than the energy needed for defibrillation with a monophasic 10 ms shock delivered with the same electrode configuration. For the parameters studied here, nanosecond defibrillation caused no baseline shift of the transmembrane potential (that could be indicative of electroporative damage), no changes in action potential duration, and only a brief change of diastolic interval, for one beat after the shock was delivered. Histological staining with tetrazolium chloride and propidium iodide showed that effective defibrillation was not associated with tissue death or with detectable electroporation anywhere in the heart (six hearts).
Conclusion: Nanosecond-defibrillation is a promising technology that may allow clinical defibrillation with profoundly reduced energies.
Keywords: Defibrillation; Low-energy; Millisecond shocks; Nanosecond shocks; Stimulation.
Published on behalf of the European Society of Cardiology. All rights reserved. © The Author 2017. For permissions please email: journals.permissions@oup.com.
Figures
Similar articles
-
Electroporation safety factor of 300 nanosecond and 10 millisecond defibrillation in Langendorff-perfused rabbit hearts.PLoS One. 2021 Sep 24;16(9):e0257287. doi: 10.1371/journal.pone.0257287. eCollection 2021. PLoS One. 2021. PMID: 34559811 Free PMC article.
-
Effect of sotalol and acute ventricular dilatation on action potential duration and dispersion of repolarization after defibrillation shocks.J Cardiovasc Pharmacol. 2003 Apr;41(4):640-8. doi: 10.1097/00005344-200304000-00018. J Cardiovasc Pharmacol. 2003. PMID: 12658067
-
Effects of defibrillation shock energy and timing on 3-D computer model of heart.Ann Biomed Eng. 1993;21(1):19-31. doi: 10.1007/BF02368161. Ann Biomed Eng. 1993. PMID: 8434817
-
Can shocks timed to action potentials in low-gradient regions improve both internal and out-of-hospital defibrillation?J Electrocardiol. 1998;31 Suppl:41-4. doi: 10.1016/s0022-0736(98)90282-5. J Electrocardiol. 1998. PMID: 9988004 Review.
-
Using Nanosecond Shocks for Cardiac Defibrillation.Bioelectricity. 2019 Dec 1;1(4):240-246. doi: 10.1089/bioe.2019.0030. Epub 2019 Dec 12. Bioelectricity. 2019. PMID: 32685917 Free PMC article. Review.
Cited by
-
Protein-Mediated Electroporation in a Cardiac Voltage-Sensing Domain Due to an nsPEF Stimulus.Int J Mol Sci. 2023 Jul 13;24(14):11397. doi: 10.3390/ijms241411397. Int J Mol Sci. 2023. PMID: 37511161 Free PMC article.
-
Surgical Ablation of Cardiac Tissue with Nanosecond Pulsed Electric Fields in Swine.Cardiovasc Eng Technol. 2023 Feb;14(1):52-59. doi: 10.1007/s13239-022-00634-2. Epub 2022 Jun 15. Cardiovasc Eng Technol. 2023. PMID: 35705890
-
The interplay of excitation and electroporation in nanosecond pulse stimulation.Bioelectrochemistry. 2020 Dec;136:107598. doi: 10.1016/j.bioelechem.2020.107598. Epub 2020 Jul 15. Bioelectrochemistry. 2020. PMID: 32711366 Free PMC article. Review.
-
Atrial fibrillation and flutter conversion with pulsed electric field delivery: preclinical proof of concept.J Interv Card Electrophysiol. 2025 Aug 14. doi: 10.1007/s10840-025-02115-7. Online ahead of print. J Interv Card Electrophysiol. 2025. PMID: 40810875
-
Excitation and electroporation by MHz bursts of nanosecond stimuli.Biochem Biophys Res Commun. 2019 Oct 22;518(4):759-764. doi: 10.1016/j.bbrc.2019.08.133. Epub 2019 Aug 28. Biochem Biophys Res Commun. 2019. PMID: 31472962 Free PMC article.
References
-
- Bradfield JS, Buch E, Shivkumar K.. Interventions to decrease the morbidity and mortality associated with implantable cardioverter-defibrillator shocks. Curr Opin Crit Care 2012;18:432–437. - PubMed
-
- Cook SC, Marie Valente A, Maul TM, Amanda Dew M, Hickey J, Jennifer Burger P, Harmon A, Clair M, Webster G, Cecchin F, Khairy P.. Shock-related anxiety and sexual function in adults with congenital heart disease and implantable cardioverter-defibrillators. Heart Rhythm 2013;10:805–810. - PubMed
-
- Al-Khadra A, Nikolski V, Efimov IR.. The role of electroporation in defibrillation. Circ Res 2000;87:797–804. - PubMed
-
- Clark CB, Zhang Y, Davies LR, Karlsson G, Kerber RE.. Transthoracic biphasic waveform defibrillation at very high and very low energies: a comparison with monophasic waveforms in an animal model of ventricular fibrillation. Resuscitation 2002;54:183–186. - PubMed
-
- Kudenchuk PJ, Cobb LA, Copass MK, Olsufka M, Maynard C, Nichol G.. Transthoracic incremental monophasic versus biphasic defibrillation by emergency responders (TIMBER): a randomized comparison of monophasic with biphasic waveform ascending energy defibrillation for the resuscitation of out-of-hospital cardiac arrest due to ventricular fibrillation. Circulation 2006;114:2010–2018. - PubMed
MeSH terms
Grants and funding
LinkOut - more resources
Full Text Sources
Other Literature Sources
Miscellaneous
