. 2017 Dec 1;113(14):1753-1762.
doi: 10.1093/cvr/cvx115.

Matrix metalloproteinase-2 knockout prevents angiotensin II-induced vascular injury

Affiliations

Matrix metalloproteinase-2 knockout prevents angiotensin II-induced vascular injury

Tlili Barhoumi et al. Cardiovasc Res. .

Abstract

Aims: Matrix metalloproteinases (MMPs) have been implicated in the development of hypertension in animal models and humans. Mmp2 deletion did not change Ang II-induced blood pressure (BP) rise. However, whether Mmp2 knockout affects angiotensin (Ang) II-induced vascular injury has not been tested. We sought to determine whether Mmp2 knockout will prevent Ang II-induced vascular injury.

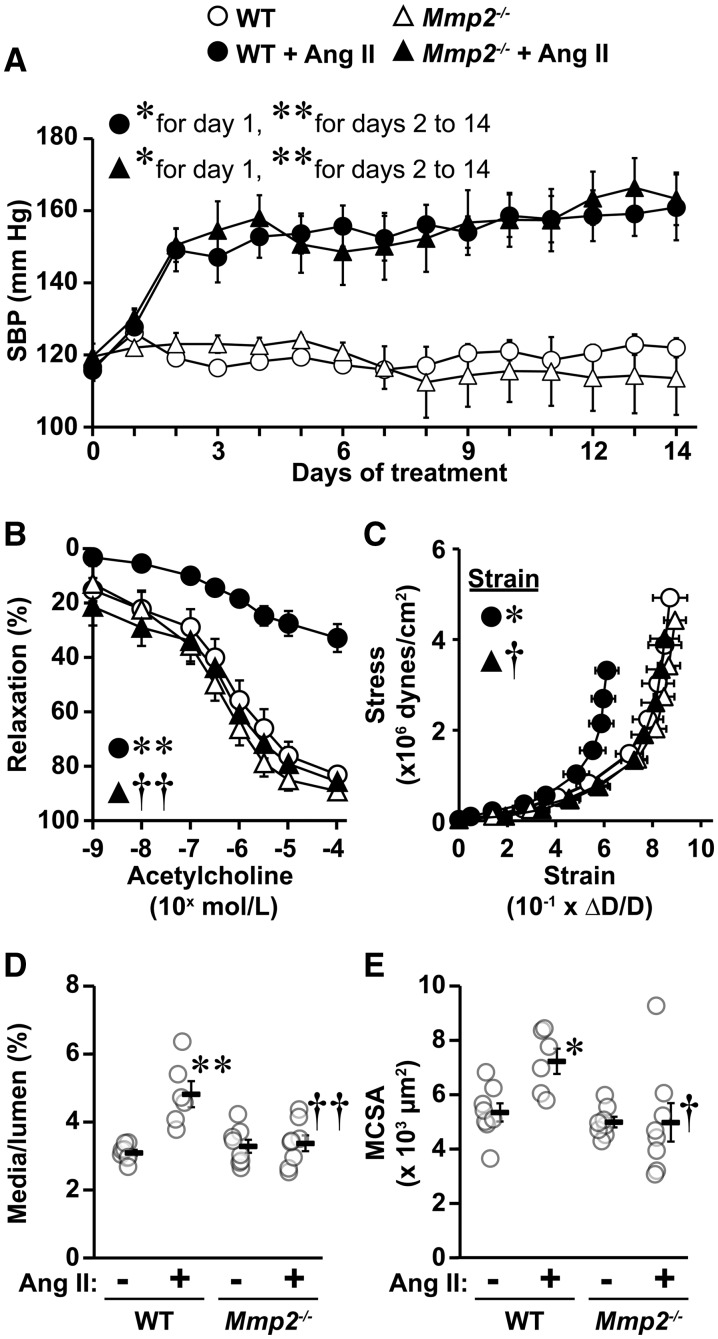
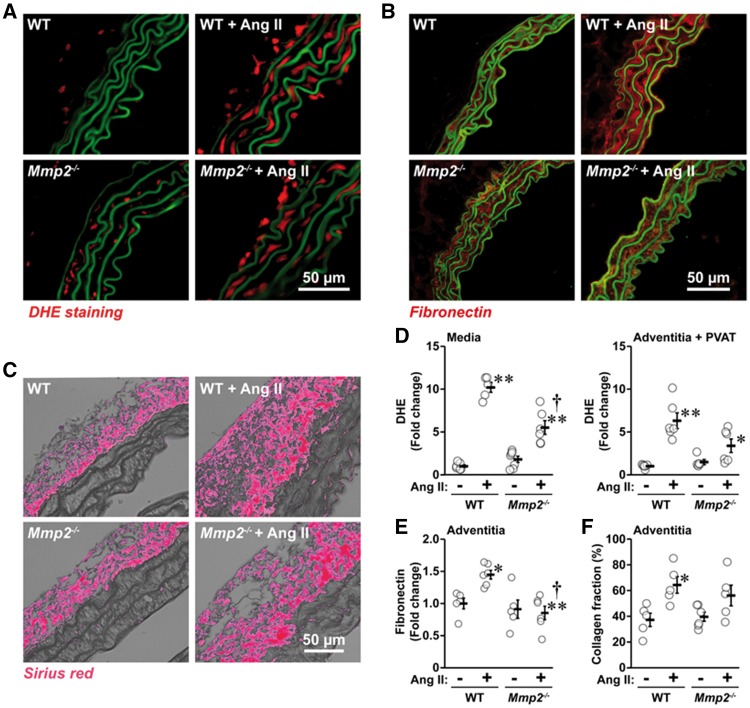
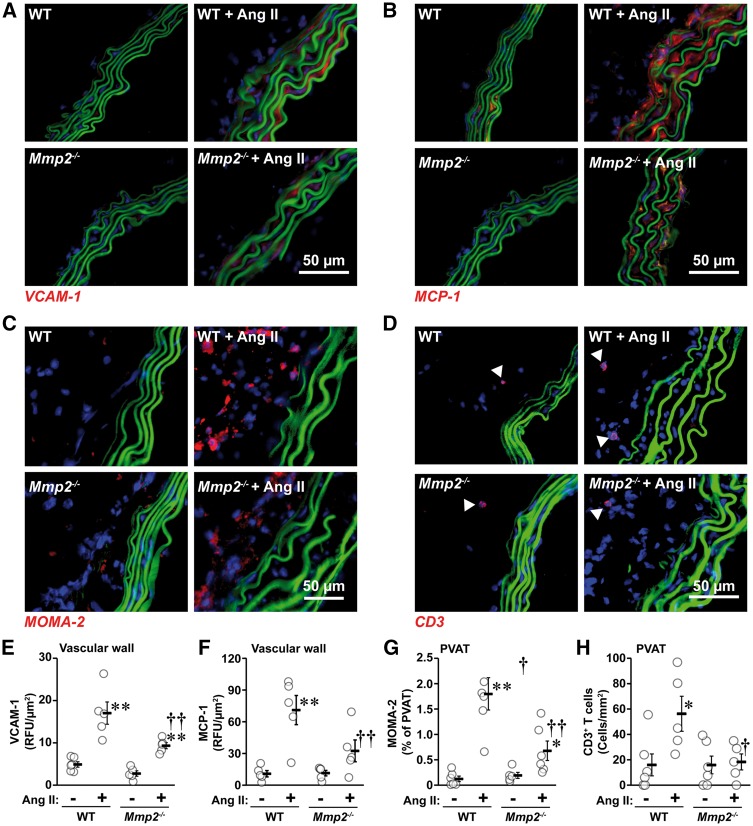
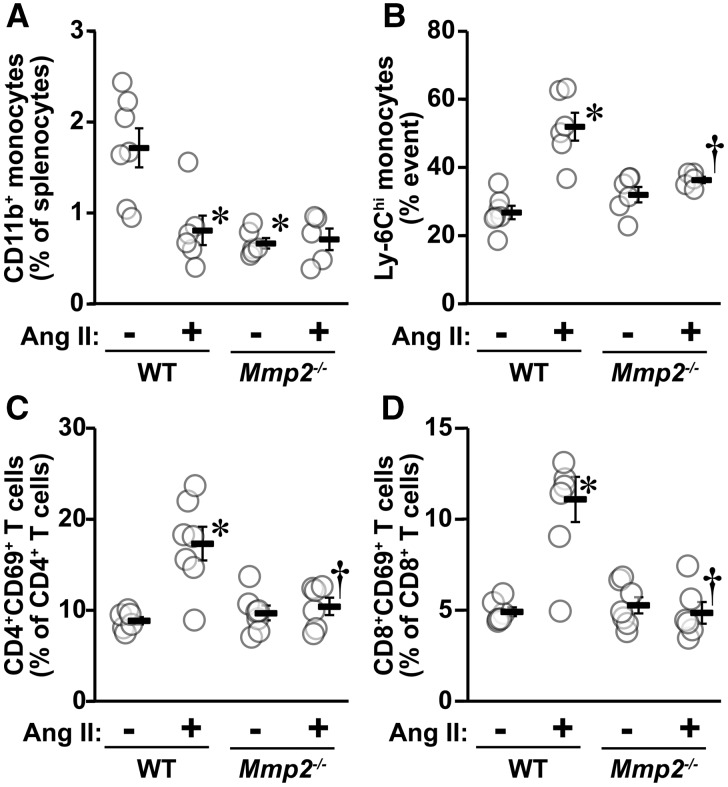
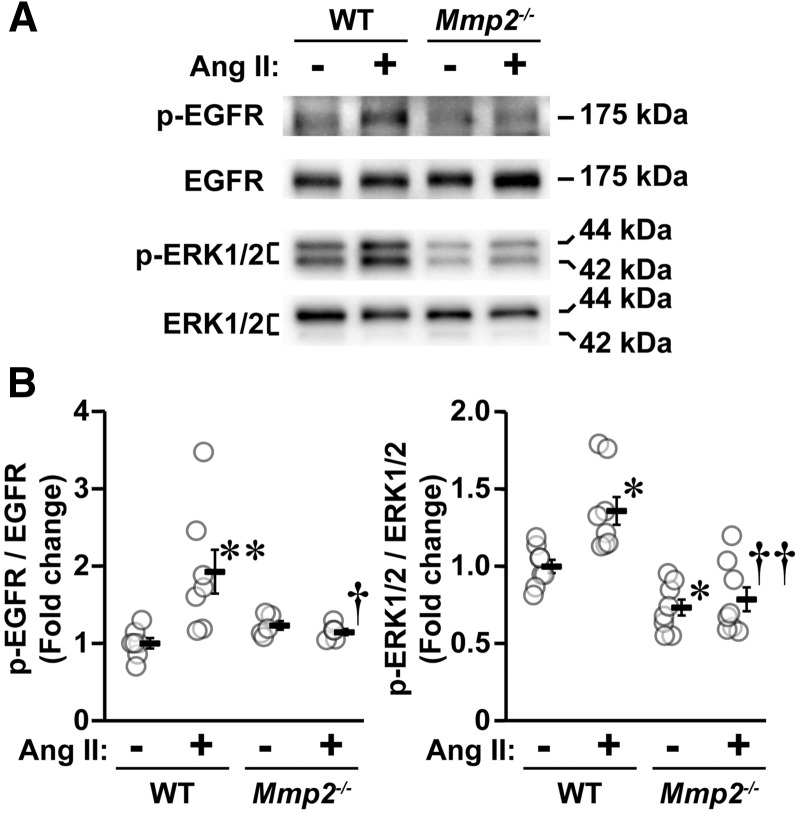
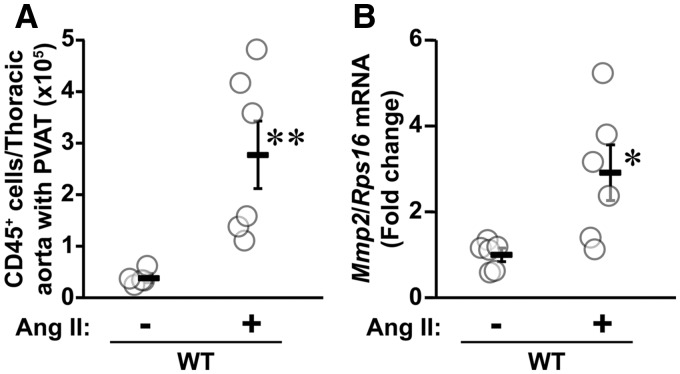
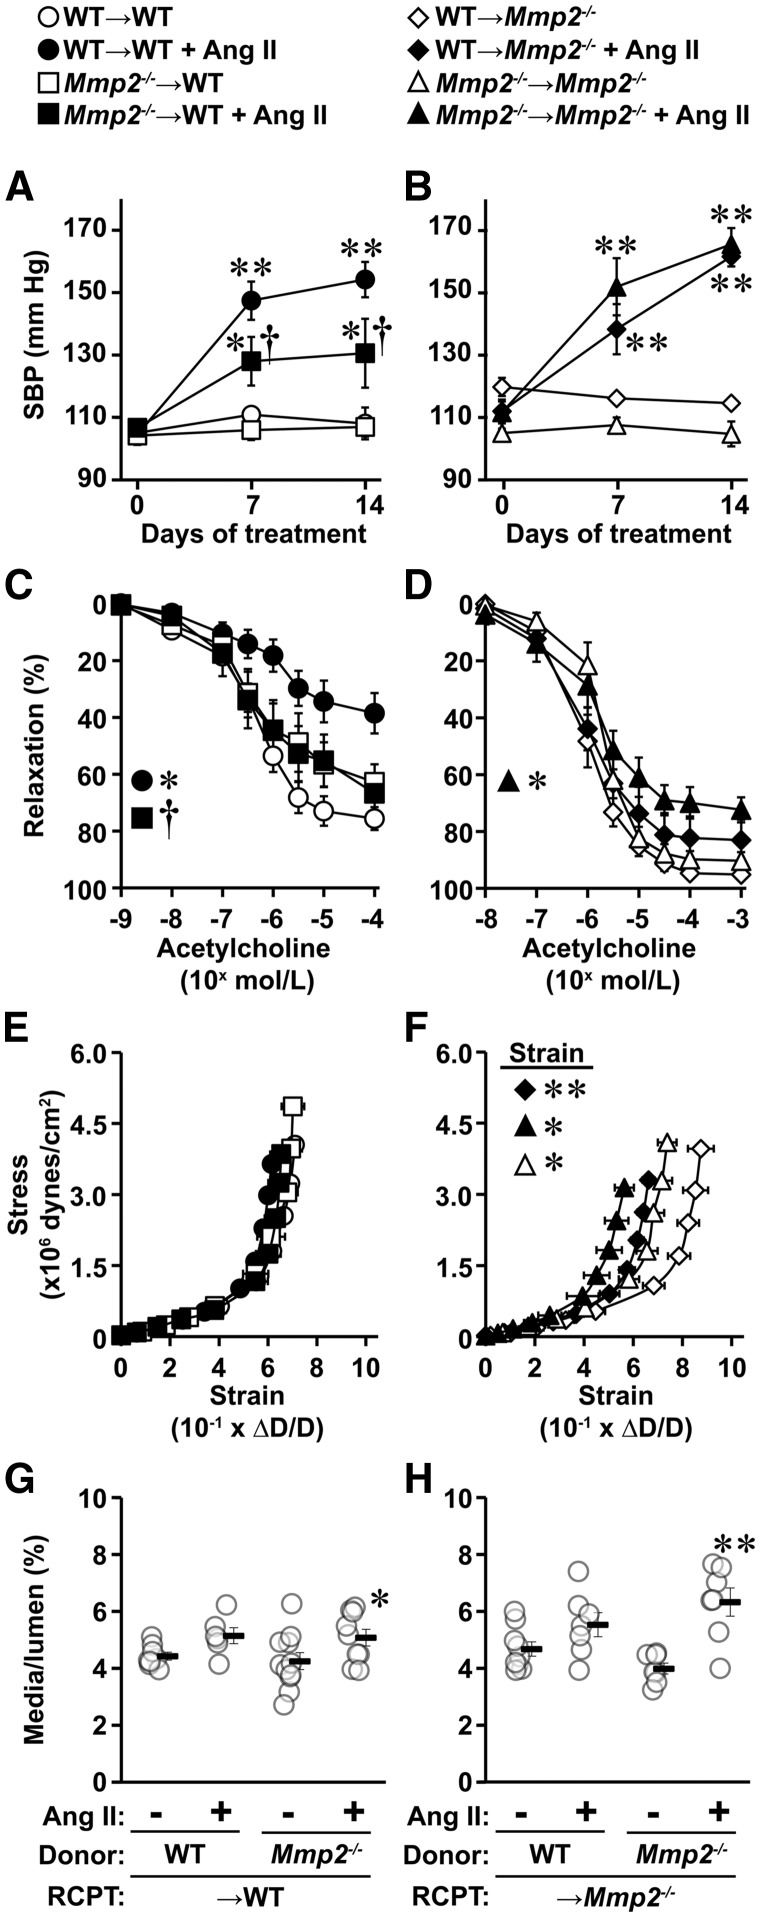
Methods and results: A fourteen-day Ang II infusion (1000 ng/kg/min, SC) increased systolic BP, decreased vasodilatory responses to acetylcholine, induced mesenteric artery (MA) hypertrophic remodelling, and enhanced MA stiffness in wild-type (WT) mice. Ang II enhanced aortic media and perivascular reactive oxygen species generation, aortic vascular cell adhesion molecule-1 and monocyte chemotactic protein-1 expression, perivascular monocyte/macrophage and T cell infiltration, and the fraction of spleen activated CD4+CD69+ and CD8+CD69+ T cells, and Ly-6Chi monocytes. Study of intracellular signalling showed that Ang II increased phosphorylation of epidermal growth factor receptor and extracellular-signal-regulated kinase 1/2 in vascular smooth muscle cells isolated from WT mice. All these effects were reduced or prevented by Mmp2 knockout, except for systolic BP elevation. Ang II increased Mmp2 expression in immune cells infiltrating the aorta and perivascular fat. Bone marrow (BM) transplantation experiments revealed that in absence of MMP2 in immune cells, Ang II-induced BP elevation was decreased, and that when MMP2 was deficient in either immune or vascular cells, Ang II-induced endothelial dysfunction was blunted.

Conclusions: Mmp2 knockout impaired Ang II-induced vascular injury but not BP elevation. BM transplantation revealed a role for immune cells in Ang II-induced BP elevation, and for both vascular and immune cell MMP2 in Ang II-induced endothelial dysfunction.

Keywords: Blood pressure; Bone marrow transplantation; Hypertension; MMP2; Vascular injury.


Figures

Figure 1
Figure 1
Mmp2 gene deletion prevented angiotensin (Ang) II-induced endothelial dysfunction and vascular remodelling but not hypertension. Mean 24-h systolic blood pressure (SBP, A) by telemetry and vasodilator responses to acetylcholine (B), vascular stiffness (C), media/lumen (D), and media cross-sectional area (MCSA, E) of small mesenteric arteries using pressurized myography were determined in wild-type (WT) and Mmp2 knockout (Mmp2-/-) mice infused or not with Ang II for 14 days. Media/lumen and MCSA were determined at an intraluminal pressure of 45 mm Hg. Stiffness was determined by comparing values at 140 mm Hg. Values are means ± SEM. Number of samples per group for A: control groups = 3 and Ang II-treated groups = 5. For B: WT = 7, WT + Ang II = 6 and Mmp2-/- and Mmp2-/- + Ang II = 8. For CE: WT + Ang II = 6 and other groups = 8. Data were analysed using two-way ANOVA for repeated measures in A and B and two-way ANOVA in CE, with all ANOVA followed by a Student–Newman–Keuls post hoc test. Only the SBP of WT + Ang II and Mmp2-/- +Ang II were statistically analysed in A using respective days 0 as untreated controls. The SBP of WT and Mmp2-/- control groups is presented for reference, and is similar to day 0 of Ang II-treated WT and Mmp2-/- mice. The strain at 140 mm Hg was analysed in C. *P <0.05 and **P <0.001 vs. their respective controls and †P <0.05 and ††P <0.001 vs. WT + Ang II.
Figure 2
Figure 2
Mmp2 gene deletion reduced Ang II-induced reactive oxygen species (ROS) generation and extracellular matrix remodelling. ROS generation by dihydroethidium (DHE) staining in the aortic media and adventitia and perivascular adipose tissue (PVAT) (A and D), media fibronectin expression by immunofluorescence (B and E) and adventitial collagen content by Sirius red staining (C and F) were determined in the same groups as in Figure 1. Representative images of DHE staining (A), fibronectin (B) immunofluorescence images and RGB thresholded images of Sirius red staining (C) of aortic sections are shown. Green fluorescence in A and B represents elastin autofluorescence. Values are means ± SEM. Number of samples per group for media in D: Mmp2-/- = 7 and other groups = 6. For Adventitia + PVAT in D: Mmp2-/- = 5 and other groups = 6. For E: controls = 5 and Ang II-treated groups = 6. For F: Mmp2-/-+Ang II = 6 and other groups = 5. Data were analysed using two-way ANOVA followed by a Student–Newman–Keuls post hoc test. *P <0.05 and **P <0.001 vs. their respective controls and P <0.001 vs. WT + Ang II.
Figure 3
Figure 3
Mmp2 gene deletion reduced Ang II-induced inflammation. Aortic VCAM-1 (A and E) and MCP-1 (B and F) expression and MOMA-2+ monocyte/macrophage (C and G) and CD3+ T cell (D and H) infiltration were determined by immunofluorescence in the same groups as in Figure 1. Representative VCAM-1 (A, in red), MCP-1 (B, in red), MOMA-2+ monocyte/macrophages (C, in red), and CD3+ T cell (D, in red) immunofluorescence images of aortic sections are shown. Elastin autofluorescence and nuclear stain DAPI are shown in green and blue, respectively. Arrow heads indicate CD3+ T cells in D. Values are means ± SEM. Number of samples per group for E: WT = 6 and other groups = 5. For F: all groups = 5. For G: Mmp2-/- = 5 and other groups = 6. For H: WT and Mmp2-/- = 5 and Ang II-treated groups = 6. Data were analysed using two-way ANOVA followed by a Student–Newman–Keuls post hoc test. *P <0.05 and **P < 0.001 vs. their respective untreated controls and P <0.05 and vs. ††P <0.01 WT + Ang II.
Figure 4
Figure 4
Mmp2 gene deletion blunted Ang II-induced immune responses. Spleen CD11b+ monocytes (A), activated Ly-6Chi monocytes (B), CD4+CD69+ T cells (C), and CD8+CD69+ T cells (D) were determined by flow cytometry in the same groups as in Figure 1. Values are means ± SEM. Number of samples per group for A and B: WT = 7, WT + Ang II and Mmp2-/- = 6 and Mmp2-/- + Ang II = 5. For C and D: WT and Mmp2-/- + Ang II = 6 and other groups = 7. Data were analysed using two-way ANOVA followed by a Student–Newman–Keuls post hoc test. *P <0.001 vs. their respective controls and P <0.01 and ††P <0.001 vs. WT + Ang II.
Figure 5
Figure 5
Mmp2 gene deletion blunted Ang II-induced signalling in vascular smooth muscle cells (VSMCs). The level of phosphorylation of epidermal growth factor receptor (EGFR) and of p44/42 mitogen-activated protein kinase (extracellular-signal-regulated kinase 1/2, ERK1/2) in VSMCs from small mesenteric arteries cultured in presence or absence of Ang II for 5 min were determined by western blot. Representative western blots of phosphorylated (p) and total EGFR and ERK1/2 (A) and corresponding dot plots (B) are represented. Values are means ± SEM, number of sample per group for p-EGFR/EGFR: WT = 6, Mmp2-/- = 7 and other groups = 5, and for p-ERK1/2/ERK1/2: eight per group. Data were analysed using two-way ANOVA followed by a Student–Newman–Keuls post hoc test. *P <0.01 and **P <0.001 and vs. their respective controls and P <0.01 and vs. ††P <0.01 WT + Ang II.
Figure 6
Figure 6
Angiotensin (Ang) II caused an increase in Mmp2 mRNA expression in aorta/perivascular adipose tissue (PVAT) infiltrating pan (CD45+) immune cells. The infiltrating CD45+ immune cells isolated from aorta/perivascular adipose tissue (PVAT) by fluorescence-activated cell sorting and the mRNA expression of Mmp2 and ribosomal protein S16 (Rps16) assessed by reverse transcription-quantitative PCR were determined in wild-type (WT) mice infused or not with Ang II for 14 days. Values are means ± SEM, number of sample per group: WT = 5 and WT + Ang II = 6. Data were analysed using an unpaired T test. *P <0.05 and **P <0.001 and vs. WT controls.
Figure 7
Figure 7
Absence of MMP2 in immune cells decreased Ang II-induced rise in SBP, and lack of MMP2 in immune or vascular cells blunted Ang II-induced endothelial dysfunction. Bone marrow from wild-type (WT) and Mmp2-/- donor mice was transplanted into γ-irradiated WT (A, C, E and G, WT → WT and Mmp2-/- → WT) and Mmp2-/- (B, D, F and H, WT → Mmp2-/- and Mmp2-/- → Mmp2-/-) recipient (RCPT) mice. One month later, mice were infused or not with Ang II for 14 days. Mean 24-h SBP was determined by telemetry (A and B). Vasodilator responses to acetylcholine (C and D), vascular stiffness (E and F), and remodelling (G and H) of small mesenteric arteries were determined by pressurized myography at the end of the infusion period. Media/lumen was determined with an intraluminal pressure of 45 mm Hg. Values are means ± SEM. Number of samples per group for A: WT → WT and Mmp2-/- → WT + Ang II = 6 and other groups = 7. For B: WT →  Mmp2-/- + Ang II = 6 and other groups = 5. For C: WT → WT = 8, WT → WT + Ang II = 7, Mmp2-/- → WT = 9, and Mmp2-/- → WT + Ang II = 10. For D: WT → Mmp2-/- = 8, Mmp2-/- → Mmp2-/- = 7, and other groups = 6. For E and G: WT → WT = 8, WT → WT +Ang II = 6, Mmp2-/- → WT = 11, and Mmp2-/- → WT +Ang II = 9. For F and H: WT →  Mmp2-/- = 9 and other groups = 7. Data were analysed using two-way ANOVA for repeated measures in AD and two-way ANOVA in EH, with all ANOVA followed by a Student–Newman–Keuls post hoc test. SBP at days 7 and 14 (A and B) and vasodilator responses to acetylcholine 10−6 to 10−4 mol/L (C and D) were statically analysed. The strain at 140 mm Hg was analysed in F. *P <0.05 and **P <0.001 vs. their respective controls, and P <0.05 and ††P <0.001 vs. other Ang II-treated group.

Comment in

References

    1. Schiffrin EL. Vascular remodeling in hypertension: mechanisms and treatment. Hypertension 2012;59:367–374. - PubMed
    1. Paradis P, Schiffrin EL, Renin–angiotensin–aldosterone system and pathobiology of hypertension. In DeMello WC, Frohlich ED (eds). Renin Angiotensin System and Cardiovascular Disease. New York, N.Y: Humana Press, 2009. pp. 35–58.
    1. Idris-Khodja N, Mian MO, Paradis P, Schiffrin EL.. Dual opposing roles of adaptive immunity in hypertension. Eur Heart J 2014;35:1238–1244. - PMC - PubMed
    1. Mian MO, Paradis P, Schiffrin EL.. Innate immunity in hypertension. Curr Hypertens Rep 2014;16:413.. - PubMed
    1. Fontana V, Silva PS, Gerlach RF, Tanus-Santos JE.. Circulating matrix metalloproteinases and their inhibitors in hypertension. Clin Chim Acta 2012;413:656–662. - PubMed

MeSH terms