. 2017 Dec 1;113(14):1743-1752.
doi: 10.1093/cvr/cvx151.

Hierarchical statistical techniques are necessary to draw reliable conclusions from analysis of isolated cardiomyocyte studies

Affiliations

Hierarchical statistical techniques are necessary to draw reliable conclusions from analysis of isolated cardiomyocyte studies

Markus B Sikkel et al. Cardiovasc Res. .

Abstract

Aims: It is generally accepted that post-MI heart failure (HF) changes a variety of aspects of sarcoplasmic reticular Ca2+ fluxes but for some aspects there is disagreement over whether there is an increase or decrease. The commonest statistical approach is to treat data collected from each cell as independent, even though they are really clustered with multiple likely similar cells from each heart. In this study, we test whether this statistical assumption of independence can lead the investigator to draw conclusions that would be considered erroneous if the analysis handled clustering with specific statistical techniques (hierarchical tests).

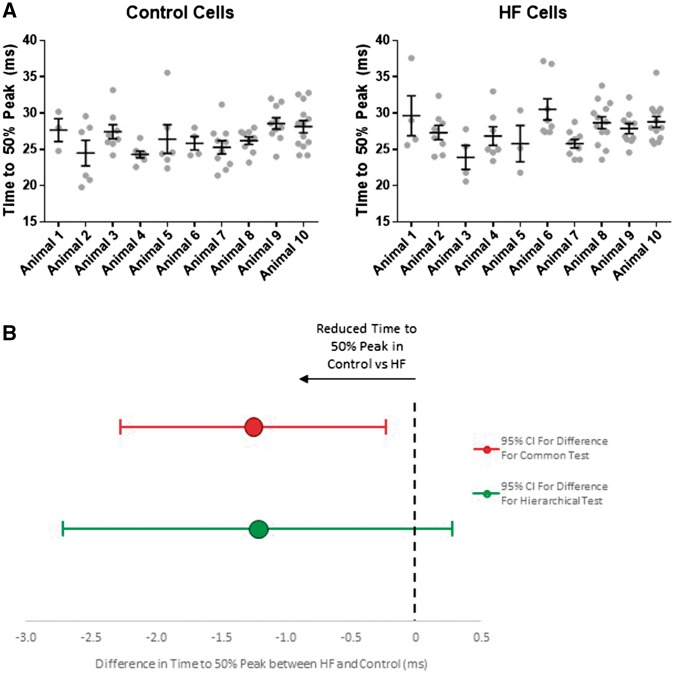
Methods and results: Ca2+ transients were recorded in cells loaded with Fura-2AM and sparks were recorded in cells loaded with Fluo-4AM. Data were analysed twice, once with the common statistical approach (assumption of independence) and once with hierarchical statistical methodologies designed to allow for any clustering. The statistical tests found that there was significant hierarchical clustering. This caused the common statistical approach to underestimate the standard error and report artificially small P values. For example, this would have led to the erroneous conclusion that time to 50% peak transient amplitude was significantly prolonged in HF. Spark analysis showed clustering, both within each cell and also within each rat, for morphological variables. This means that a three-level hierarchical model is sometimes required for such measures. Standard statistical methodologies, if used instead, erroneously suggest that spark amplitude is significantly greater in HF and spark duration is reduced in HF.

Conclusion: Ca2+ fluxes in isolated cardiomyocytes show so much clustering that the common statistical approach that assumes independence of each data point will frequently give the false appearance of statistically significant changes. Hierarchical statistical methodologies need a little more effort, but are necessary for reliable conclusions. We present cost-free simple tools for performing these analyses.

Keywords: Ca2+ spark; Ca2+ transient; Cardiomyocyte; Hierarchical statistics.


Figures

Figure 1
Figure 1
Hierarchical structure of data attained from studies of isolated cardiomyocytes. Multiple cardiomyocytes originate from each isolation. Differences in the animals from which the myocytes originate, as well as slight variations in quality of isolation or experimental conditions on any one day, may result in measurements taken from the myocyte from one rat being more closely related to each other than to measurements from a different isolations. That is, measurements in cell A are more likely to be similar to those in cell B vs. those in cell C in the diagram. A fundamental condition of common statistical tests (e.g. t-tests), that of independence of data points, is therefore contravened. An example of a further level of hierarchy is shown for the middle rat with multiple individual sparks recorded from each cell.
Figure 2
Figure 2
Intraclass correlation in cardiomyocyte studies. Examples of data with high, moderate, or low intraclass correlations (ICCs). Intracellular calcium concentration ([Ca2+]i) from individual cells (red dots) is clustered into histograms making up the data distributions in individual rat hearts. In the top panel, there is a high ICC with data clustered tightly in each heart. In the middle panel, there is an intermediate ICC and in the bottom panel there is a low ICC with a high proportion of the overall variability coming from each individual heart. A larger correction to common statistical techniques is required in data with a high ICC.
Figure 3
Figure 3
Correction for clustering produced by hierarchical tests. Description of correction to the confidence interval for the difference between control and HF for clustered data that is produced using hierarchical tests.
Figure 4
Figure 4
Clustering of time to 50% peak transient amplitude. (A) Clustering of time to peak is shown with the time to 50% peak for transient in each cell (grey dots) shown for each rat in HF and control. The mean and standard error bars are shown for each rat. By eye the data appear clustered and this is confirmed by the statistical testing in Table 2. (B) The mean difference and confidence interval for the difference are shown which indicates why the difference between HF and control becomes non-significant with the corrected confidence intervals of the hierarchical test (green bars) compared with the uncorrected confidence intervals of the common test (red bars). There were 76 cells from 10 control rats and 79 cells from 10 HF rats.
Figure 5
Figure 5
Multi-level clustering of spark logAmp. (A) Clustering of spark LogAmp is shown within each of five cells tested from a single rat heart. Each individual spark’s logAmp is shown as a grey dot. The mean and standard error bars are shown for each cell. By eye the data appear clustered at this level and this is confirmed in Table 3. (B) Spark data may also be further clustered within individual rats. Here sparks are shown grouped by rat. As confirmed in Table 3 there is also clustering at the level of the rat. (C) With two levels of clustering to correct for with a large ICC (58%) a large correction to confidence intervals is required. With the common test there is a highly significant difference comparing logAmp in HF and control (red bars). With the appropriate correction to confidence interval (green bars) it is clear there is no significant difference. There were 344 sparks from 17 cells from 7 control rats and 352 sparks from 22 cells from 5 HF rats.

Comment in

  • Avoiding phantasms.
    Coulibaly Z, Chen-Izu Y, Izu LT. Coulibaly Z, et al. Cardiovasc Res. 2017 Dec 1;113(14):1703-1704. doi: 10.1093/cvr/cvx195. Cardiovasc Res. 2017. PMID: 29036639 Free PMC article. No abstract available.

Similar articles

Cited by

References

    1. Epstein F, Morgan J.. Abnormal intracellular modulation of calcium as a major cause of cardiac contractile dysfunction. N Engl J Med 1991;325:625–632. - PubMed
    1. Johns TN, Olson BJ.. Experimental myocardial infarction. I. A method of coronary occlusion in small animals. Ann Surg 1954;140:675–682. - PMC - PubMed
    1. Lyon AR, MacLeod KT, Zhang Y, Garcia E, Kanda GK, Lab MJ, Korchev YE, Harding SE, Gorelik J.. Loss of T-tubules and other changes to surface topography in ventricular myocytes from failing human and rat heart. Proc Natl Acad Sci U S A 2009;106:6854–6859. - PMC - PubMed
    1. Cheung JY, Musch TI, Misawa H, Semanchick A, Elensky M, Yelamarty RV, Moore RL.. Impaired cardiac function in rats with healed myocardial infarction: cellular vs. myocardial mechanisms. Am J Physiol 1994;266:C29–C36. - PubMed
    1. Soppa GKR, Lee J, Stagg MA, Felkin LE, Barton PJR, Siedlecka U, Youssef S, Yacoub MH, Terracciano CMN.. Role and possible mechanisms of clenbuterol in enhancing reverse remodelling during mechanical unloading in murine heart failure. Cardiovasc Res 2008;77:695–706. - PMC - PubMed