. 2017 Nov 1;113(13):1688-1699.
doi: 10.1093/cvr/cvx167.

Triggered intracellular calcium waves in dog and human left atrial myocytes from normal and failing hearts

Affiliations

Triggered intracellular calcium waves in dog and human left atrial myocytes from normal and failing hearts

Gary L Aistrup et al. Cardiovasc Res. .

Abstract

Aims: Abnormal intracellular Ca2+ cycling contributes to triggered activity and arrhythmias in the heart. We investigated the properties and underlying mechanisms for systolic triggered Ca2+ waves in left atria from normal and failing dog hearts.

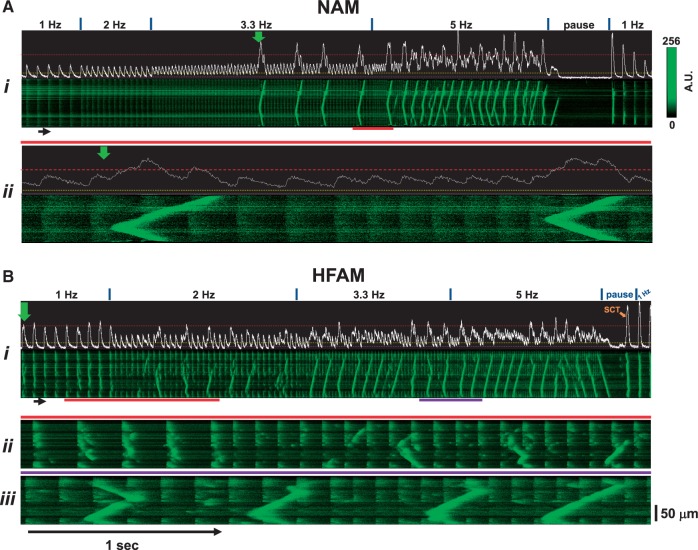
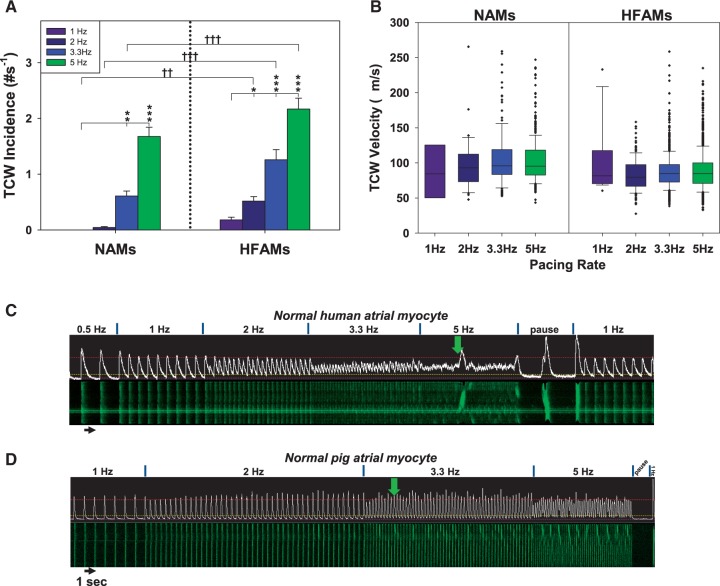
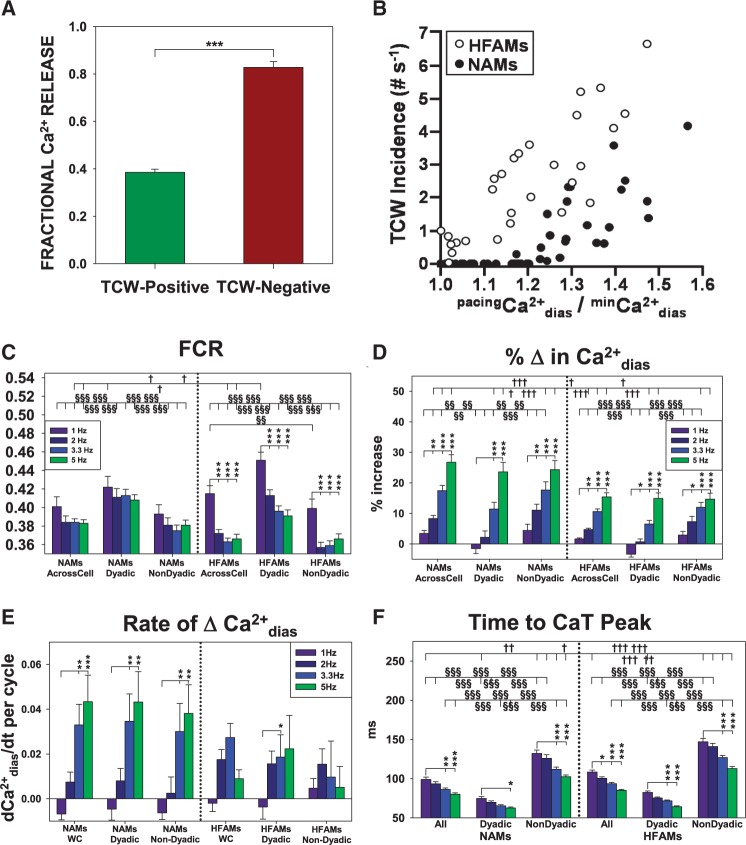
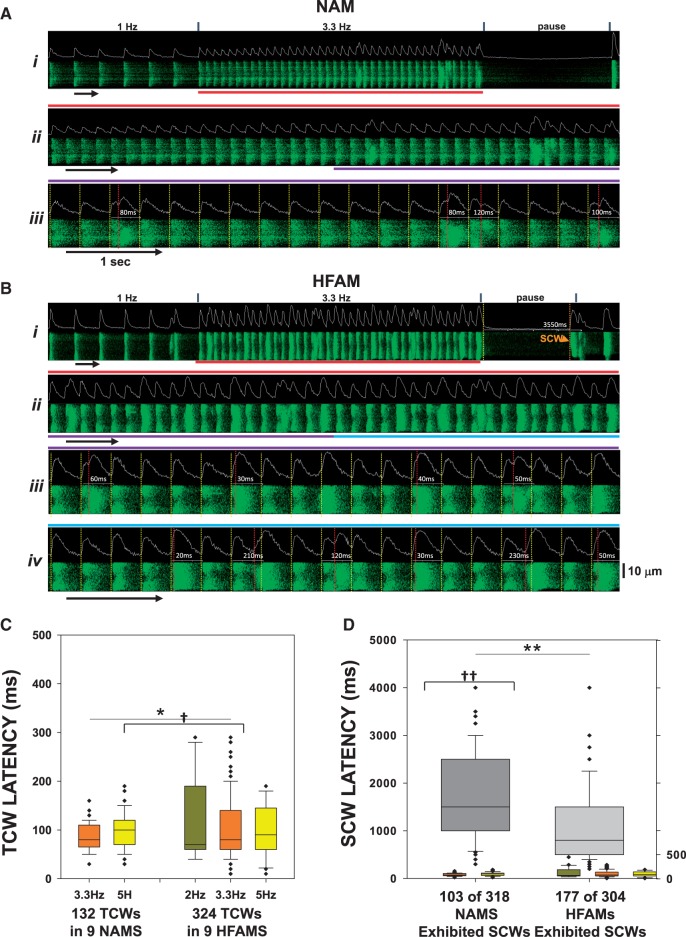
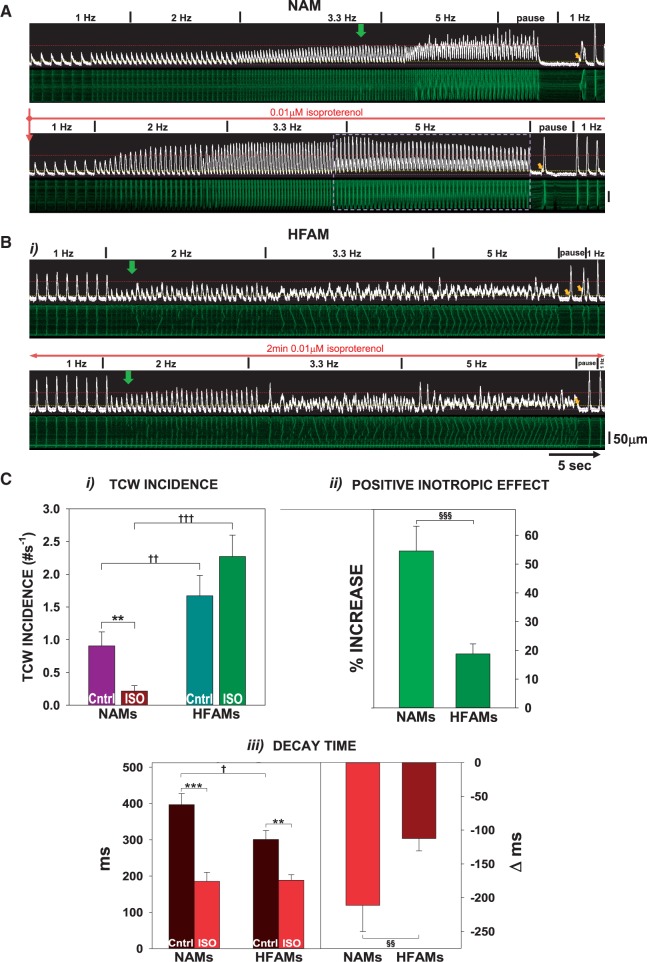
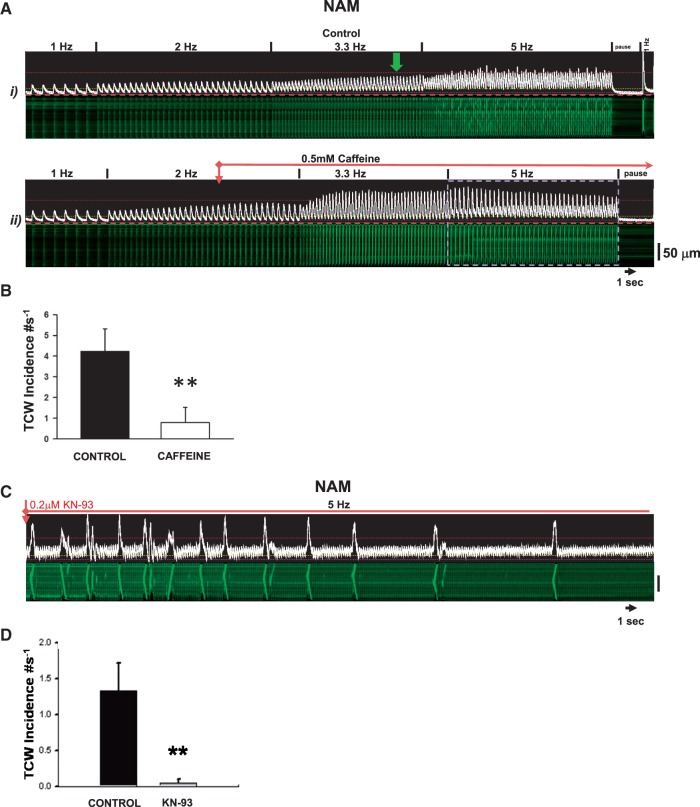
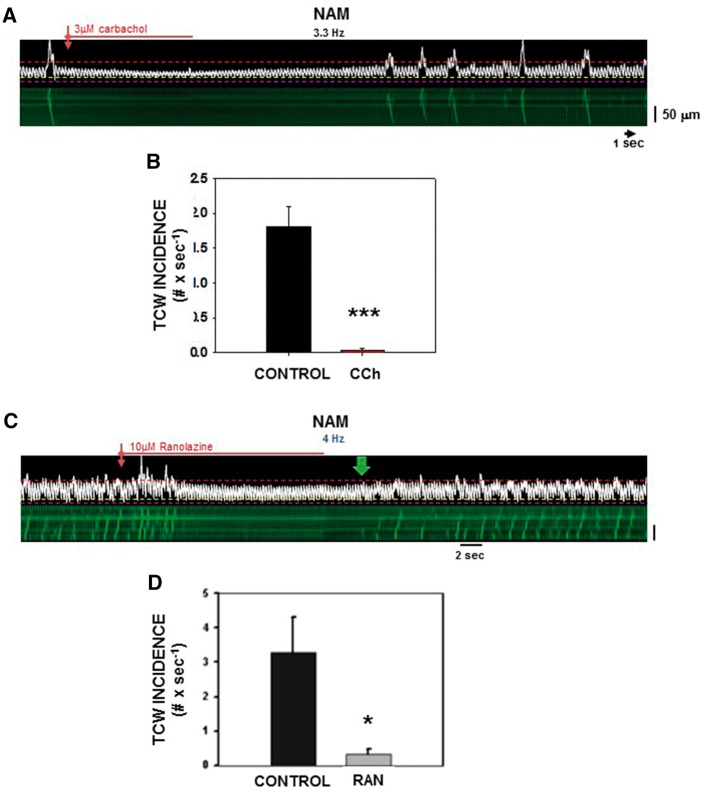
Methods and results: Intracellular Ca2+ cycling was studied using confocal microscopy during rapid pacing of atrial myocytes (36 °C) isolated from normal and failing canine hearts (ventricular tachypacing model). In normal atrial myocytes (NAMs), Ca2+ waves developed during rapid pacing at rates ≥ 3.3 Hz and immediately disappeared upon cessation of pacing despite high sarcoplasmic reticulum (SR) load. In heart failure atrial myocytes (HFAMs), triggered Ca2+ waves (TCWs) developed at a higher incidence at slower rates. Because of their timing, TCW development relies upon action potential (AP)-evoked Ca2+ entry. The distribution of Ca2+ wave latencies indicated two populations of waves, with early events representing TCWs and late events representing conventional spontaneous Ca2+ waves. Latency analysis also demonstrated that TCWs arise after junctional Ca2+ release has occurred and spread to non-junctional (cell core) SR. TCWs also occurred in intact dog atrium and in myocytes from humans and pigs. β-adrenergic stimulation increased Ca2+ release and abolished TCWs in NAMs but was ineffective in HFAMs making this a potentially effective adaptive mechanism in normals but potentially arrhythmogenic in HF. Block of Ca-calmodulin kinase II also abolished TCWs, suggesting a role in TCW formation. Pharmacological manoeuvres that increased Ca2+ release suppressed TCWs as did interventions that decreased Ca2+ release but these also severely reduced excitation-contraction coupling.

Conclusion: TCWs develop during the atrial AP and thus could affect AP duration, producing repolarization gradients and creating a substrate for reentry, particularly in HF where they develop at slower rates and a higher incidence. TCWs may represent a mechanism for the initiation of atrial fibrillation particularly in HF.

Keywords: Atrial fibrillation; Atrium; Heart failure; Ca2+ waves.


Figures

Figure 1
Figure 1
Triggered Ca2+ waves (TCWs) develop during rapid pacing in atrial myocytes from normal dog hearts (NAMs) and from failing dog hearts (HFAMs). (A) Continuous linescan image (Ai) recorded during progressive increases in rate from 1 to 5 Hz followed by a pause and return to basal pacing (1 Hz) with expanded time scale (red bars) shown in Aii. Mean fluorescence (Ft) profile is shown above each image. (B) Same for an HFAM with two expanded regions in Bii (red bars) and in Biii (purple bars). Dashed purple line demarks minCadias2+, a dashed yellow line demarks ∼15% above that level and a dashed red line demarks 0.5 fractional SR Ca2+ release. Green arrows indicate time of first TCW and orange arrows indicate spontaneous Ca2+ waves (SCWs) or transients (SCTs) during the pause. The fluorescence intensity scale is the same for all figures.
Figure 2
Figure 2
TCW incidence is greater with increasing rate and in HF while velocity is unchanged. (A) Incidence of TCWs in NAMs (52 myocytes from four atria) and HFAMs (46 HFAMs from four atria). (B) Box-plot summary of rate dependence of TCW propagation velocities. Box boundary closest to zero indicates the 25th percentile, the line in the box marks the median, boundary of the box farthest from zero indicates the 75th percentile while error bars above and below the box indicate the 90th and 10th percentiles, respectively (×’s are outliers). (C) TCWs in a paced human NAM and (D) a pig NAM. *P < 0.05, **P < 0.01, ***P < 0.001 for NAMs or HFAMs within pacing rates, two-way RM ANOVA. P < 0.05, ††P < 0.01, †††P < 0.001 between NAMs and HFAMs within pacing rates, two-way ANOVA.
Figure 3
Figure 3
TCWs are abolished at high fractional Ca2+ release and increase in frequency as diastolic Ca2+ increases in both NAMs and HFAMs. (A) Mean ±SEM fractional Ca2+ release (FCR) normalized to the first post-pacing beat (PP1CaTpeak) at 5 Hz pacing in TCW-positive vs. TCW-negative NAMs (n =45 from eight atria; ***P <0.001). (B) Dependence of TCW incidence in NAMs (11 NAMs from three atria) and in HFAMs (seven HFAMs from three atria) on Cadias2+. (C) FCR measured across-cell and in dyadic and non-dyadic regions. (D) Rate dependence of regional and whole cell %↑Cadias2+. (E) Rate of change in (Δ%/cycle) in Casyst2+ with increasing pacing rate. (F) Rate dependence of time to the peak of the Ca2+ transients. (CF) n =45 NAMs from eight atria; n =89 HFAMs from seven atria using longitudinal recordings. *P < 0.01, **P < 0.01, ***P < 0.001 between pacing rates within NAMs or HFAMs, 1-way RM ANOVA. §P < 0.05, §§P < 0.01, §§§P < 0.001 whole cell vs. dyadic vs. non-dyadic CaTs of NAMs or HFAMs within pacing rates, two-way ANOVA. †P < 0.05, ††P < 0.01, †††P < 0.001 whole cell vs. dyadic vs. non-dyadic CaTs of NAMs or HFAMs within pacing rates, two-way ANOVA.
Figure 4
Figure 4
Latencies for TCWs are greater than for SCWs. (A i) Transverse recording of a paced NAM. (Ii–iv) Time-expansion of recording in (i) indicated by red, purple and blue bars. Vertical yellow lines indicate junctional CaT initiations and vertical red lines indicate the initiation time for each TCW with respect to prior CaT initiation within that cycle. (B) Latency measurements in an HFAM. (C) Box-plot summary of TCW initiation latency in NAMs (eight atria) and HFAMs (seven atria). Two-way ANOVA was used for comparisons between means. (D) Box-plot summary of SCWs in NAMs and HFAMs with TCW data from C included for comparison. See legend in Figure 2 for explanation of box plot details. P < 0.05, ††P < 0.01 using unpaired t-test was used for comparisons between means.
Figure 5
Figure 5
β-adrenergic stimulation suppresses TCWs in NAMs but has little effect in HFAMs. (A) Example of a NAM before and during exposure to isoproterenol (ISO). Dashed box indicates presence of CaT alternans. (B) Example of ISO effects in an HFAM. (C i) Summary of ISO action on TCW incidence in NAMs vs. HFAMs at 3.3–5 Hz; (ii) F/F0 and change in F/F0 with ISO (1 Hz); (iii) CaT 90–10% decay time and change in decay time with ISO (1 Hz). n =16 NAMs from six atria; n =43 HFAMs from nine atria. **P < 0.01; ***P < 0.001 between ISO and Control. P < 0.05, ††P < 0.01, †††P < 0.001; §§P < 0.01, §§§P < 0.001 between NAMs and HFAMs using two-way ANOVA or unpaired and paired t-tests.
Figure 6
Figure 6
Low concentrations of caffeine and KN-93 suppress TCWs. (A) Example of a NAM during pacing at 5 Hz before and during exposure to caffeine. (B) Summary of caffeine effects (n =14 NAMs from five normal atria). (C) Effects of KN-93 on TCWs during constant pacing at 5 Hz with summary shown in D (n =16 NAMs from six atria). **P <0.01 (paired t-test).
Figure 7
Figure 7
CCh and ranolazine suppress TCWs. (A) Effects of CCh on TCWs in a NAM before, during and after washout during constant pacing at 3.3 Hz. (B) Summary of effects of CCh (n =21 NAMs from five normal atria). ***P < 0.001 (paired t-test). (C) Actions of ranolazine on TCWs. Typical linescan recording of a NAM before and during a brief exposure to 10 µM ranolazine. (D) Summary of TCW incidence before and after ranolazine (n =6 NAMs from three normal atria). *P < 0.05 (paired t-test).

References

    1. Ter Keurs HE, Boyden PA.. Calcium and arrhythmogenesis. Physiol Rev 2007;87:457–506. - PMC - PubMed
    1. Aistrup GL, Balke CW, Wasserstrom JA.. Arrhythmia triggers in heart failure: the smoking gun of [Ca2+]i dysregulation. Heart Rhythm 2011;8:1804–1808. - PubMed
    1. Schotten U, Verheule S, Kirchhof P, Goette A.. Pathophysiological mechanisms of atrial fibrillation: a translational appraisal. Physiol Rev 2011;91:265–325. - PubMed
    1. Voigt N, Heijman J, Wang Q, Chiang DY, Li N, Karck M, Wehrens XHT, Nattel S, Dobrev D.. Cellular and molecular mechanisms of atrial arrhythmogenesis in patients with paroxysmal atrial fibrillation. Circulation 2014;129:145–156. - PMC - PubMed
    1. Greiser M, Kerfant BG, Williams GS, Voigt N, Harks E, Dibb KM, Giese A, Meszaros J, Verheule S, Ravens U, Allessie MA, Gammie JS, van der Velden J, Lederer WJ, Dobrev D, Schotten U.. Tachycardia-induced silencing of subcellular Ca2+ signaling in atrial myocytes. J Clin Invest 2014;124:4759–4772. - PMC - PubMed

Publication types

MeSH terms

Substances