

Trivalent CAR T cells overcome interpatient antigenic variability in glioblastoma
- PMID: 29016929
- PMCID: PMC5909636
- DOI: 10.1093/neuonc/nox182
Trivalent CAR T cells overcome interpatient antigenic variability in glioblastoma
Erratum in
-
Tandem CAR T cells targeting HER2 and IL13Rα2 mitigate tumor antigen escape.J Clin Invest. 2021 Jul 1;131(13):e152477. doi: 10.1172/JCI152477. J Clin Invest. 2021. PMID: 34196303 Free PMC article. No abstract available.
-
Correction to: Trivalent CAR T cells overcome interpatient antigenic variability in glioblastoma.Neuro Oncol. 2023 Sep 5;25(9):1727-1728. doi: 10.1093/neuonc/noad091. Neuro Oncol. 2023. PMID: 37247335 Free PMC article. No abstract available.
Abstract
Background: Glioblastoma (GBM) is the most common primary malignant brain cancer, and is currently incurable. Chimeric antigen receptor (CAR) T cells have shown promise in GBM treatment. While we have shown that combinatorial targeting of 2 glioma antigens offsets antigen escape and enhances T-cell effector functions, the interpatient variability in surface antigen expression between patients hinders the clinical impact of targeting 2 antigen pairs. This study addresses targeting 3 antigens using a single CAR T-cell product for broader application.
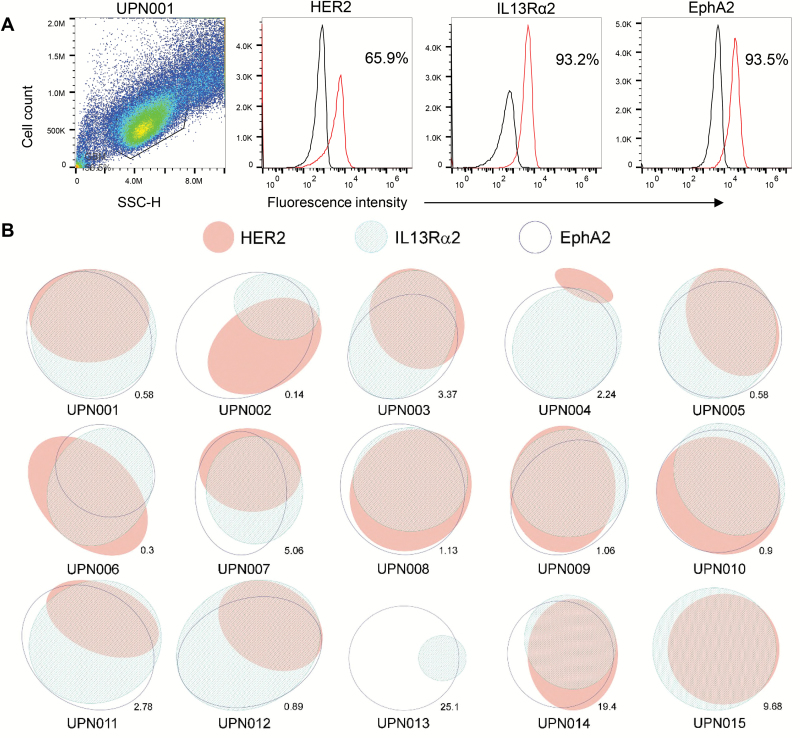
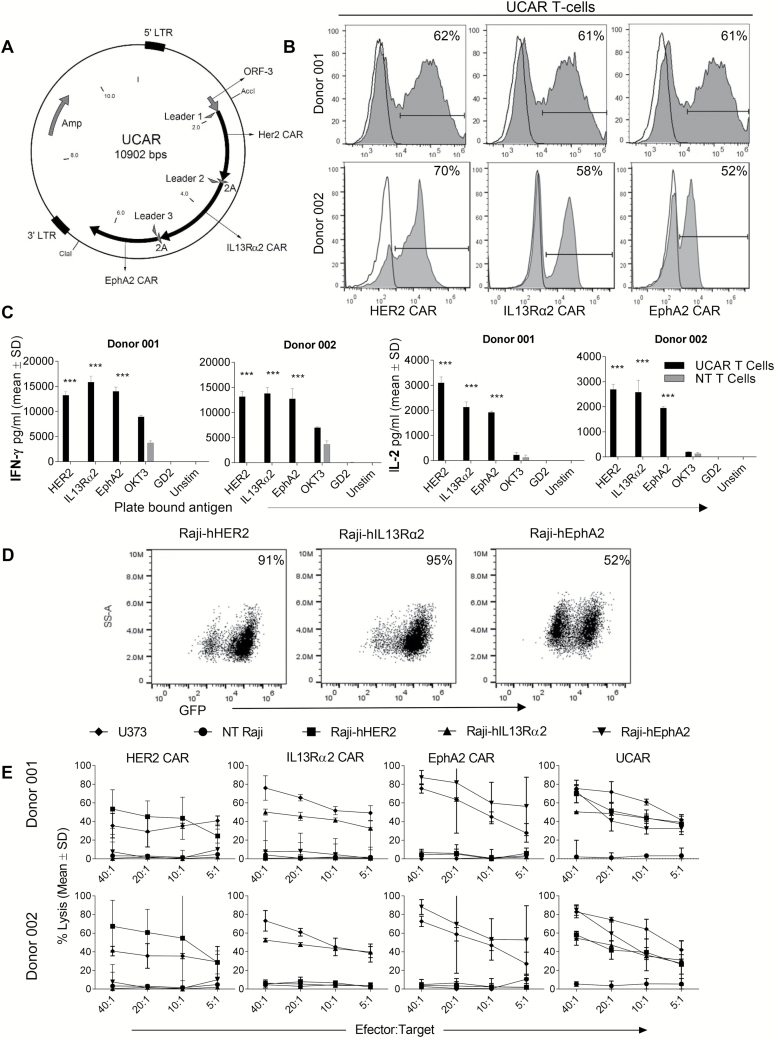
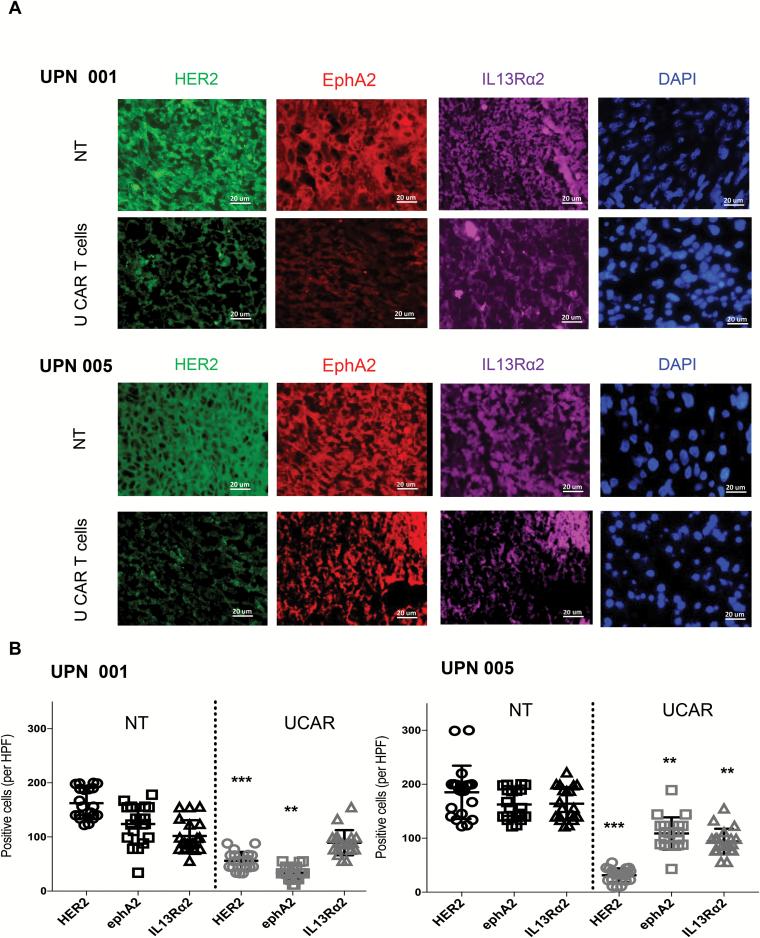
Methods: We analyzed the surface expression of 3 targetable glioma antigens (human epidermal growth factor receptor 2 [HER2], interleukin-13 receptor subunit alpha-2 [IL13Rα2], and ephrin-A2 [EphA2]) in 15 primary GBM samples. Accordingly, we created a trivalent T-cell product armed with 3 CAR molecules specific for these validated targets encoded by a single universal (U) tricistronic transgene (UCAR T cells).
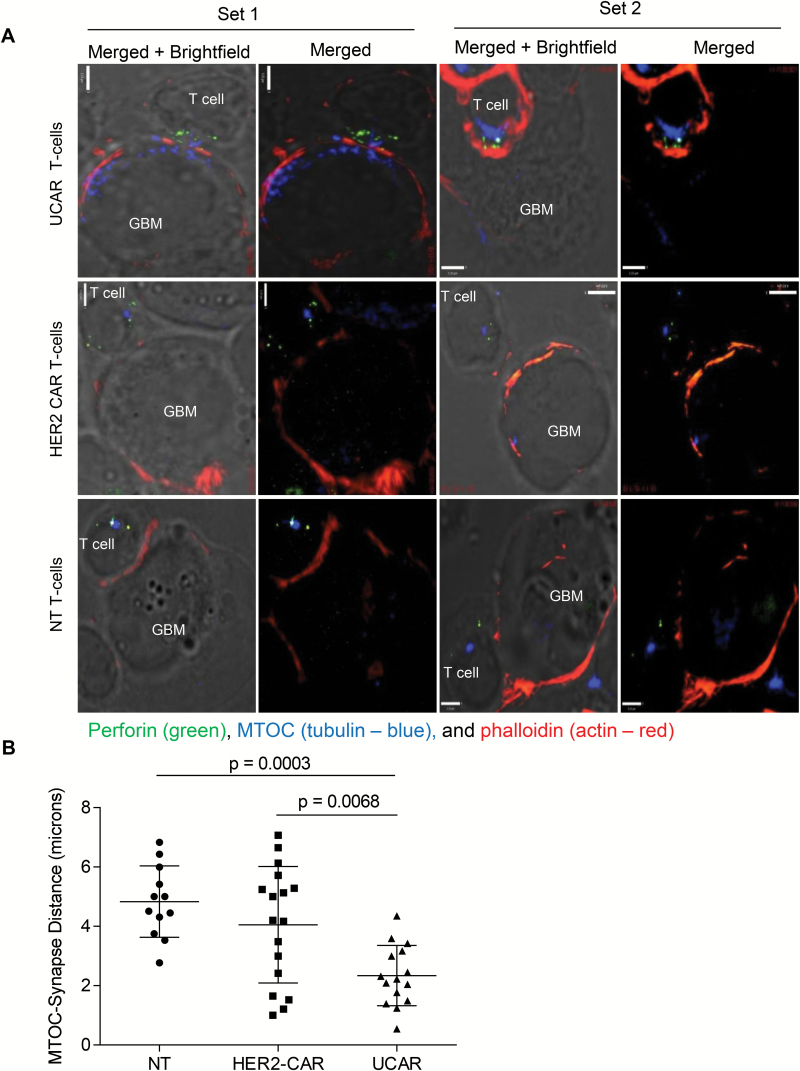
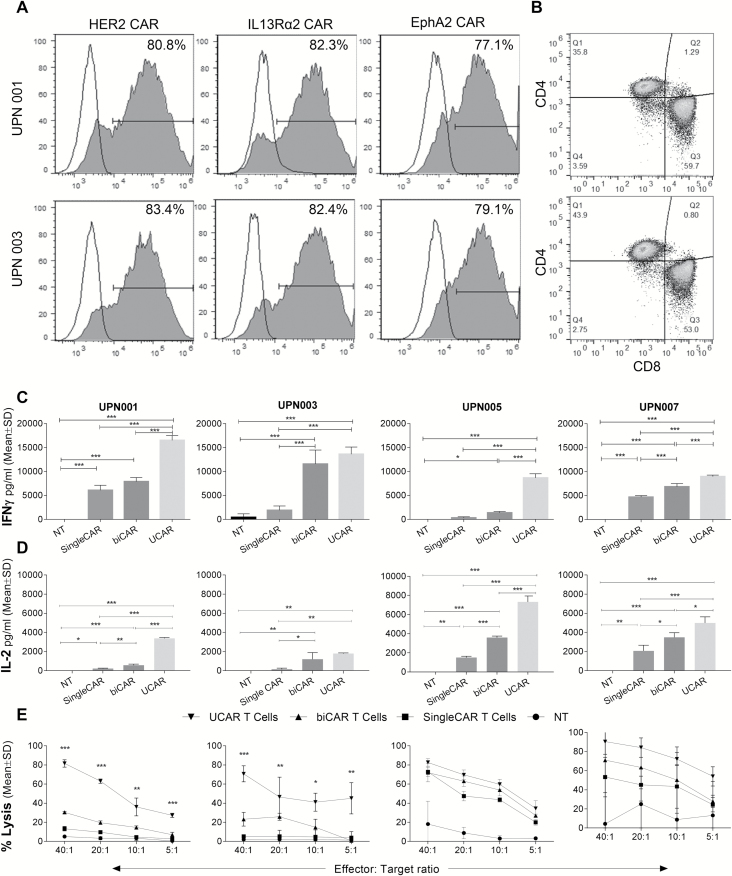
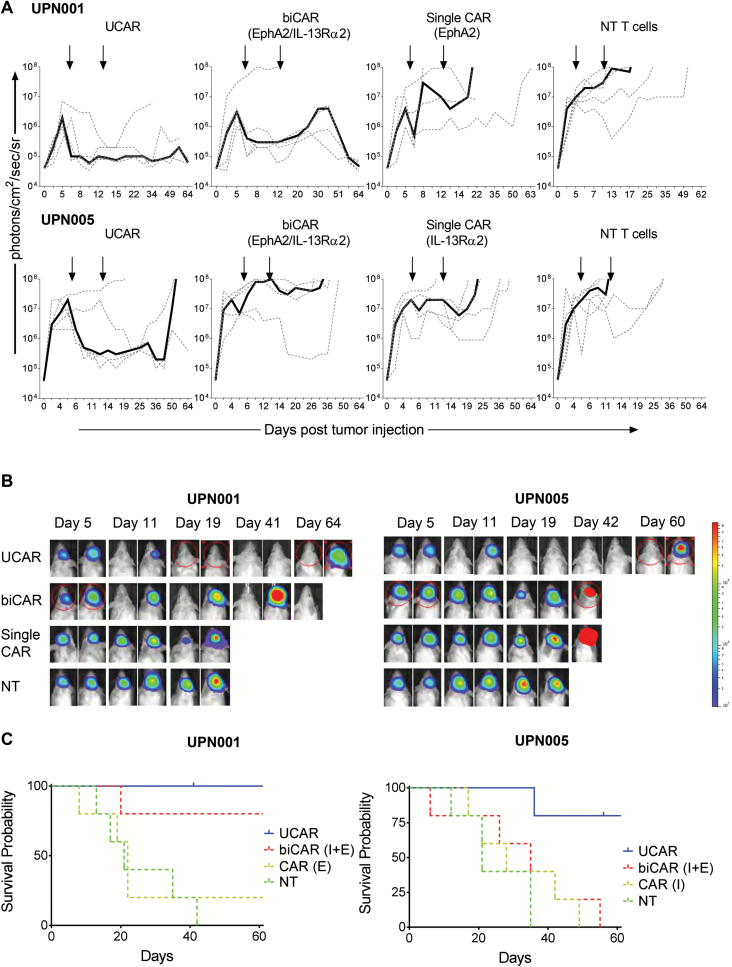
Results: Our data showed that co-targeting HER2, IL13Rα2, and EphA2 could overcome interpatient variability by a tendency to capture nearly 100% of tumor cells in most tumors tested in this cohort. UCAR T cells made from GBM patients' blood uniformly expressed all 3 CAR molecules with distinct antigen specificity. UCAR T cells mediated robust immune synapses with tumor targets forming more polarized microtubule organizing centers and exhibited improved cytotoxicity and cytokine release over best monospecific and bispecific CAR T cells per patient tumor profile. Lastly, low doses of UCAR T cells controlled established autologous GBM patient derived xenografts (PDXs) and improved survival of treated animals.
Conclusion: UCAR T cells can overcome antigenic heterogeneity in GBM and lead to improved treatment outcomes.
Figures
Comment in
-
Comment on "Trivalent CAR T cells overcome interpatient antigenic variability in glioblastoma".Neuro Oncol. 2018 Jun 18;20(7):1003-1004. doi: 10.1093/neuonc/noy045. Neuro Oncol. 2018. PMID: 29648659 Free PMC article. No abstract available.
-
Response to the comment on "Trivalent CAR T cells overcome interpatient antigenic variability in glioblastoma" by Bielamowicz et al.Neuro Oncol. 2018 Jun 18;20(7):1004-1005. doi: 10.1093/neuonc/noy079. Neuro Oncol. 2018. PMID: 29788442 Free PMC article. No abstract available.
References
-
- Wykosky J, Gibo DM, Stanton C, Debinski W. EphA2 as a novel molecular marker and target in glioblastoma multiforme. Mol Cancer Res. 2005;3(10):541–551. - PubMed
-
- Jarboe JS, Johnson KR, Choi Y, Lonser RR, Park JK. Expression of interleukin-13 receptor alpha2 in glioblastoma multiforme: implications for targeted therapies. Cancer Res. 2007;67(17):7983–7986. - PubMed
-
- Liu G, Ying H, Zeng G, Wheeler CJ, Black KL, Yu JS. HER-2, gp100, and MAGE-1 are expressed in human glioblastoma and recognized by cytotoxic T cells. Cancer Res. 2004;64(14):4980–4986. - PubMed
-
- Eshhar Z, Waks T, Bendavid A, Schindler DG. Functional expression of chimeric receptor genes in human T cells. J Immunol Methods. 2001;248(1–2):67–76. - PubMed
Publication types
MeSH terms
Substances
Grants and funding
LinkOut - more resources
Full Text Sources
Other Literature Sources
Research Materials
Miscellaneous
