

Biases introduced by filtering electronic health records for patients with "complete data"
- PMID: 29016972
- PMCID: PMC6080680
- DOI: 10.1093/jamia/ocx071
Biases introduced by filtering electronic health records for patients with "complete data"
Abstract
Objective: One promise of nationwide adoption of electronic health records (EHRs) is the availability of data for large-scale clinical research studies. However, because the same patient could be treated at multiple health care institutions, data from only a single site might not contain the complete medical history for that patient, meaning that critical events could be missing. In this study, we evaluate how simple heuristic checks for data "completeness" affect the number of patients in the resulting cohort and introduce potential biases.
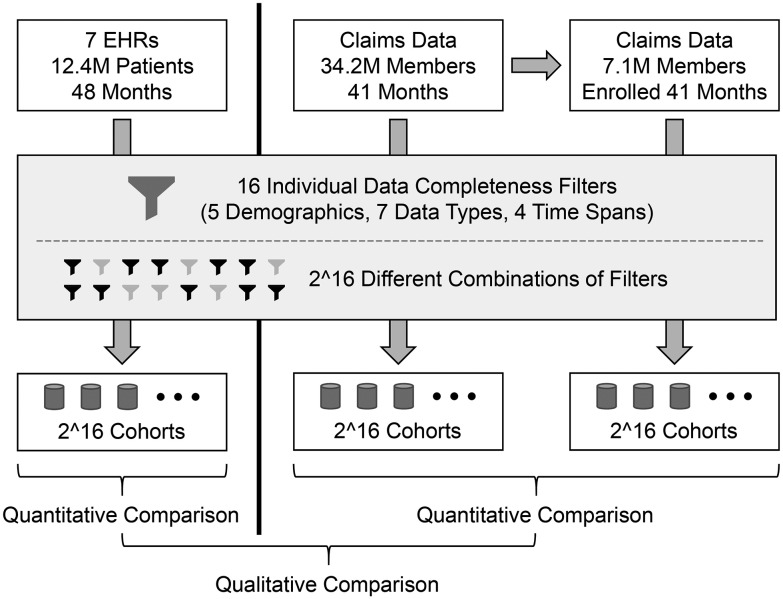
Materials and methods: We began with a set of 16 filters that check for the presence of demographics, laboratory tests, and other types of data, and then systematically applied all 216 possible combinations of these filters to the EHR data for 12 million patients at 7 health care systems and a separate payor claims database of 7 million members.
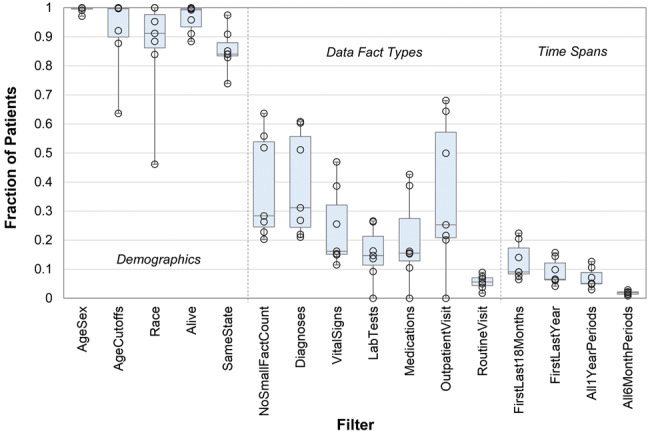
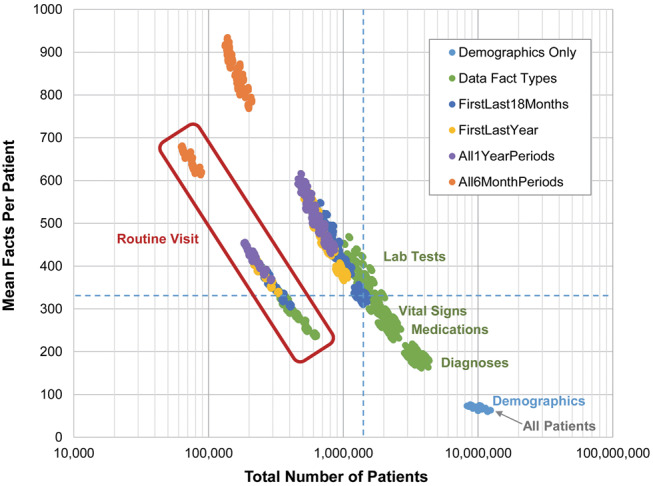
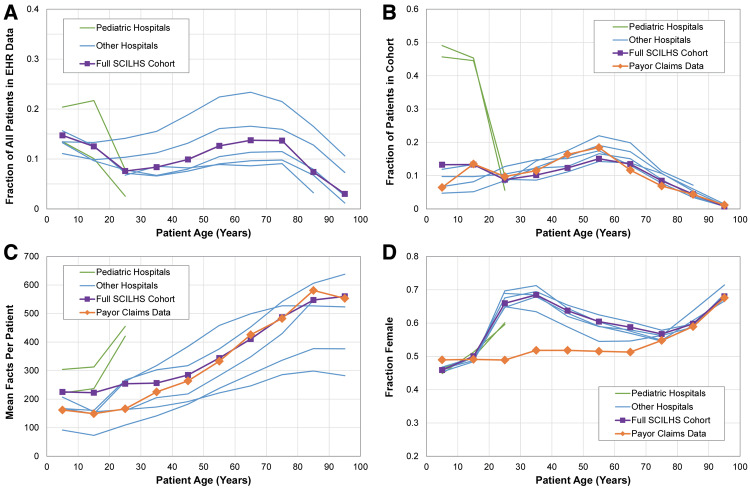
Results: EHR data showed considerable variability in data completeness across sites and high correlation between data types. For example, the fraction of patients with diagnoses increased from 35.0% in all patients to 90.9% in those with at least 1 medication. An unrelated claims dataset independently showed that most filters select members who are older and more likely female and can eliminate large portions of the population whose data are actually complete.
Discussion and conclusion: As investigators design studies, they need to balance their confidence in the completeness of the data with the effects of placing requirements on the data on the resulting patient cohort.
Keywords: claims data; data accuracy; electronic health records; information storage and retrieval; selection bias.
© The Author 2017. Published by Oxford University Press on behalf of the American Medical Informatics Association. All rights reserved. For Permissions, please email: journals.permissions@oup.com
Figures
References
-
- Bourgeois FC, Olson KL, Mandl KD. Patients treated at multiple acute health care facilities: quantifying information fragmentation. Arch Int Med. 2010;170:1989–95. - PubMed
MeSH terms
Grants and funding
LinkOut - more resources
Full Text Sources
Other Literature Sources
Research Materials
