. 2017 Oct 9;32(4):474-489.e6.
doi: 10.1016/j.ccell.2017.09.003.

Androgen Receptor Pathway-Independent Prostate Cancer Is Sustained through FGF Signaling

Affiliations

Androgen Receptor Pathway-Independent Prostate Cancer Is Sustained through FGF Signaling

Eric G Bluemn et al. Cancer Cell. .

Abstract

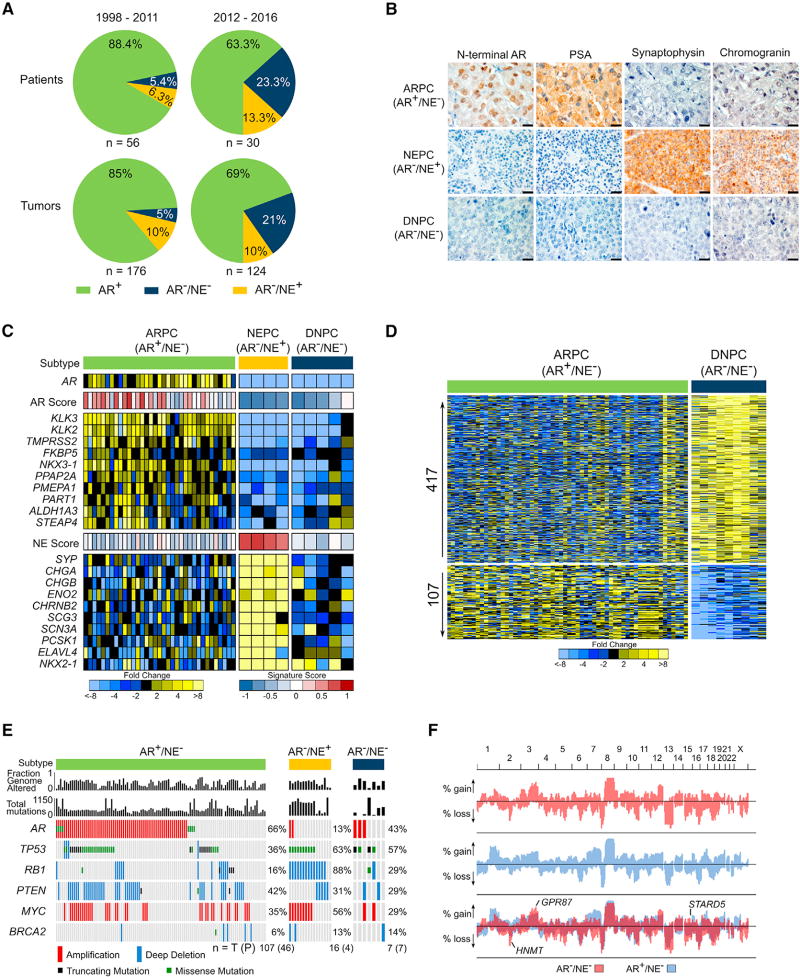
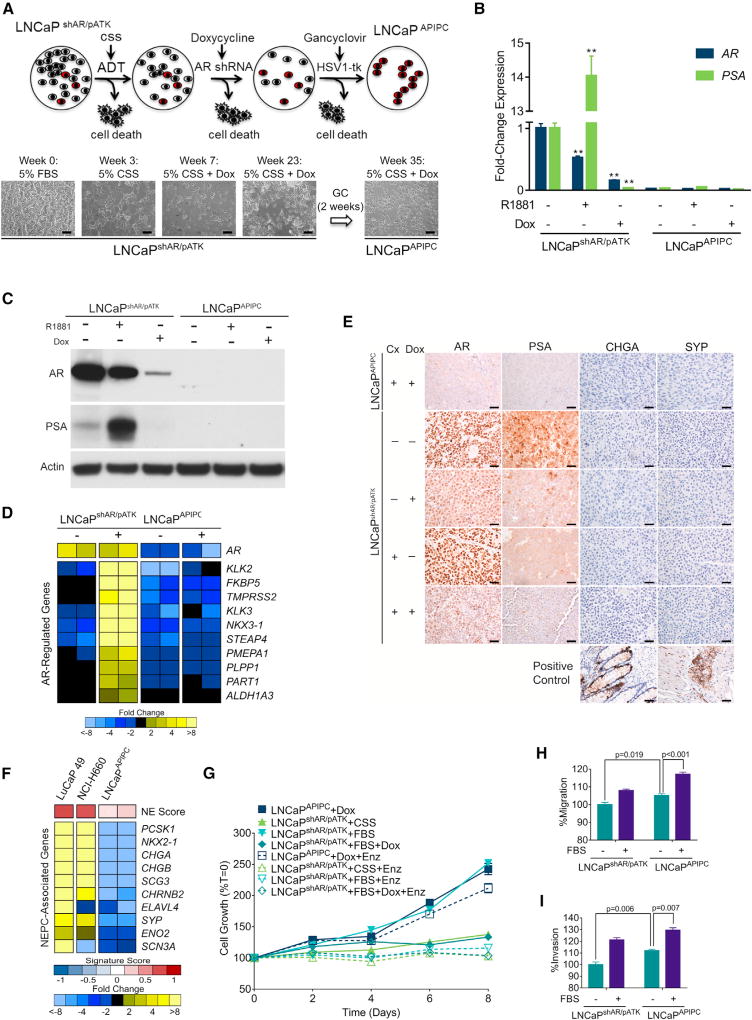
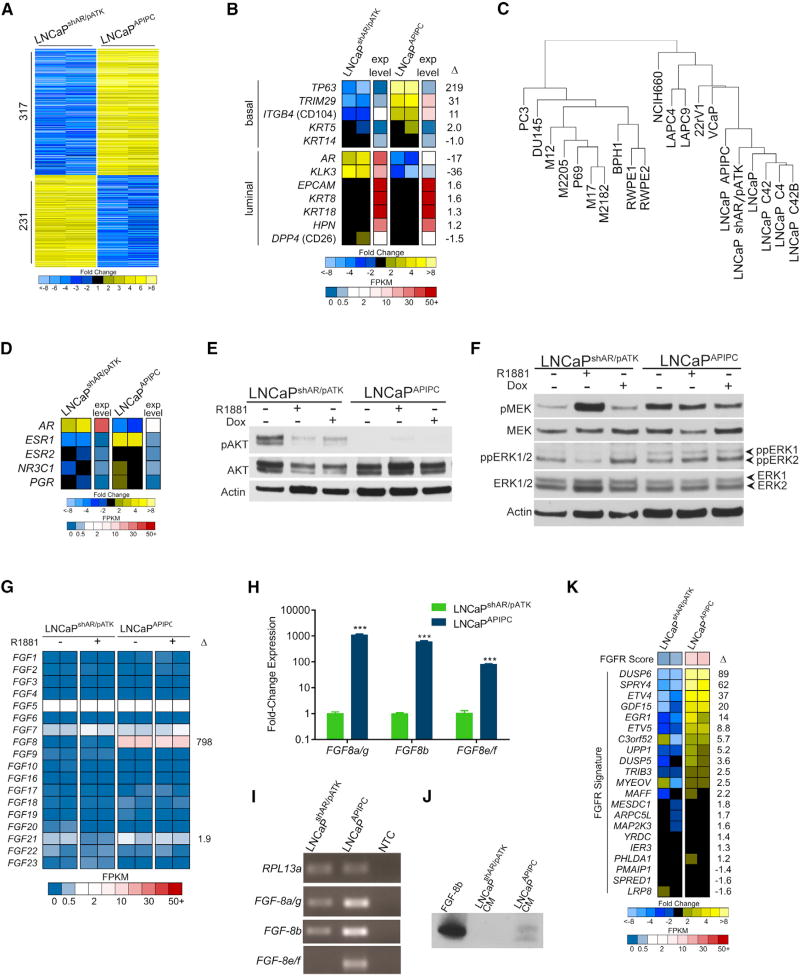
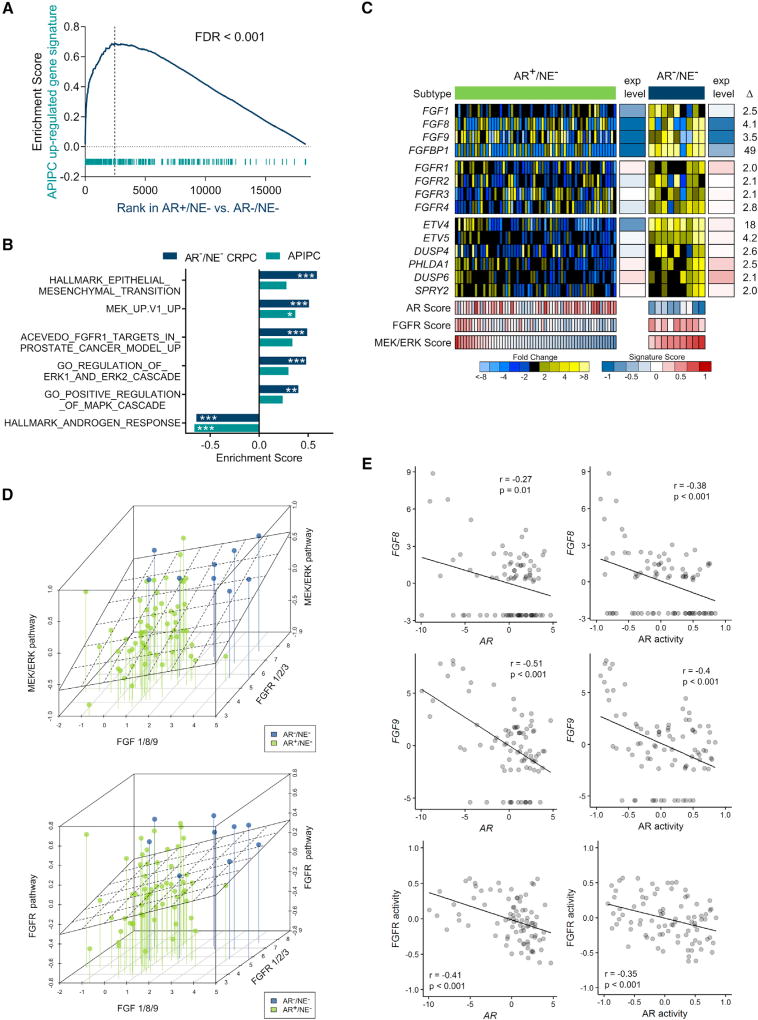
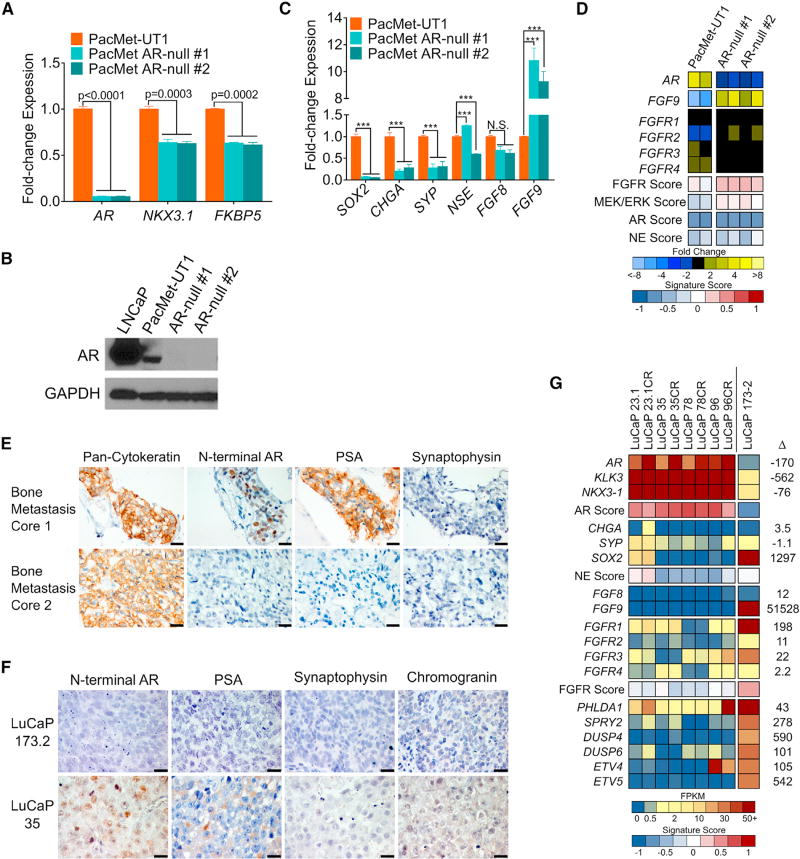
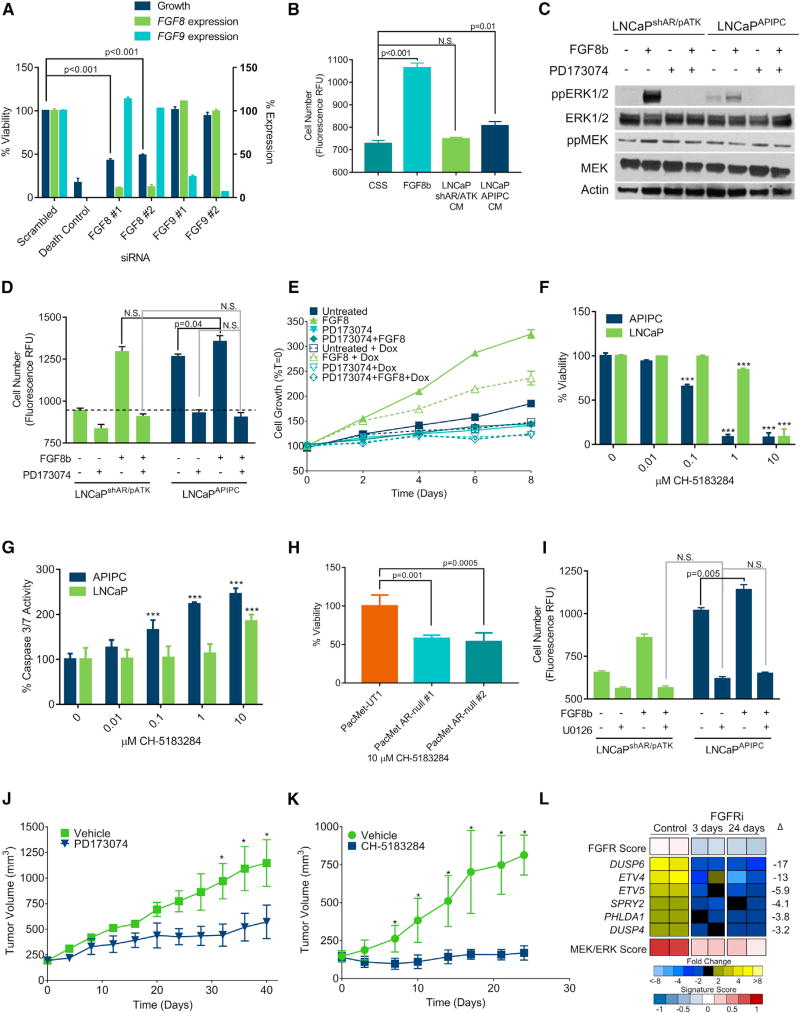
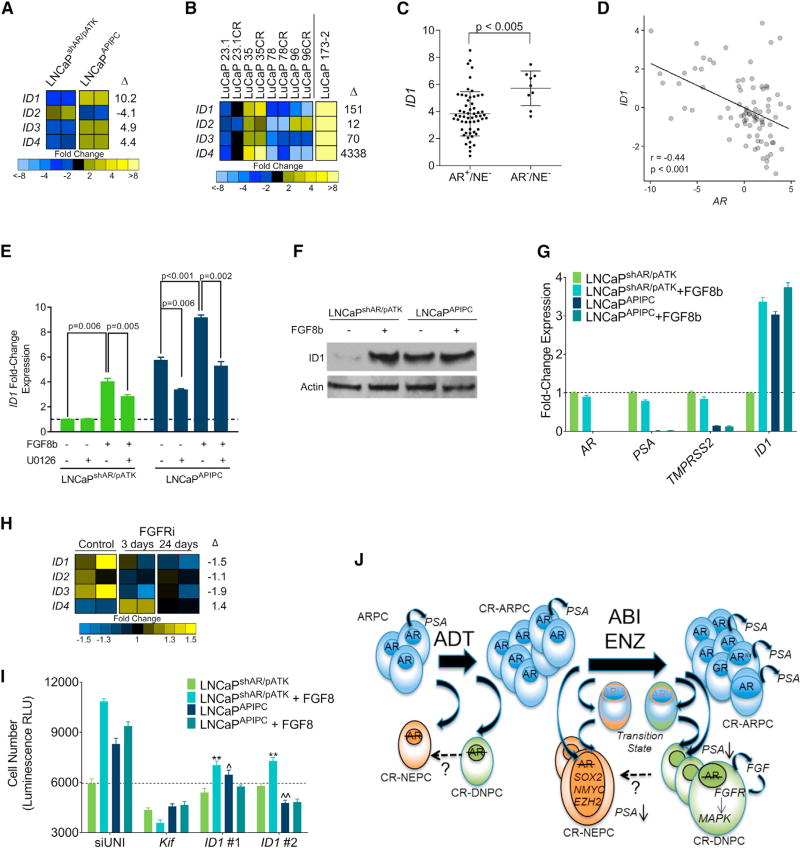
Androgen receptor (AR) signaling is a distinctive feature of prostate carcinoma (PC) and represents the major therapeutic target for treating metastatic prostate cancer (mPC). Though highly effective, AR antagonism can produce tumors that bypass a functional requirement for AR, often through neuroendocrine (NE) transdifferentiation. Through the molecular assessment of mPCs over two decades, we find a phenotypic shift has occurred in mPC with the emergence of an AR-null NE-null phenotype. These "double-negative" PCs are notable for elevated FGF and MAPK pathway activity, which can bypass AR dependence. Pharmacological inhibitors of MAPK or FGFR repressed the growth of double-negative PCs in vitro and in vivo. Our results indicate that FGF/MAPK blockade may be particularly efficacious against mPCs with an AR-null phenotype.

Keywords: FGF; ID1; androgen-pathway independence; castration-resistant prostate cancer; neuroendocrine.


Figures

Figure 1
Figure 1. Molecular Features of AR-Null Neuroendocrine-Null Prostate Cancer
(A) The frequency of AR-active prostate cancers (ARPC), neuroendocrine prostate cancers (NEPC), and double-negative AR-null/neuroendocrine-null prostate cancers (DNPC) in men with metastatic CRPC evaluated in consecutive tissue acquisition necropsies from 1998 to 2016. Numbers of tumors and patients in each cohort is shown. (B) Representative immunohistochemical stains for AR, PSA, synaptophysin and chromogranin used to classify metastases as ARPC, NEPC, or DNPC. Scale bars, 20 µm. (C) RNA sequencing-based measurements of transcripts comprising AR-regulated genes and neuroendocrine phenotype-associated genes in metastatic tumors from men with CRPC. Signature scores are shown above each gene set. Expression profile of one representative tumor per patient is shown, (AR+/NE, n = 35; AR/NE+, n = 4; AR/NE, n = 5.) (D) Differentially expressed genes in ARPC compared with DNPC (5-fold difference; q value <0.0001). Transcript abundance was determined by RNA sequencing and analyzed for differential expression using the Bioconductor edgeR software (ARPC, n = 58 tumors from 35 men; DNPC, n = 9 tumors from 5 men). (E) The frequency of recurrent genomic aberrations in the CRPC subtypes of AR+/NE (ARPC), AR/NE+ (NEPC), and AR/NE (DNPC) determined by aCGH and exome sequencing. Status of individual tumors and percentage altered in each group is shown, with numbers of patients (P) and tumors (T) below the plot. (F) Frequency of copy-number alterations (CNAs) determined by genome-wide array CGH. Copy-number gains and losses in ARPC (blue), DNPC (red), and shared (purple). Three genes (HNMT, GPR87, and STARD5) were significant by two-tailed Fisher’s exact tests comparing the proportion of high copy gains or homozygous losses between the groups (p < 0.05) and also exhibited concordant differential mRNA expression by two-sample t test (p < 0.05). (DNPC, n = 8 tumors from 8 individuals; ARPC, n = 118 tumors from 52 individuals). See also Figure S1.
Figure 2
Figure 2. Characterization of a Model of AR Program-Independent Prostate Cancer
(A) LNCaP cells with a doxycycline (Dox)-inducible shRNA targeting the AR (shAR) and an androgen-driven thymidine kinase gene (pATK) were starved of androgens (ADT) and treated with Dox to induce the AR-directed shRNA, then treated with ganciclovir to eliminate cells with AR-driven thymidine kinase expression. Scale bars, 10 µm. (B) qRT-PCR analysis of AR and PSA expression in LNCaPshAR/pATK and LNCaPAPIPC with 1 nM R1881 or 1 µg/mL Dox treatment. Significance was determined by Student’s t test and data are presented as mean ± SEM (n = 4 replicates per data point); **p < 0.01. (C) AR and PSA immunoblots of cell lysates from LNCaPshAR/pATK and LNCaPAPIPC cultured in androgen-deprived conditions and treated with or without R1881 and with or without Dox. (D) Quantitation of AR-regulated transcripts following treatment with the synthetic androgen R1881 (+) in parental LNCaPshAR/pATK and LNCaPAPIPC cells. Measurements were made by RNA sequencing (n = 2 biological replicates per group). (E) Immunohistochemical analysis of AR, PSA, CHGA, and SYP in parental LNCaPshAR/pATK and LNCaPAPIPC xenografts. Cx, castration; Dox, doxycycline. Scale bars, 10 µm. (F) Expression of neuroendocrine-associated transcripts in the NEPC LuCaP49 PDX model, NEPC NCI-H660 cell line, and LNCaPAPIPC cells. Measurements were made by RNA sequencing (RNA-seq) (n = 2 biological replicates of LNCaPAPIPC cells, 1 each of LuCaP49 and NCI-H660). (G) LNCaPAPIPC grown in androgen- and AR-depleted conditions were treated with vehicle (DMSO) or 5 µM enzalutamide (ENZ). Growth was compared with parental LNCaPshAR/pATK cells in charcoal stripped serum (CSS), fetal bovine serum (FBS), or FBS + 1 µg/mL Dox ± ENZ. Solid lines, with DMSO vehicle; dotted lines, with ENZ. All values are normalized to day 0. Data are presented as mean ± SEM (n = 5 per data point). (H and I) Transwell migration (H) and invasion assays (I) of LNCaPshAR/pATK and LNCaPAPIPC at baseline (no FBS gradient) and in response to a serum (FBS) gradient. Significance was determined using Student’s t test and data are presented as mean ± SEM (n = 4). See also Figure S2.
Figure 3
Figure 3. Assessments of AKT, MAPK, and FGF Pathway Activity in the LNCaPAPIPC Model of DNPC
(A) Genome-wide assessment of transcripts differentially expressed between LNCaPshAR/pATK and LNCaPAPIPC cells as measured by RNA-seq. Shown are 548 genes with q values of <0.001 and fold changes of ≥10 (n = 2 biological replicates per group). (B) Measurements of luminal and basal cell gene expression in LNCaPAPIPC cells. Relative ratios of RNA-seq transcript abundances are shown, along with mean FPKM (fragments per kilobase of transcript per million mapped reads) values (n = 2 biological replicates per group). (C) Unsupervised cluster analysis of gene expression profiles across prostate cancer cell lines associates LNCaPAPIPC cells with LNCaP cells and sublines. One replicate of each cell line used to cluster RNA-seq profiles of the top 1,000 most variable genes. (D) Expression of nuclear hormone receptors determined by RNA-seq of LNCaPshAR/pATK and LNCaPAPIPC cells. Relative ratios of RNA-seq transcript abundances are shown, along with mean FPKM values. Two independent biological replicates were sequenced. (E) PI3K pathway signaling was assessed by probing LNCaPAPIPC and LNCaPshAR/pATK cell lysates with antibodies to AKT and phosphorylated AKT. (F) MAPK pathway signaling was assessed by probing LNCaPAPIPC and LNCaPshAR/pATK cell lysates with antibodies to MEK, phosphorylated MEK, ERK1/2, and dually phosphorylated ERK1/2. (G) Levels of transcripts encoding FGFs were assessed in LNCaPshAR/pATK and LNCaPAPIPC cells by RNA-seq with or without R1881 androgen treatment. Two replicates of each line and treatment were measured, and fold difference between LNCaPshAR/pATK and LNCaPAPIPC cells is shown for FGF8 and FGF21. (H) Transcript levels of FGF8 mRNAs were measured by qRT-PCR in LNCaPshAR/pATK and LNCaPAPIPC. Significance was determined by Student’s t test and data are presented as mean ± SEM (n = 3 replicates per data point). ***p < 0.00001. (I) qRT-PCR reaction products, visualized by agarose gel electrophoresis, confirms single-band amplification by each isoform-specific primer pair. (J) Assessment of FGF8b protein in conditioned medium (CM) from LNCaPshAR/pATK and LNCaPAPIPC by immunoblotting with an FGF8b–specific antibody. (K) Expression of genes associated with FGFR pathway activity measured by RNA-seq of LNCaPshAR/pATK and LNCaPAPIPC cells. Two independent biological replicates were sequenced. See also Figures S3 and S4.
Figure 4
Figure 4. Assessments of FGF and MAPK Activity in Metastatic CRPC
(A) Analyses of transcripts differentially expressed between LNCaPshAR/pATK and LNCaPAPIPC in DNPC and ARPC metastases (FDR < 0.001, pre-ranked GSEA). (B) GSEA demonstrates significant positive associations with FGF, MAPK, MEK/ERK, and EMT pathways and negative enrichment for AR response in DNPC metastases (***FDR < 0.0005, **FDR < 0.005, *FDR < 0.05, pre-ranked GSEA). (C) Expression of FGF ligands, FGF receptors, and genes comprising an MEK/ERK activity signature. Relative ratios of RNA-seq transcript abundances are shown, along with mean FPKM values and signature scores (AR+/NE, n = 58 tumors from 35 men; AR/NE, n = 9 tumors from 5 men). (D) Plot of CRPC metastasis triangulated by the highest transcript level of FGF1, 8, or 9 (x axis), MEK/ERK pathway activity score or FGFR pathway activity score (y axis), and highest transcript level of FGFR1, 2, or 3 (z axis). Lines anchor MEK/ERK activity to lowest level to assist in visualizing activity on the y axis. A linear regression analysis of pathway score versus ligands and receptors is plotted as a plane (AR+/NE, n = 58 tumors from 35 men; AR/NE, n = 9 tumors from 5 men). (E) Correlation of FGF8 and FGF9 transcript levels and FGFR pathway activity and AR activity scores assessed in 85 CRPC metastases from 50 men by RNA-seq. Pearson’s correlation coefficient and p value are indicated on each plot.
Figure 5
Figure 5. FGF Pathway and MAPK Activity in Cell Line and PDX Models of DNPC
(A) Quantitation of the indicated transcripts by qRT-PCR in parental PacMet-UT1 cells and two independent PacMet-UT1 clones propagated after CRISPR/Cas9-mediated AR deletion. (B) Western immunoblot of AR protein in the indicated cell lines. (C) Quantitation of the indicated transcripts by qRT-PCR in the indicated cell lines. ***p < 0.0001. N.S., not significant. (D) Expression of genes reflecting the activity of AR, neuroendocrine (NE), FGFR, and MAPK signaling in parental PacMet-UT1 cells and AR-null sublines. Measurements were derived from RNA-seq (n = 2 biological replicates per group). (E) Cytokeratin, AR, PSA, and synaptophysin IHC in two independent rib metastases obtained from a patient with mCRPC. Scale bars, 20 µm. (F) AR, PSA, synaptophysin, and chromogranin IHC in the LuCaP173.2 PDX model derived from rib metastasis core 2 (E) with comparisons with the AR-positive LuCaP35 PDX line. Scale bars, 20 µm. (G) Expression of genes comprising the AR program, neuroendocrine (NE) program, and FGFR program in AR-positive castration-sensitive and castration-resistant (CR) PDX models (LuCaP23.1, LuCaP35, LuCaP78, and LuCaP96) and the AR-null, NE-null LuCaP173.2 PDX line. Measurements were derived from RNA-seq (n = one tumor from each LuCaP line.). For (A) and (C), significance was determined by Student’s t test and data are presented as mean ± SEM (n = 3 replicates per data point). See also Figure S5.
Figure 6
Figure 6. FGF Activates MAPK Signaling and Bypasses a Requirement for AR Activity in Promoting Prostate Cancer Growth
(A) Quantitation of cell viability and gene expression 96 hr after transfecting LNCaPAPIPC cells with siRNA pools specific for the indicated target. (B) LNCaPshAR/pATK were cultured for 4 daysin androgen-depleted medium and treated with 25ng/mL FGF8b, CM from LNCaPshAR/pATK, or LNCaPAPIPC cells. Cell number was determined using Cyquant. (C) LNCaPshAR/pATK and LNCaPAPIPC were treated with 1 µM PD173074 or vehicle and 25 ng/mL FGF8 or vehicle and cell lysates were evaluated for MAPK signaling via immunoblotting for ppERK1/2. (D) LNCaPshAR/pATK and LNCaPAPIPC were cultured in androgen-deprived conditions and treated with ±25 ng/mL FGF8b and ±1 µM PD173074. N.S., not significant. Dashed line indicates unstimulated LNCaPshAR/pATK (n = 3 replicates per data point). (E) LNCaPshAR/pATK cells were cultured in androgen-depleted medium ±25 ng/mL FGF8, ±1 µM PD173074, and ±1 µg/mL Dox. Solid lines, no Dox; dotted lines, with Dox. Cell number was determined using Cyquant, and values were normalized to day 0. (F and G) LNCaP and LNCaPAPIPC were treated with the indicated concentrations of CH-5183284, and cell viability (F) and apoptosis (G) were measured after 72 hr by ApoLive Glo (n = 3 replicates per data point). ***p < 0.001. (H) PacMet-UT1 cells and AR-null derivatives were treated with 10 µM CH-5183284, and cell viability was determined by CellTiter Glo after 72 hr. (I) LNCaPshAR/pATK and LNCaPAPIPC cultured in androgen-depleted conditions were treated with FGF8b or vehicle with or without 25 µM U0126 or vehicle. Cell number was determined using Cyquant. (J) LNCaPAPIPC cells were inoculated subcutaneously in castrate SCID mice receiving Dox-supplemented feed. When tumors reached 200 mm3 in size, treatment was initiated with the FGFR antagonist PD173074 or vehicle control. Tumor volumes were measured every 2 days (n = 5). *p < 0.01. (K) LuCaP173.2 tumors were implanted subcutaneously in castrate SCID mice. When tumors reached 200 mm3 in size, treatment was initiated with the FGFR antagonist CH-5183284 or vehicle control. Tumor volumes were measured every 2 days (n = 15). *p < 0.01. (L) Quantitation of FGFR and MEK/ERK pathway gene expression in LuCaP173.2 tumors treated with vehicle or CH-5183284 sampled 3 days or 24 days after the initiation of treatment. Transcripts were quantitated by RNA-seq of two independent tumors. Significance was determined by Student’s t test and data are presented as mean ± SEM. For (A), (B), and (D) to (I), n = 3 replicates per data point. See also Figure S6.
Figure 7
Figure 7. FGF8 Induces ID1 Expression and Castration-Resistant Growth via MAPK Pathway Activation
(A) Transcript levels of ID1-4 in LNCaPshAR/pATK and LNCaPAPIPC cells determined by RNA-seq in two independent cultures. Fold differences of gene expression levels between LNCaPshAR/pATK and LNCaPAPIPC cells are shown. (B) Expression of ID1-4 in AR-positive castration-sensitive and castration-resistant (CR) PDX models (LuCaP23.1, LuCaP35, LuCaP78, and LuCaP96) and the AR-null, NE-null LuCaP173.2 PDX line. Measurements were derived from RNA-seq (n = one tumor from each LuCaP line). Fold differences of gene expression between AR-positive and AR-negative groups are shown. (C) Transcript levels of ID1 in AR+/NE and AR/NE CRPC metastases determined by RNA-seq transcript quantitation. Log2 counts per million (CPM) mapped reads with mean ± SD are plotted. Groups were compared by unpaired, two-tailed t test (AR+/NE, n = 58 tumors from 35 men; AR/NE, n = 9 tumors from 5 men). (D) Association of ID1 and AR transcripts in CRPC metastases. Each data point represents an individual metastasis (n = 85 tumors from 50 men). Transcript levels were quantitated by RNA-seq. Pearson’s correlation coefficient r = −0.39; p < 0.001. (E) ID1 transcripts quantitated by qRT-PCR in LNCaPshAR/pATK and LNCaPAPIPC treated with 25 ng/mL FGF8 or vehicle and the MEK inhibitor U0126 or vehicle. qRT-PCR values were normalized to RPL13a expression, and compared with unstimulated LNCaPshAR/pATK. (F) Immunoblot of cell lysates collected from LNCaPshAR/pATK and LNCaPAPIPC treated with 25 ng/mL FGF8 or vehicle probed with anti-ID1 antibody. (G) LNCaPshAR/pATK and LNCaPAPIPC were cultured under androgen-depleted conditions and treated with vehicle (PBS) or 25 ng/mL FGF8. ID1, AR, PSA, and TMPRSS2 transcripts were quantitated by qRT-PCR, normalized to RPL13a expression, and compared with unstimulated LNCaPshAR/pATK. (H) Quantitation of ID1-4 in LuCaP173.2 tumors treated with vehicle or CH-5183284 sampled 3 days or 24 days after the initiation of treatment. Transcripts were quantitated by RNA-seq of two independent tumors. (I) LNCaPshAR/pATK and LNCaPAPIPC were cultured in androgen-depleted medium and transfected with siRNA specific for target genes. Cells were treated with 25 ng/mL FGF8 or vehicle. siUNI, non-targeting control siRNA; Kif11, equimolar mixture of three siRNAs targeting Kif11 and a positive control for transfection efficiency; ID1 #1 and ID1 #2 are siRNAs targeting ID1. Relative cellular number was measured with the Cell Titer Glo luminescence assay. (J) Schematic depicting the cellular differentiation states and underlying molecular drivers of cell survival and growth following AR pathway-directed therapy. ADT, androgen deprivation therapy; ABI, abiraterone; ENZ, enzalutamide; CR-ARPC, castration-resistant AR program active PC; CR-NEPC, castration-resistant NE program active PC; CR-DNPC, castration-resistant PC without AR or NE program activity. For (E), (G), and (I), significance was determined by Student’s t test and data are presented as mean ± SEM (n = 3–5 replicates per data point). See also Figure S7.

Comment in

References

    1. Acevedo VD, Gangula RD, Freeman KW, Li R, Zhang Y, Wang F, Ayala GE, Peterson LE, Ittmann M, Spencer DM. Inducible FGFR-1 activation leads to irreversible prostate adenocarcinoma and an epithelial-to-mesenchymal transition. Cancer Cell. 2007;12:559–571. - PubMed
    1. Aihara M, Lebovitz RM, Wheeler TM, Kinner BM, Ohori M, Scardino PT. Prostate specific antigen and Gleason grade: an immunohistochemical study of prostate cancer. J. Urol. 1994;151:1558–1564. - PubMed
    1. Aparicio A, Tzelepi V, Araujo JC, Guo CC, Liang S, Troncoso P, Logothetis CJ, Navone NM, Maity SN. Neuroendocrine prostate cancer xenografts with large-cell and small-cell features derived from a single patient’s tumor: morphological, immunohistochemical, and gene expression profiles. Prostate. 2011;71:846–856. - PMC - PubMed
    1. Arora VK, Schenkein E, Murali R, Subudhi SK, Wongvipat J, Balbas MD, Shah N, Cai L, Efstathiou E, Logothetis C, et al. Glucocorticoid receptor confers resistance to antiandrogens by bypassing androgen receptor blockade. Cell. 2013;155:1309–1322. - PMC - PubMed
    1. Aytes A, Mitrofanova A, Kinkade CW, Lefebvre C, Lei M, Phelan V, LeKaye HC, Koutcher JA, Cardiff RD, Califano A, et al. ETV4 promotes metastasis in response to activation of PI3-kinase and Ras signaling in a mouse model of advanced prostate cancer. Proc. Natl. Acad. Sci. USA. 2013;110:E3506–E3515. - PMC - PubMed

Publication types

MeSH terms

Substances