. 2017 Oct 9;32(4):506-519.e5.
doi: 10.1016/j.ccell.2017.09.004.

Integrating Proteomics and Transcriptomics for Systematic Combinatorial Chimeric Antigen Receptor Therapy of AML

Affiliations

Integrating Proteomics and Transcriptomics for Systematic Combinatorial Chimeric Antigen Receptor Therapy of AML

Fabiana Perna et al. Cancer Cell. .

Abstract

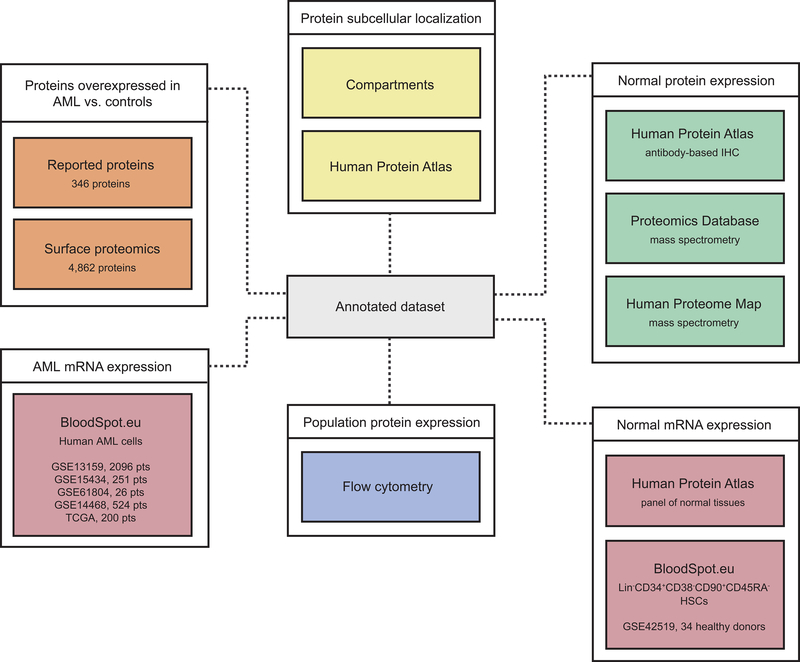
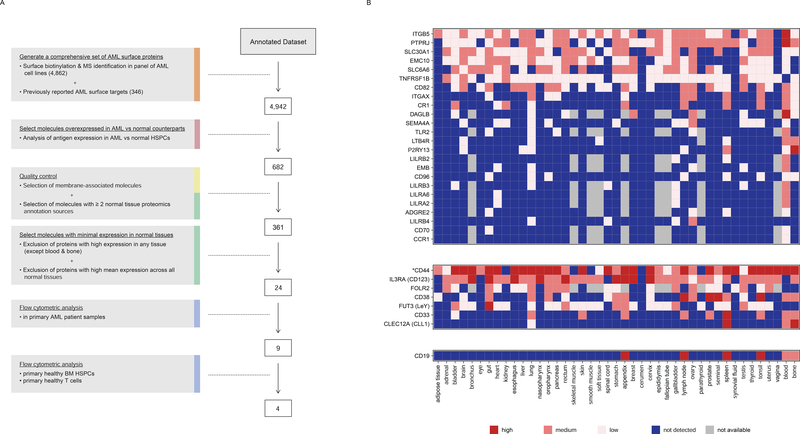
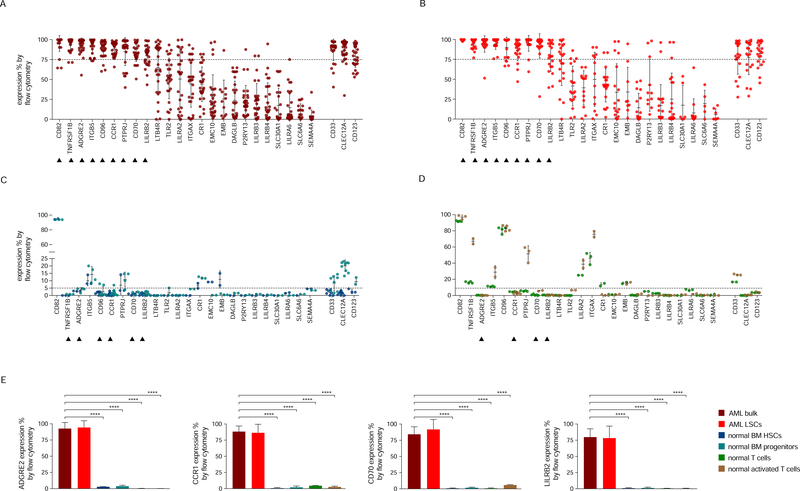
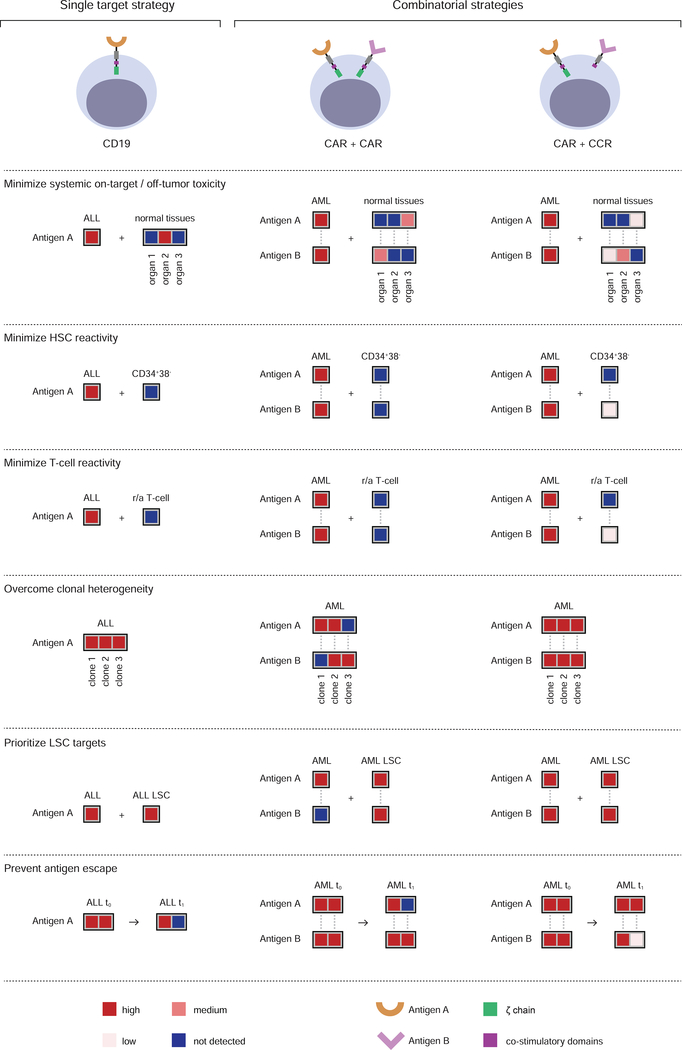
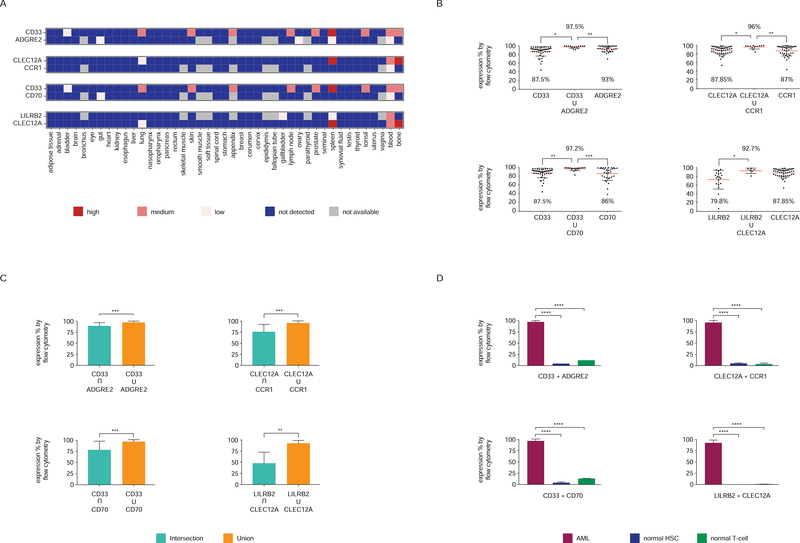
Chimeric antigen receptor (CAR) therapy targeting CD19 has yielded remarkable outcomes in patients with acute lymphoblastic leukemia. To identify potential CAR targets in acute myeloid leukemia (AML), we probed the AML surfaceome for overexpressed molecules with tolerable systemic expression. We integrated large transcriptomics and proteomics datasets from malignant and normal tissues, and developed an algorithm to identify potential targets expressed in leukemia stem cells, but not in normal CD34+CD38- hematopoietic cells, T cells, or vital tissues. As these investigations did not uncover candidate targets with a profile as favorable as CD19, we developed a generalizable combinatorial targeting strategy fulfilling stringent efficacy and safety criteria. Our findings indicate that several target pairings hold great promise for CAR therapy of AML.

Keywords: CAR T cell; acute myeloid leukemia (AML); algorithm; combinatorial strategies; high-throughput annotation; immunotherapy; leukemia; proteomics; surfaceome; target discovery.


Figures

Figure 1.
Figure 1.. Generation of a comprehensive dataset of AML surface molecule annotations
Orange boxes represent the information derived from proteomics studies in AML. Yellow boxes represent data sources providing information on subcellular localization. Green boxes represent three distinct published repositories of protein expression in several normal tissues and the platforms in which those data was generated. Pink boxes represent RNA data from AML (left) or normal cells (right). The blue box represents expression data obtained by flow cytometry in multiple distinct subsets of hematopoietic cells. The grey box at the center represents the combined annotation repository. See also Figure S1 and Table S1.
Figure 2.
Figure 2.. Algorithm for candidate AML CAR target discovery
(A) The algorithm shows the steps used to identify surface molecules overexpressed in AML relative to normal HSPCs, the quality control, the assessment of minimal expression in a large panel of normal tissues, and the flow cytometric analyses. Step descriptions are color-coded to match data sources in Figure 1. The number of molecules remaining after each analytical step is indicated to the right of each box. (B) Expression profile of 24 selected AML target candidates (top panel), previously reported AML CAR targets (middle panel), and CD19 (bottom panel) in normal tissues. *Aggregate of CD44 isoforms (only PDB distinguishes between CD44 and CD44v6). See also Figure S2.
Figure 3.
Figure 3.. Flow cytometric analyses in primary AML samples and normal hematopoietic cells.
(A-D) Expression (% positive) of the 24 candidate antigens and the three CAR targets in current clinical investigation (most right three) in bulk AML population (A), in leukemic CD34+CD38 cells (B), in normal BM CD34+CD38CD45RACD90+ HSCs (blue) and CD34+CD38+ progenitor cells (light blue) (C), or in freshly purified (green) or activated (brown) normal CD3+ peripheral blood T cells (D). Data are represented as mean ± standard deviation. (E) Summary of expression levels (mean ± SEM) of four top targets in indicated cell populations. ****, p value <0.0001 (Student’s t-test). See also Table S2.
Figure 4.
Figure 4.. Principles of combinatorial targeting for CAR therapy
The top panel represents single (CD19, left) and combinatorial (CAR/CAR, middle and CAR/CCR, right) targeting approaches. The combinatorial strategies require that the paired targets (Antigen A and Antigen B) meet stringent criteria that we defined in 6 principles illustrate below. The top three address safety and the bottom three therapeutic efficacy. Heatmaps indicate the expression level for the respective antigens in different tissues (not detected, low, medium and high, color-coded as indicated in the last panel). To minimize systemic on-target/off-tumor toxicity, an ideal pair should not present overlapping expression in normal tissues. Albeit suboptimal, some low or moderate expression in normal tissues may be tolerable in the CAR/CAR approach, depending on the tissues in question. This criterion may be relaxed for the CCR target in the CAR/CCR approach. To minimize HSC toxicity, the expression of both paired targets should be very low in CD34+CD38 HSCs. To minimize T-cell reactivity, the expression of two targets in a pair should be very low in normal resting and activated (r/a) T cells. To overcome clonal heterogeneity, the combined targets should mark all tumor cells. The CAR/CCR approach requires pan-tumor expression of the CAR target. To prioritize leukemic stem cell targeting, both antigens should be expressed in LSCs, but not obligatorily in all leukemic cells for one of the antigens in the CAR/CAR approach. To prevent antigen-negative relapse, both antigens should be co-expressed in tumor cells as much as possible (t0 and t1 represent pre-treatment and relapse time points).
Figure 5.
Figure 5.. Paired expression of potential CAR targets in AML
(A) Co-expression of antigen pairs in normal tissues (see text for algorithm criteria). (B) Expression of each and both of indicated antigen pair in primary AML samples (% positive by flow cytometry). Data are represented as mean ± standard deviation. (C) Levels of co-expression (intersection) and additive expression (union) of antigen pairs in primary AML samples. Data are represented as mean ± standard deviation. (D) Additive expression of antigen pairs in AML cells (mean ± SEM) compared to normal BM HSCs and T cells. See also Figure S3.

References

    1. (2016). ADCs Show Promise in Leukemias. Cancer Discov 6, 939. - PubMed
    1. Adam Mark RT, Afrasiabi Cyrus and Wu Chunlei (2014).
    1. Alexandrov LB, Nik-Zainal S, Wedge DC, Aparicio SA, Behjati S, Biankin AV, Bignell GR, Bolli N, Borg A, Borresen-Dale AL, et al. (2013). Signatures of mutational processes in human cancer. Nature 500, 415–421. - PMC - PubMed
    1. Alvarez-Vallina L, and Hawkins RE (1996). Antigen-specific targeting of CD28-mediated T cell costimulation using chimeric single-chain antibody variable fragment-CD28 receptors. Eur J Immunol 26, 2304–2309. - PubMed
    1. Anderson MW, Zhao S, Ai WZ, Tibshirani R, Levy R, Lossos IS, and Natkunam Y (2010). C-C chemokine receptor 1 expression in human hematolymphoid neoplasia. Am J Clin Pathol 133, 473–483. - PMC - PubMed

Publication types