Review
. 2018 Apr:14:316-327.
doi: 10.1016/j.redox.2017.09.020. Epub 2017 Sep 29.

A review of the basics of mitochondrial bioenergetics, metabolism, and related signaling pathways in cancer cells: Therapeutic targeting of tumor mitochondria with lipophilic cationic compounds

Affiliations
Review

A review of the basics of mitochondrial bioenergetics, metabolism, and related signaling pathways in cancer cells: Therapeutic targeting of tumor mitochondria with lipophilic cationic compounds

Balaraman Kalyanaraman et al. Redox Biol. 2018 Apr.

Erratum in

Abstract

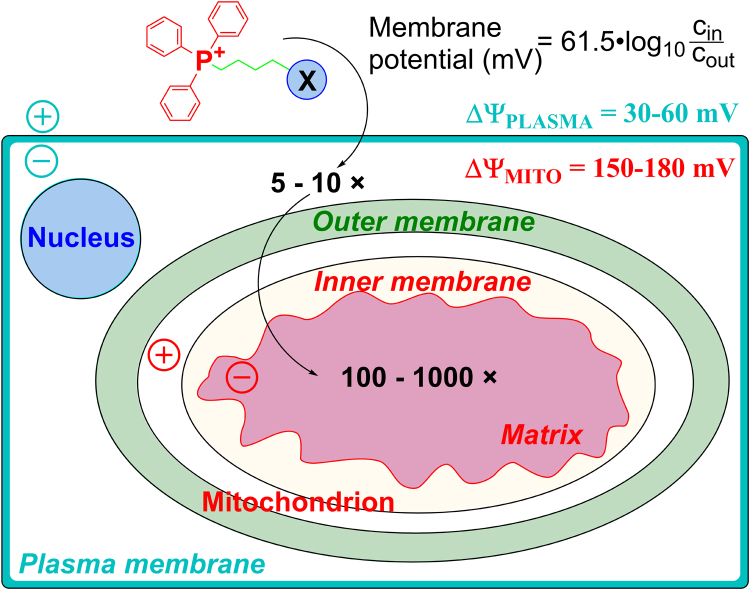
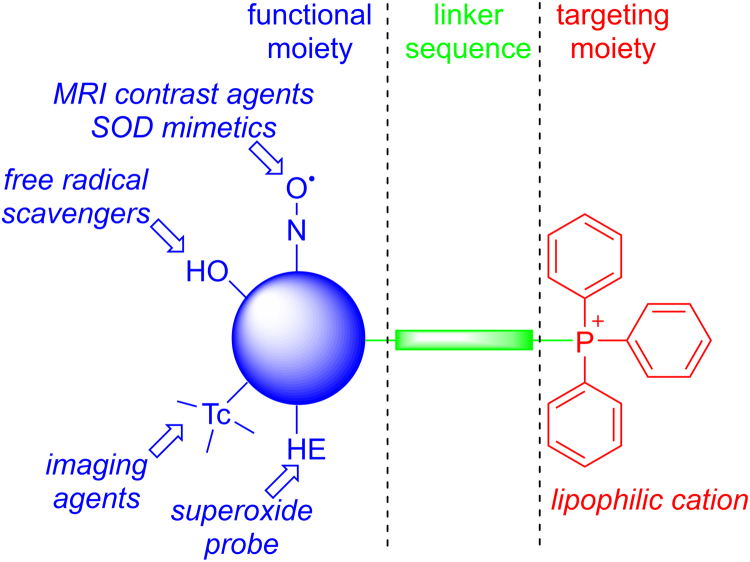
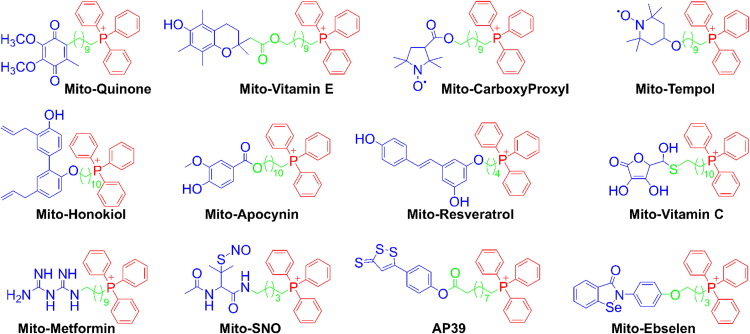
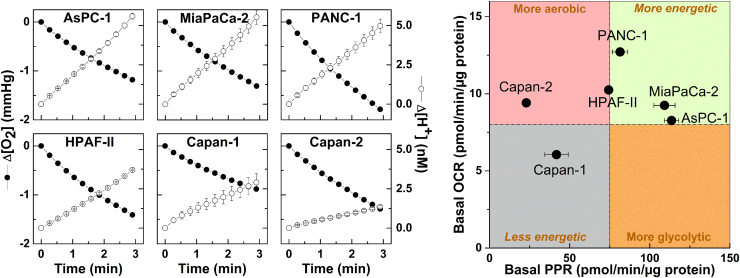
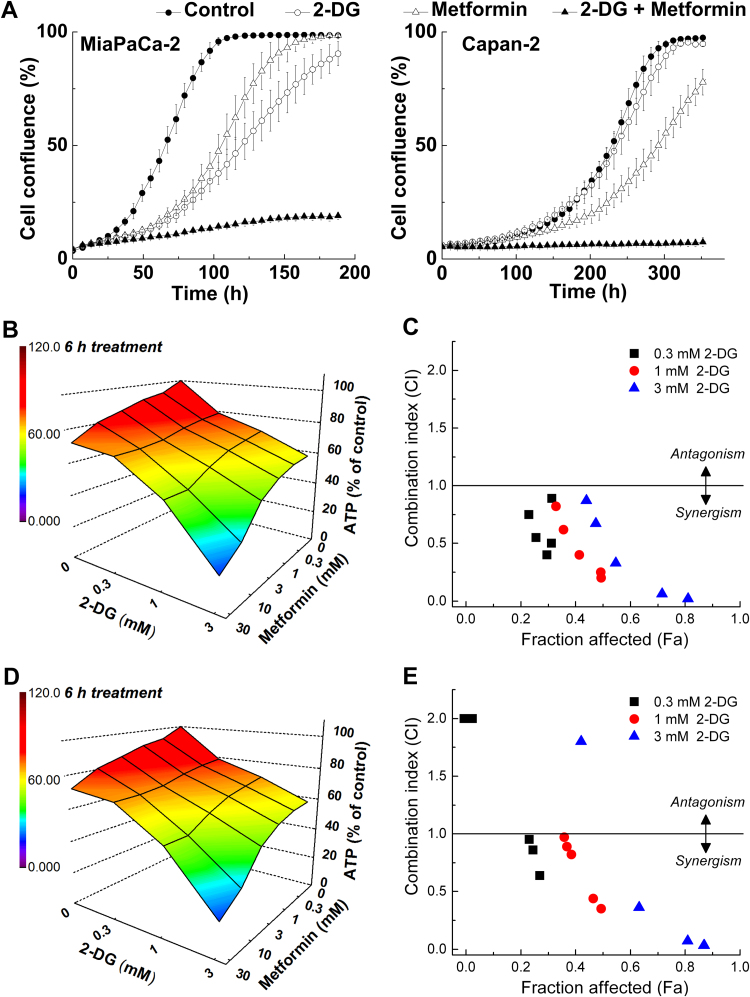
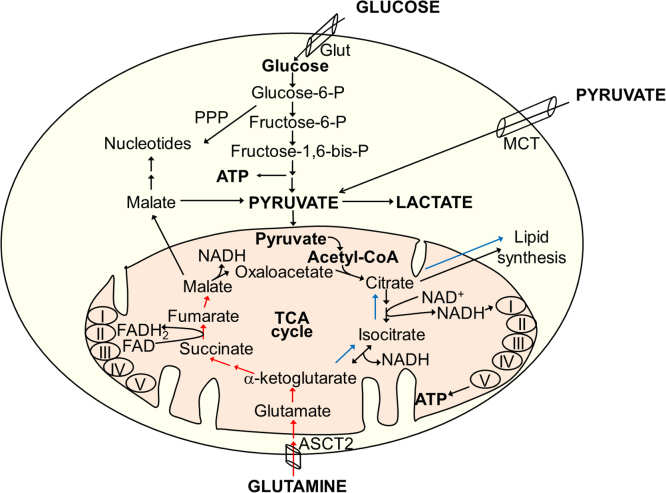
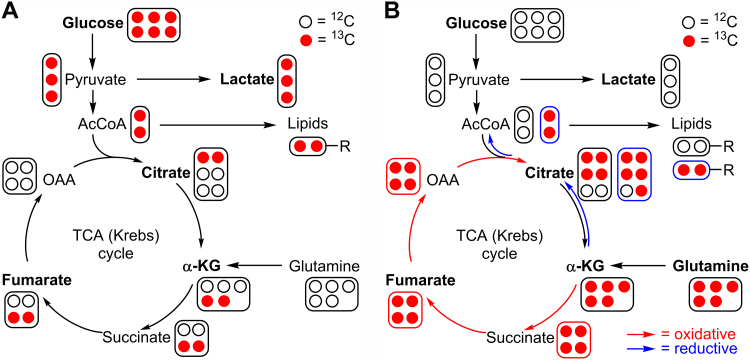
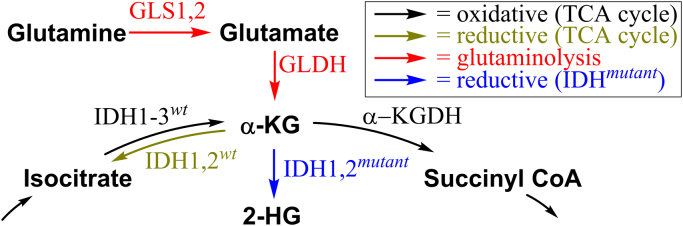
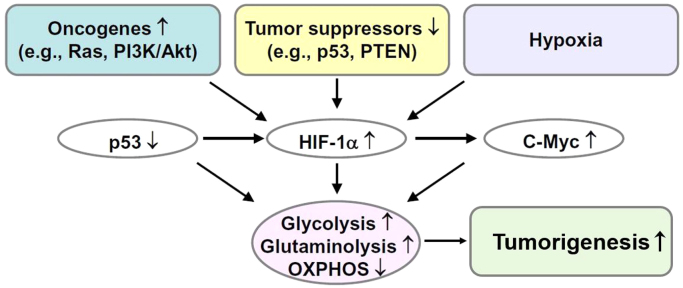
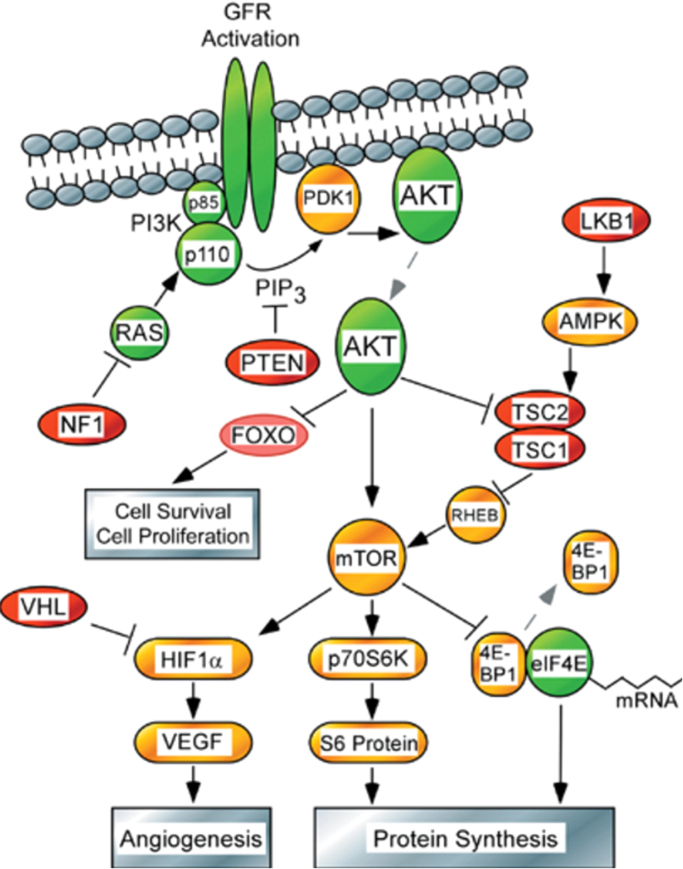
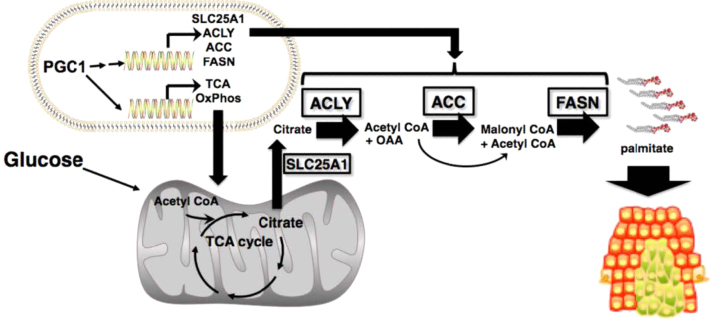
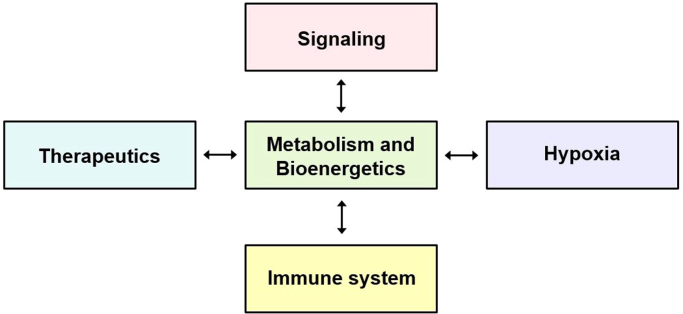
The present review is a sequel to the previous review on cancer metabolism published in this journal. This review focuses on the selective antiproliferative and cytotoxic effects of mitochondria-targeted therapeutics (MTTs) in cancer cells. Emerging research reveals a key role of mitochondrial respiration on tumor proliferation. Previously, a mitochondria-targeted nitroxide was shown to selectively inhibit colon cancer cell proliferation at submicromolar levels. This review is centered on the therapeutic use of MTTs and their bioenergetic profiling in cancer cells. Triphenylphosphonium cation conjugated to a parent molecule (e.g., vitamin-E or chromanol, ubiquinone, and metformin) via a linker alkyl chain is considered an MTT. MTTs selectively and potently inhibit proliferation of cancer cells and, in some cases, induce cytotoxicity. MTTs inhibit mitochondrial complex I activity and induce mitochondrial stress in cancer cells through generation of reactive oxygen species. MTTs in combination with glycolytic inhibitors synergistically inhibit tumor cell proliferation. This review discusses how signaling molecules traditionally linked to tumor cell proliferation affect tumor metabolism and bioenergetics (glycolysis, TCA cycle, and glutaminolysis).

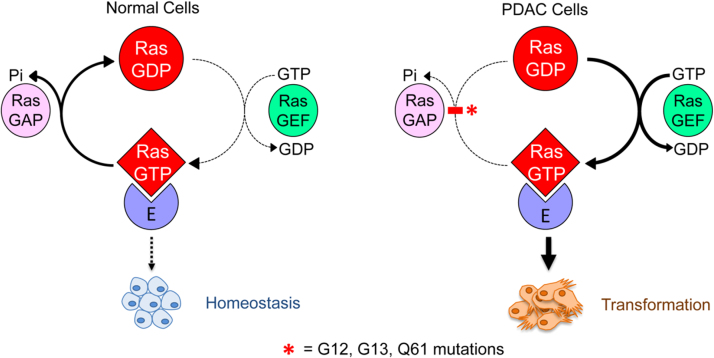
Keywords: Coenzyme Q(10); Extracellular acidification rate; Oxygen consumption rate; Pancreatic ductal adenocarcinoma; Triphenylphosphonium cation.


Figures

Fig. 1
Fig. 1
Cellular uptake of TPP+-linked compounds driven by plasma membrane and mitochondrial membrane potentials (Obtained and Reprinted with permission from Ref. . Copyright 2017 American Chemical Society.).
Fig. 2
Fig. 2
Anatomy of TPP+-based mitochondria-targeted agents (Obtained and Reprinted with permission from Ref. . Copyright 2017 American Chemical Society.). (For interpretation of the references to color in this figure legend, the reader is referred to the web version of this article)
Fig. 3
Fig. 3
Examples of the TPP+-conjugated compounds for their mitochondrial delivery. Color coding represents the three parts of the mitochondria-targeted molecules: functional moiety (blue), linker (green), and targeting moiety (red). (Obtained and Reprinted with permission from Ref. . Copyright 2017 American Chemical Society.). (For interpretation of the references to color in this figure legend, the reader is referred to the web version of this article)
Fig. 4
Fig. 4
Two-dimensional map of bioenergetics in pancreatic cancer cells. (left) Oxygen consumption (ΔO2) and proton production (ΔH+) traces in six pancreatic cancer cell lines as monitored with a Seahorse XF-96 Analyzer. The changes in O2 and H+ concentrations were normalized to 1 µg of protein. (right) Two-dimensional map of OCR and PPR measured in six pancreatic cancer cell lines. (Obtained from Ref. , Copyright © 2014, Rights Managed by Nature Publishing Group).
Fig. 5
Fig. 5
Inhibition of cell proliferation by 2-DG and metformin, and synergistic depletion of ATP by 2-DG and metformin in MiaPaCa-2 cells. (A) Effects of 2-DG and metformin alone and together, on cell proliferation. MiaPaCa-2 and Capan-2 cells were treated with 2-DG (0.5 mM in MiaPaCa-2, 1 mM in Capan-2 cells) or metformin (1 mM) alone and together. Cell proliferation was monitored in real time with the continuous presence of indicated treatments until the end of each experiment. The changes in cell confluence are used as a surrogate marker of cell proliferation. Data shown are the mean ± SD. (n = 6). (B–D) MiaPaCa-2 cells were treated with 2-DG (0.3–3 mM) or metformin (0.3–30 mM) independently and together for 6 h (B) or 24 h (D) and intracellular ATP levels were determined, normalized to total cellular protein amount, and expressed as percentage of untreated cells. A three-dimensional representation showing the concentration-dependent effects of 2-DG or metformin alone and together on intracellular ATP levels in MiaPaCa-2 cells. The combination index-fraction affected (CI-Fa) plots are shown (C,E). Fraction affected parameter is used as a measure of the drug(s) efficiency, with a value of zero indicating the lack of effect on intracellular ATP and the value of 1 indicating total depletion of intracellular ATP. (Obtained from Ref. , Copyright © 2014, Rights Managed by Nature Publishing Group).
Fig. 6
Fig. 6
Metabolic pathways of glucose and glutamine in cells. Red and blue arrows indicate oxidative and reductive pathways of α-KG metabolism. (For interpretation of the references to color in this figure, the reader is referred to the web version of this article)
Fig. 7
Fig. 7
Measuring glucose and glutamine metabolism by LC-MS-based stable isotope tracing. The labeling patterns for Krebs cycle intermediates are shown for one cycle only. (A) Pathways of 13C enrichment from 13C6-glucose. (B) Pathways of 13C enrichment from 13C5-glutamine in oxidative and reductive pathways. (For interpretation of the references to color in this figure, the reader is referred to the web version of this article)
Fig. 8
Fig. 8
Metabolism of α-KG in the presence of wild-type and mutated IDH enzymes.
Fig. 9
Fig. 9
Glycolytic metabolism and activation of signaling pathways.
Fig. 10
Fig. 10
Akt signaling and glycolysis. (Obtained from and Reprinted by permission from Macmillan Publishers Ltd: Ref. , copyright 2005). (For interpretation of the references to color in this figure, the reader is referred to the web version of this article)
Fig. 11
Fig. 11
PGC1α and oxidative phosphorylation. (Obtained from Ref. , Copyright © 2012, American Association for Cancer Research).
Fig. 12
Fig. 12
KRAS in normal and tumor cell metabolism. (Obtained from Ref. ; Reprinted from Trends in Biochemical Sciences, 39, Kristen L. Bryant, Joseph D. Mancias, Alec C. Kimmelman, Channing J. Der, KRAS: feeding pancreatic cancer proliferation, Pages No. 91–100, Copyright 2014, with permission from Elsevier).
Fig. 13
Fig. 13
The central role of metabolism and bioenergetics.

References

    1. Weinberg F., Hamanaka R., Wheaton W.W., Weinberg S., Joseph J., Lopez M., Kalyanaraman B., Mutlu G.M., Budinger G.R., Chandel N.S. Mitochondrial metabolism and ROS generation are essential for Kras-mediated tumorigenicity. Proc. Natl. Acad. Sci. USA. 2010;107(19):8788–8793. - PMC - PubMed
    1. Hsu P.P., Sabatini D.M. Cancer cell metabolism: Warburg and beyond. Cell. 2008;134(5):703–707. - PubMed
    1. Ward P.S., Thompson C.B. Metabolic reprogramming: a cancer hallmark even warburg did not anticipate. Cancer Cell. 2012;21(3):297–308. - PMC - PubMed
    1. Warburg O. On the origin of cancer cells. Science. 1956;123(3191):309–314. - PubMed
    1. Beckner M.E., Gobbel G.T., Abounader R., Burovic F., Agostino N.R., Laterra J., Pollack I.F. Glycolytic glioma cells with active glycogen synthase are sensitive to PTEN and inhibitors of PI3K and gluconeogenesis. Lab. Invest. 2005;85(12):1457–1470. - PubMed

Publication types

MeSH terms

Substances