. 2017 Oct 10;18(1):764.
doi: 10.1186/s12864-017-4151-2.

Lifestyle, gene gain and loss, and transcriptional remodeling cause divergence in the transcriptomes of Phytophthora infestans and Pythium ultimum during potato tuber colonization

Affiliations

Lifestyle, gene gain and loss, and transcriptional remodeling cause divergence in the transcriptomes of Phytophthora infestans and Pythium ultimum during potato tuber colonization

Audrey M V Ah-Fong et al. BMC Genomics. .

Abstract

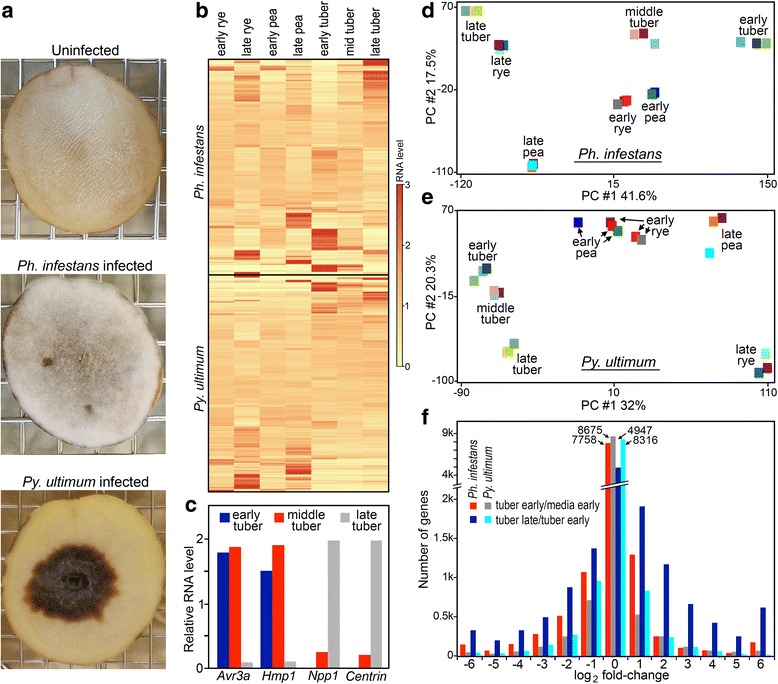
Background: How pathogen genomes evolve to support distinct lifestyles is not well-understood. The oomycete Phytophthora infestans, the potato blight agent, is a largely biotrophic pathogen that feeds from living host cells, which become necrotic only late in infection. The related oomycete Pythium ultimum grows saprophytically in soil and as a necrotroph in plants, causing massive tissue destruction. To learn what distinguishes their lifestyles, we compared their gene contents and expression patterns in media and a shared host, potato tuber.

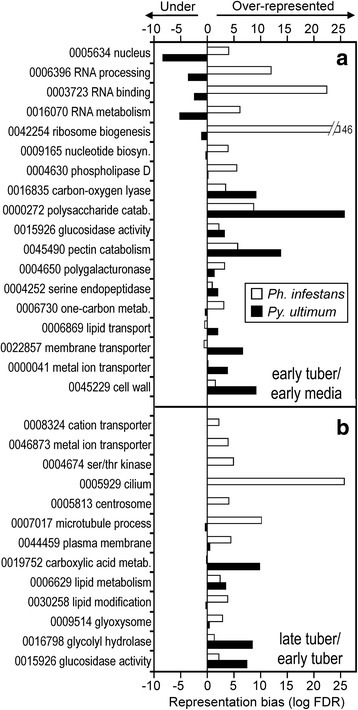
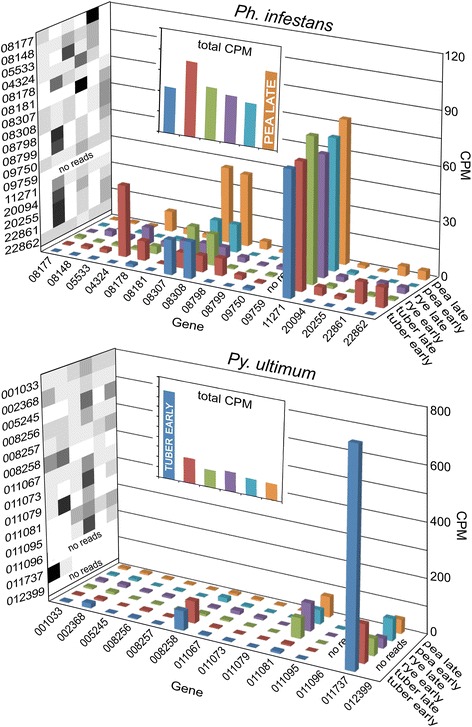
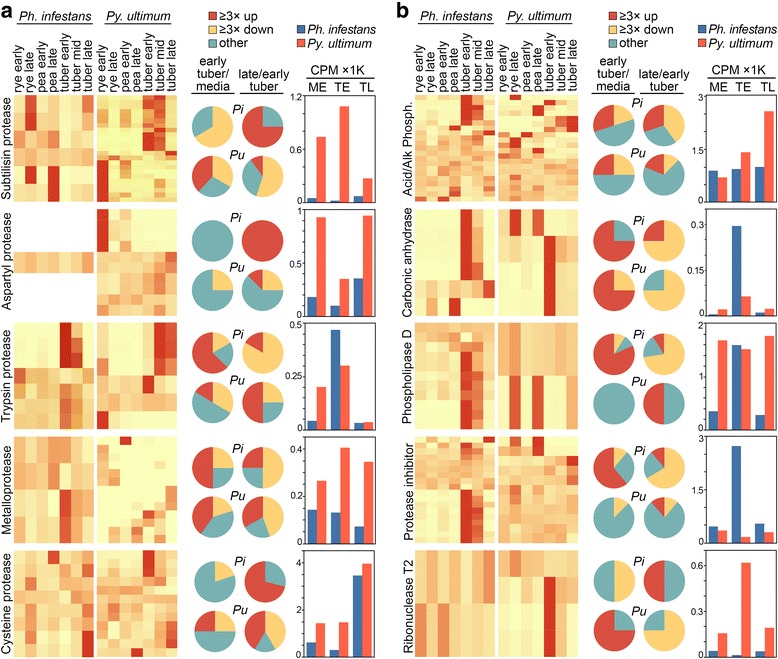
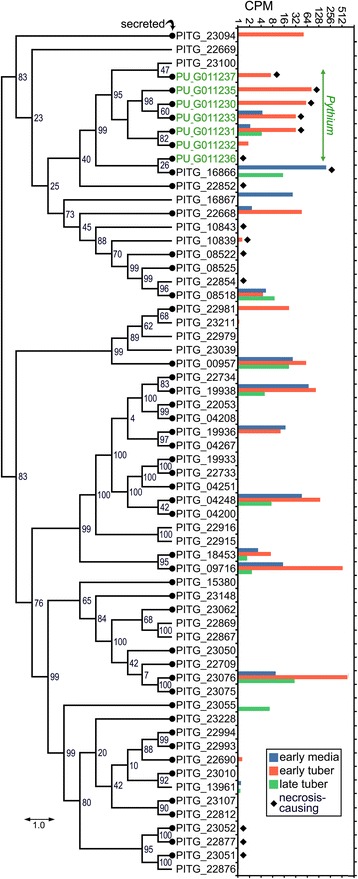
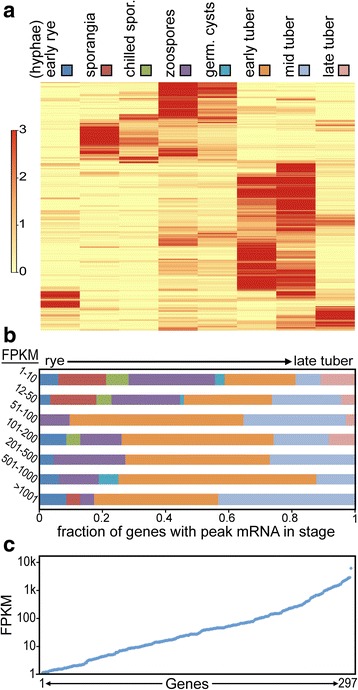
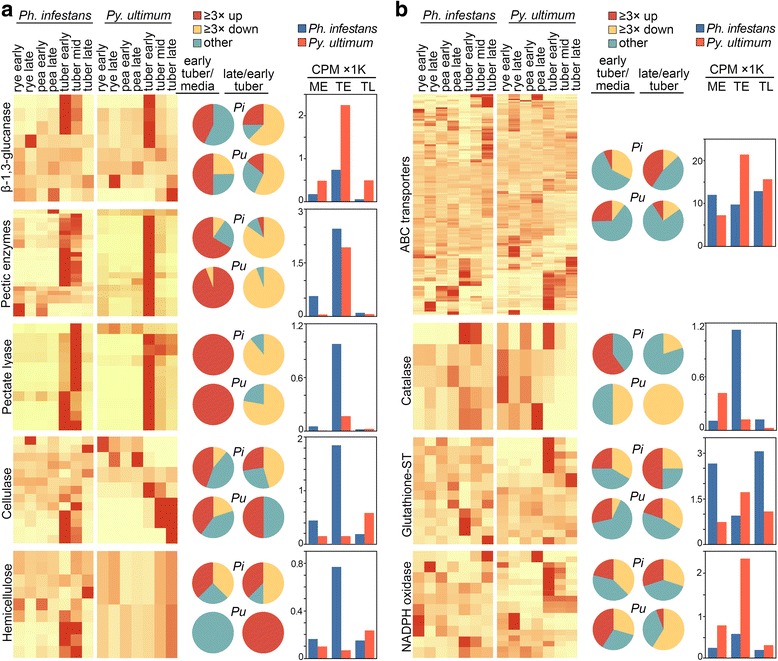
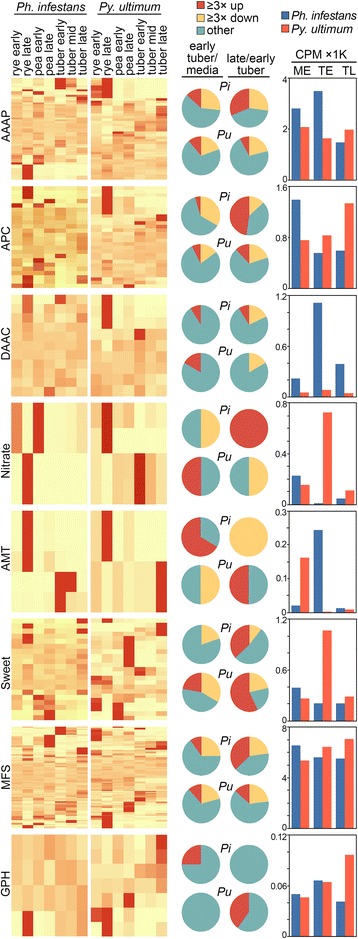
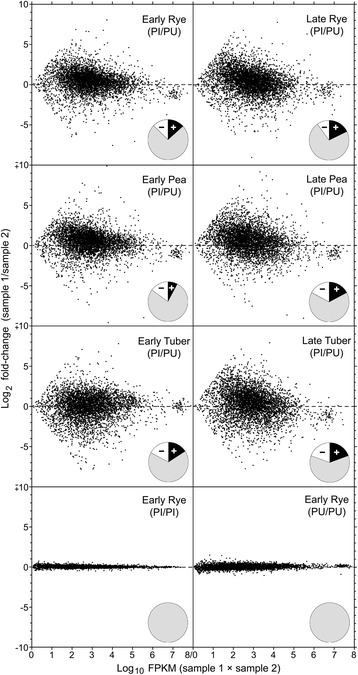
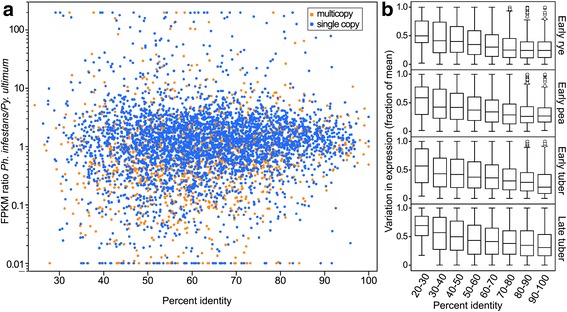
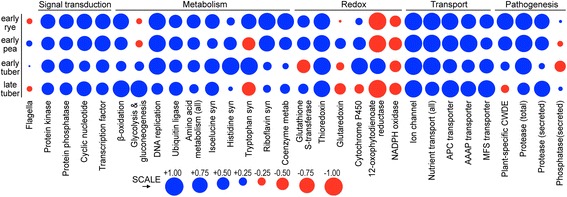
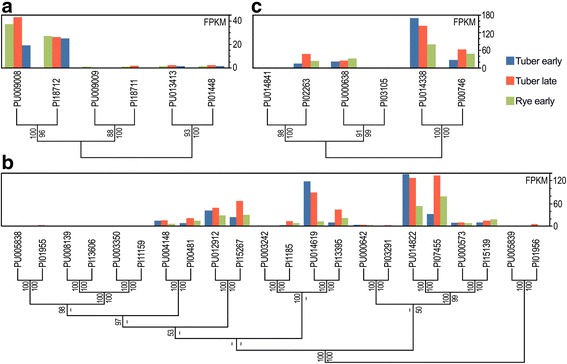
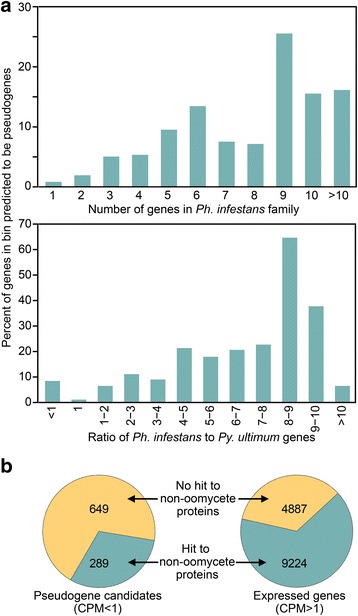
Results: Genes related to pathogenesis varied in temporal expression pattern, mRNA level, and family size between the species. A family's aggregate expression during infection was not proportional to size due to transcriptional remodeling and pseudogenization. Ph. infestans had more stage-specific genes, while Py. ultimum tended towards more constitutive expression. Ph. infestans expressed more genes encoding secreted cell wall-degrading enzymes, but other categories such as secreted proteases and ABC transporters had higher transcript levels in Py. ultimum. Species-specific genes were identified including new Pythium genes, perforins, which may disrupt plant membranes. Genome-wide ortholog analyses identified substantial diversified expression, which correlated with sequence divergence. Pseudogenization was associated with gene family expansion, especially in gene clusters.

Conclusion: This first large-scale analysis of transcriptional divergence within oomycetes revealed major shifts in genome composition and expression, including subfunctionalization within gene families. Biotrophy and necrotrophy seem determined by species-specific genes and the varied expression of shared pathogenicity factors, which may be useful targets for crop protection.

Keywords: Comparative genomics; Evolution; Gene family; Oomycete; Plant pathogen; RNA-seq; Regulatory subfunctionalization.


Conflict of interest statement

Ethics approval and consent to participate

Not applicable.

Consent for publication

Not applicable.

Competing interests

The authors declare that they have no competing interests.

Publisher’s Note

Springer Nature remains neutral with regard to jurisdictional claims in published maps and institutional affiliations.

Figures

Fig. 1
Fig. 1
Overview of expression data. a images of uninfected tuber, tuber infected with Ph. infestans at 4 dpi, and tuber infected with Py. ultimum at 1.5 dpi. Ph. infestans-infected tubers are asymptomatic at 1.5 dpi. b Heatmaps of hierarchical clustered TMM-normalized data from artificial media and plant samples for Ph. infestans (top) and Py. ultimum (bottom). Only genes with CPM ≥1 in at least one condition are shown. c Expression of stage-specific markers in early, middle and late tuber samples of Ph. infestans. d and e Principal component analysis (PCA) displaying intrinsic biological variation between replicates of Ph. infestans and Py. ultimum samples. f log2 fold-change ratios in comparisons of early tuber versus early media, and late versus early tuber
Fig. 2
Fig. 2
Gene ontology (GO) enrichment analysis. Indicated are terms that are over- or under-represented in genes of Ph. infestans (white bars) or Py. ultimum (black bars) that are up-regulated in a early tuber compared to the mean of early rye and pea media, and b late tuber versus early tuber
Fig. 3
Fig. 3
Expression of polyphenol oxidases. The colored bar graphs in the bottom plane show CPM values for individual genes in the six growth conditions in Ph. infestans (top) and Py. ultimum (bottom). Using the same color scheme, the bar graphs on the back wall portray aggregate CPM for all genes; those with the highest levels (pea late and tuber early in the upper and lower graphs, respectively) are indicated. Heatmaps based on per gene-normalized values are shown in grey scale on the left wall. Genes with CPM <1 are shown as “no reads”
Fig. 4
Fig. 4
Expression of selected pathogenesis-related genes. Illustrated are a secreted proteases and b five other classes of secreted pathogenicity factors. Shown on the left side of each panel are heatmaps of genes from Ph. infestans (left) and Py. ultimum (right) that have CPM ≥1 in at least one growth condition. The pie charts in the middle of each panel represent the fraction of genes from Ph. infestans (Pi) and Py. ultimum (Pu) that are up-regulated by ≥3-fold (red) or down-regulated (yellow) in early tuber compared to media, or late tuber compared to early tuber. Genes that show smaller changes are represented by the teal (blue-green) slice. Shown on the right side of each panel are bar charts indicating the aggregate CPM of all genes in each functional group in early rye and pea media (averaged; ME), early tuber (TE), and late tuber (TL). Note that Ph. infestans expresses a single aspartyl protease
Fig. 5
Fig. 5
Structure and expression of NPP (NLP) family. The left side of the figure is a cladogram of the genes from Ph. infestans (PITG prefix, black lettering) and Py. ultimum (PU prefix, green lettering). Bootstrap numbers from PhyML are shown at nodes. The right side of the figure indicates the CPM values in early media (average of early rye and pea, green), early tubers (blue) and late tubers (red bars). An absence of bars indicates CPM ≤1.0. Proteins predicted to be secreted are marked by black circle on the terminal branches of the tree, and those bearing the residues required for plant necrosis are marked by a diamond. These correspond to amino acids D112, H120, D123, and E125 of Phytophthora capsici NLP1 [36]. While PITG_22668 contains those residues, it also contains a S113E substitution which was associated with low necrosis in Ph. capsici
Fig. 6
Fig. 6
Expression of Ph. infestans RXLR genes. a heatmap of mRNA levels in nonsporulating hyphae from rye media (early rye), purified sporangia, sporangia chilled to initiate zoospore formation, swimming zoospores, cysts germinated in water, and tubers. Color codes for each sample are shown in boxes at the top of the panel; these correspond to the bar segments in panel b. b fraction of genes showing peak expression in the eight tissue samples, classified by peak FPKM values. The bar segments are presented in the same order (left to right) as the tissues in panel a. c maximum FPKM level of 297 individual RXLRs
Fig. 7
Fig. 7
Expression of selected pathogenesis-related genes. Illustrated are a cell wall-degrading enzymes (CWDEs) grouped by activity, and b genes potentially involved in detoxification. The format of the figure is the same as in Fig. 4
Fig. 8
Fig. 8
Expression of major gene families involved in nutrient transport. The format of the figure is the same as in Fig. 4, and functional categories are defined in the main text
Fig. 9
Fig. 9
MA plots of ortholog pairs. The y-axis indicates the log2 ratio of the FPKM values of the two samples being compared (M) while the x-axis shows the log10 product of their FPKM values (A). The top six panels compare Ph. infestans (Pi) and Py. ultimum (Pu) in early and late rye, pea, and tuber. The bottom two panels compare two replicates of Ph. infestans and Py. ultimum in early rye. The pie charts indicate the fraction of genes that are up- (+) or down-regulated (−) in Ph. infestans compared to Py. ultimum based on a fold-change threshold of 3.0. Only genes with FPKM ≥ 1 in at least one species are shown
Fig. 10
Fig. 10
Relationship between amino acid similarity and expression conservation. a Plot of FPKM ratio of orthologs (Ph. infestans divided by Py. ultimum) in early tuber versus amino acid identity. Orange and blue symbols represent members of multigene families and single-copy genes, respectively. b Box-plots indicating variation in expression level in early rye (based on 5273 genes with FPKM ≥ 1), early pea (5211 genes), early tuber (5123 genes), and late tuber (5461 genes) as a function of amino acid identity. Similar trends were seen in late rye and pea. Variation is defined as the difference between the FPKM of orthologs divided by their summed FPKM values. Ratios above 200 or below 0.01 are graphed as 200 and 0.01, respectively
Fig. 11
Fig. 11
Correlation between FPKM of orthologs in selected functional groups. Ortholog pairs were classified into functional groups and filtered to include only those with FPKM ≥ 1 in both species. Pearson’s correlation coefficients are graphed as positive (blue) or negative (red) in early rye and pea, and early and late tuber. The area of each circle is proportional to the degree of correlation
Fig. 12
Fig. 12
Examples of conserved and discordant expression patterns within orthologous families. Illustrated are three families of orthologs encoding a a regulatory subunit of calcineurin; b P-ATPases; and c a metal ion transporter. Indicated on the left side of each panel are cladogram trees with bootstrap values from PhyML (top) and neighbor-joining. The Ph. infestans and Py. ultimum gene numbers have PI and PU prefixes, respectively. The bar charts above the trees indicate FPKM of each gene in early tuber, late tuber, and early rye
Fig. 13
Fig. 13
Pseudogenization in Ph. infestans. a relationship between occurrence of a candidate pseudogene and either the size of the gene family (top) or the ratio of paralog numbers in Ph. infestans and Py. ultimum (bottom). b comparison of the fraction of pseudogenes and expressed genes having hits in GenBank against non-oomycete proteins

References

    1. Lewis DH. Concepts in fungal nutrition and origin of biotrophy. Biol Rev Camb Philos Soc. 1973;48:261–278. doi: 10.1111/j.1469-185X.1973.tb00982.x. - DOI
    1. Skamnioti P, Furlong RF, Gurr SJ. The fate of gene duplicates in the genomes of fungal pathogens. Commun Integr Biol. 2008;1:196–198. doi: 10.4161/cib.1.2.7144. - DOI - PMC - PubMed
    1. Richards TA, Soanes DM, Jones MD, Vasieva O, Leonard G, Paszkiewicz K, Foster PG, Hall N, Talbot NJ. Horizontal gene transfer facilitated the evolution of plant parasitic mechanisms in the oomycetes. Proc Natl Acad Sci U S A. 2011;108:15258–15263. doi: 10.1073/pnas.1105100108. - DOI - PMC - PubMed
    1. Weiberg A, Wang M, Lin FM, Zhao HW, Zhang ZH, Kaloshian I, Huang HD, Jin HL. Fungal small rnas suppress plant immunity by hijacking host RNA interference pathways. Science. 2013;342:118–123. doi: 10.1126/science.1239705. - DOI - PMC - PubMed
    1. Kabbage M, Yarden O, Dickman MB. Pathogenic attributes of Sclerotinia sclerotiorum: switching from a biotrophic to necrotrophic lifestyle. Plant Sci. 2015;233:53–60. doi: 10.1016/j.plantsci.2014.12.018. - DOI - PubMed