

as-PSOCT: Volumetric microscopic imaging of human brain architecture and connectivity
- PMID: 29017866
- PMCID: PMC5732037
- DOI: 10.1016/j.neuroimage.2017.10.012
as-PSOCT: Volumetric microscopic imaging of human brain architecture and connectivity
Abstract
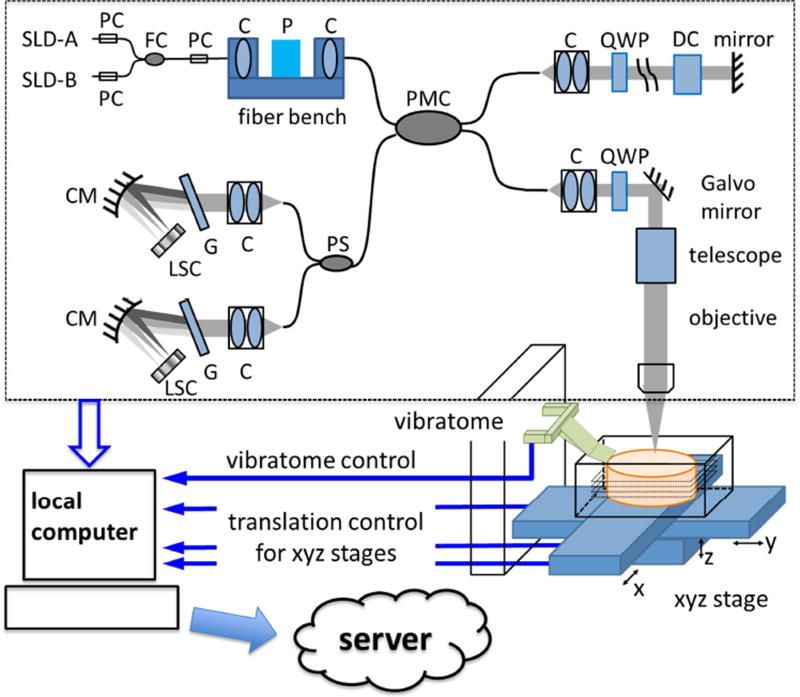
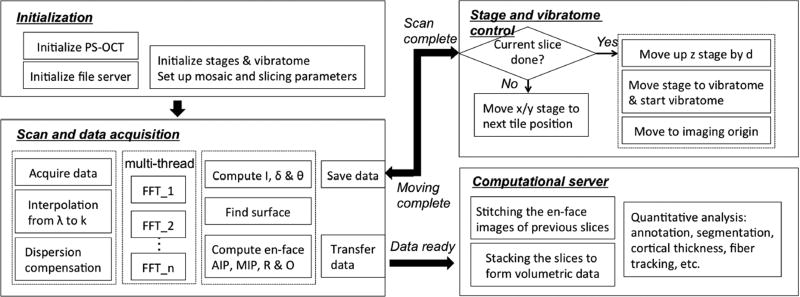
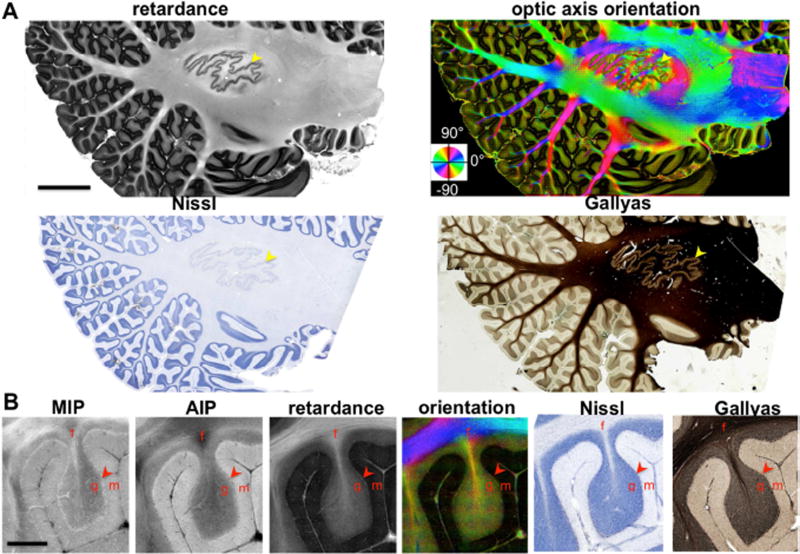
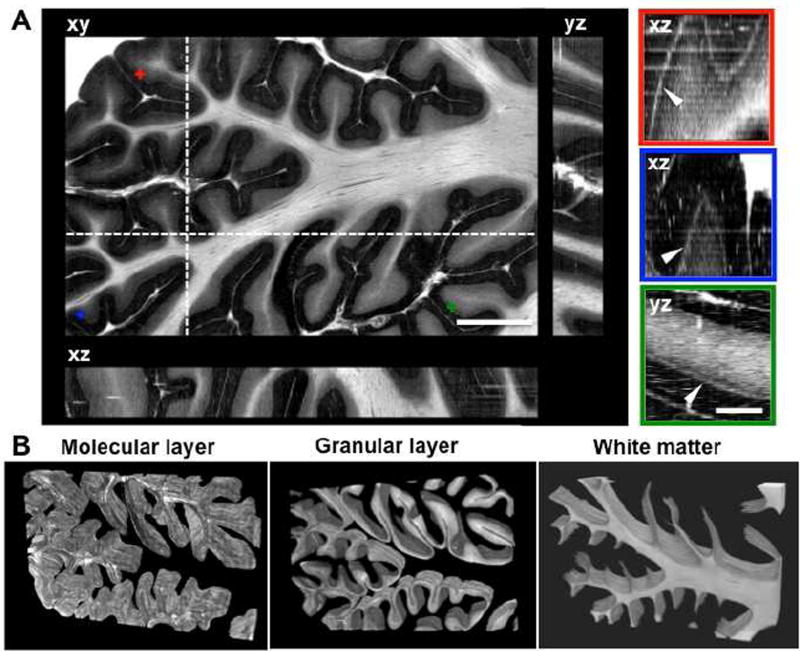
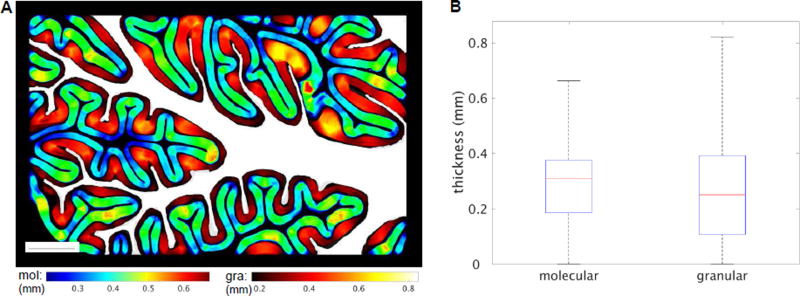
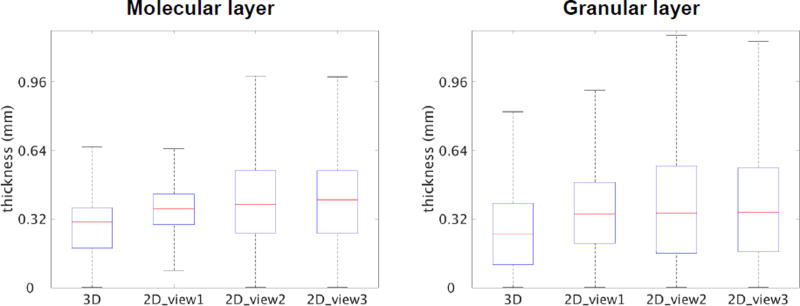
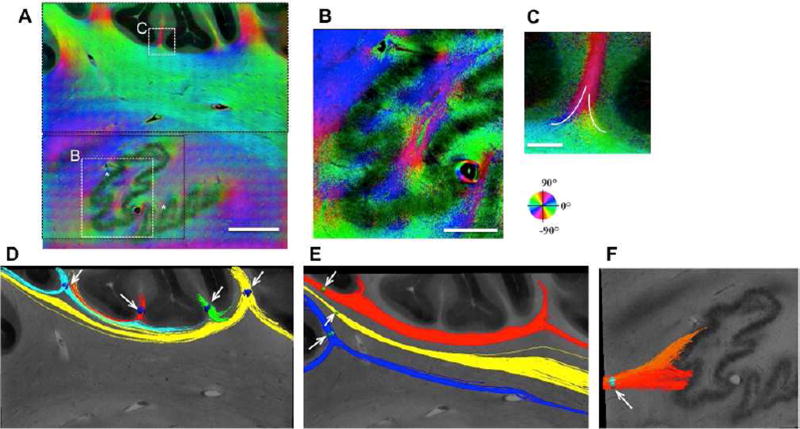
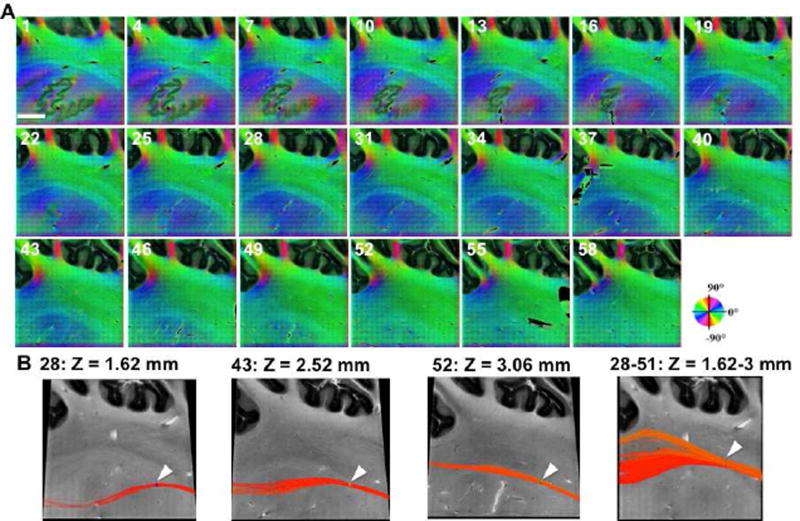
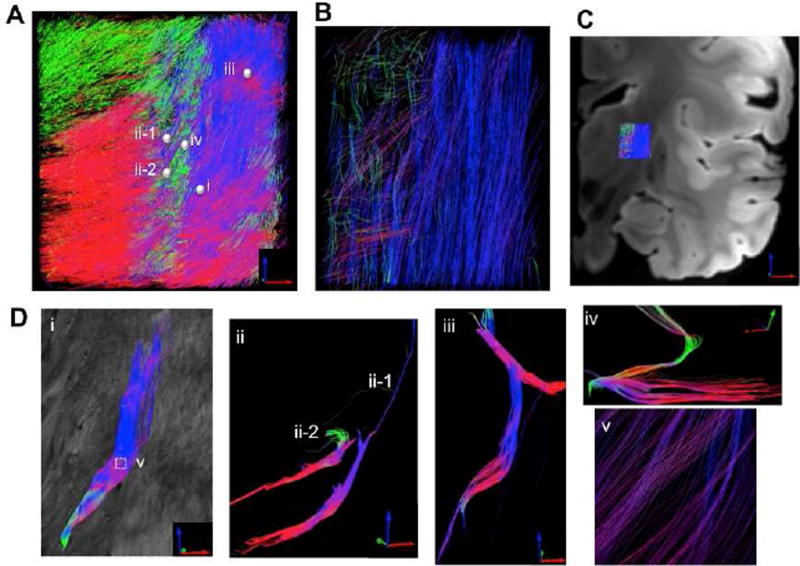
Polarization sensitive optical coherence tomography (PSOCT) with serial sectioning has enabled the investigation of 3D structures in mouse and human brain tissue samples. By using intrinsic optical properties of back-scattering and birefringence, PSOCT reliably images cytoarchitecture, myeloarchitecture and fiber orientations. In this study, we developed a fully automatic serial sectioning polarization sensitive optical coherence tomography (as-PSOCT) system to enable volumetric reconstruction of human brain samples with unprecedented sample size and resolution. The 3.5 μm in-plane resolution and 50 μm through-plane voxel size allow inspection of cortical layers that are a single-cell in width, as well as small crossing fibers. We show the abilities of as-PSOCT in quantifying layer thicknesses of the cerebellar cortex and creating microscopic tractography of intricate fiber networks in the subcortical nuclei and internal capsule regions, all based on volumetric reconstructions. as-PSOCT provides a viable tool for studying quantitative cytoarchitecture and myeloarchitecture and mapping connectivity with microscopic resolution in the human brain.
Copyright © 2017 Elsevier Inc. All rights reserved.
Figures

Similar articles
-
Multi-Scale Label-Free Human Brain Imaging with Integrated Serial Sectioning Polarization Sensitive Optical Coherence Tomography and Two-Photon Microscopy.Adv Sci (Weinh). 2023 Dec;10(35):e2303381. doi: 10.1002/advs.202303381. Epub 2023 Oct 26. Adv Sci (Weinh). 2023. PMID: 37882348 Free PMC article.
-
Serial optical coherence scanner for large-scale brain imaging at microscopic resolution.Neuroimage. 2014 Jan 1;84:1007-17. doi: 10.1016/j.neuroimage.2013.09.063. Epub 2013 Oct 4. Neuroimage. 2014. PMID: 24099843 Free PMC article.
-
Multi-Scale Label-free Human Brain Imaging with Integrated Serial Sectioning Polarization Sensitive Optical Coherence Tomography and Two-Photon Microscopy.bioRxiv [Preprint]. 2023 May 24:2023.05.22.541785. doi: 10.1101/2023.05.22.541785. bioRxiv. 2023. Update in: Adv Sci (Weinh). 2023 Dec;10(35):e2303381. doi: 10.1002/advs.202303381. PMID: 37293092 Free PMC article. Updated. Preprint.
-
High-resolution 3D tractography of fibrous tissue based on polarization-sensitive optical coherence tomography.Exp Biol Med (Maywood). 2020 Feb;245(4):273-281. doi: 10.1177/1535370219894332. Epub 2019 Dec 8. Exp Biol Med (Maywood). 2020. PMID: 31813275 Free PMC article. Review.
-
The diagnostic value of intracoronary optical coherence tomography.Herz. 2011 Aug;36(5):417-29. doi: 10.1007/s00059-011-3487-7. Herz. 2011. PMID: 21744151 Review.
Cited by
-
Post mortem mapping of connectional anatomy for the validation of diffusion MRI.Neuroimage. 2022 Aug 1;256:119146. doi: 10.1016/j.neuroimage.2022.119146. Epub 2022 Mar 25. Neuroimage. 2022. PMID: 35346838 Free PMC article. Review.
-
Capability of physically reasonable OCT-based differentiation between intact brain tissues, human brain gliomas of different WHO grades, and glioma model 101.8 from rats.Biomed Opt Express. 2020 Oct 28;11(11):6780-6798. doi: 10.1364/BOE.409692. eCollection 2020 Nov 1. Biomed Opt Express. 2020. PMID: 33282523 Free PMC article.
-
Volumetric Characterization of Microvasculature in Ex Vivo Human Brain Samples By Serial Sectioning Optical Coherence Tomography.IEEE Trans Biomed Eng. 2022 Dec;69(12):3645-3656. doi: 10.1109/TBME.2022.3175072. Epub 2022 Nov 23. IEEE Trans Biomed Eng. 2022. PMID: 35560084 Free PMC article.
-
Speckle modulation enables high-resolution wide-field human brain tumor margin detection and in vivo murine neuroimaging.Sci Rep. 2019 Jul 17;9(1):10388. doi: 10.1038/s41598-019-45902-9. Sci Rep. 2019. PMID: 31316099 Free PMC article.
-
Enhanced multiscale human brain imaging by semi-supervised digital staining and serial sectioning optical coherence tomography.Light Sci Appl. 2025 Jan 20;14(1):57. doi: 10.1038/s41377-024-01658-0. Light Sci Appl. 2025. PMID: 39833166 Free PMC article.
References
-
- Amunts K, Schleicher A, Bürgel U, Mohlberg H, Uylings HB, Zilles K. Broca’s region revisited: cytoarchitecture and intersubject variability. J. Comp. Neurol. 1999;412:319–341. - PubMed
Publication types
MeSH terms
Grants and funding
- U01 MH093765/MH/NIMH NIH HHS/United States
- R01 NS070963/NS/NINDS NIH HHS/United States
- U01 NS086625/NS/NINDS NIH HHS/United States
- R21 EB018907/EB/NIBIB NIH HHS/United States
- R01 AG016495/AG/NIA NIH HHS/United States
- S10 RR019307/RR/NCRR NIH HHS/United States
- R01 NS052585/NS/NINDS NIH HHS/United States
- R01 AG008122/AG/NIA NIH HHS/United States
- R01 AG049899/AG/NIA NIH HHS/United States
- R01 EB019956/EB/NIBIB NIH HHS/United States
- R21 NS072652/NS/NINDS NIH HHS/United States
- P01 NS055104/NS/NINDS NIH HHS/United States
- S10 RR023043/RR/NCRR NIH HHS/United States
- K01 DK101631/DK/NIDDK NIH HHS/United States
- R01 EB006758/EB/NIBIB NIH HHS/United States
- P41 EB015896/EB/NIBIB NIH HHS/United States
- R01 NS083534/NS/NINDS NIH HHS/United States
- S10 RR023401/RR/NCRR NIH HHS/United States
LinkOut - more resources
Full Text Sources
Other Literature Sources
