. 2017 Nov 8;37(45):11051-11066.
doi: 10.1523/JNEUROSCI.1572-17.2017. Epub 2017 Oct 10.

Suppression and Contrast Normalization in Motion Processing

Affiliations

Suppression and Contrast Normalization in Motion Processing

Christian Quaia et al. J Neurosci. .

Abstract

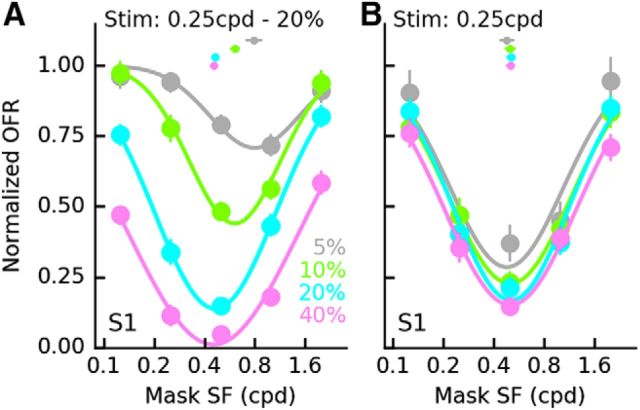
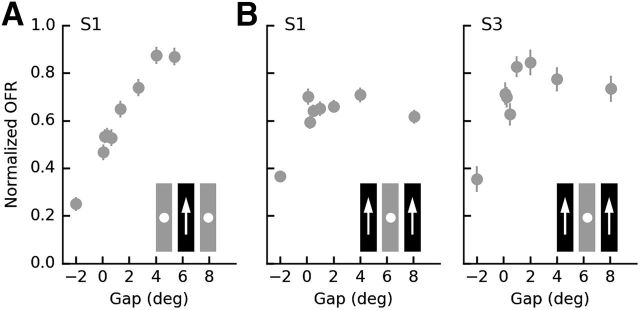
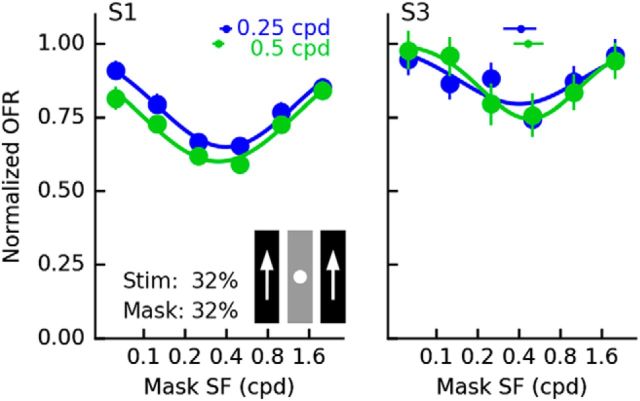
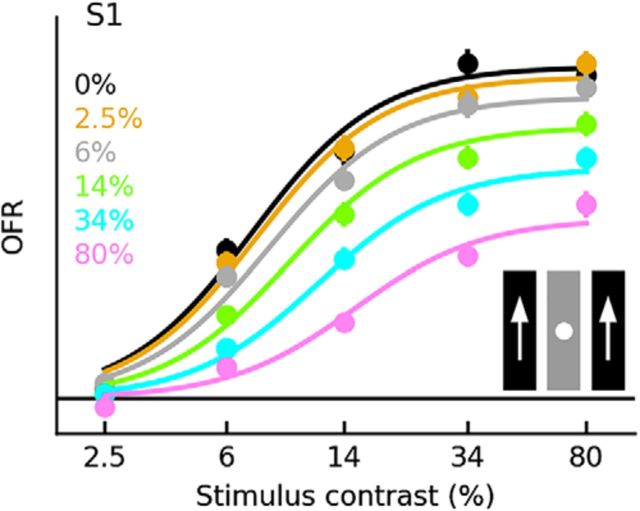
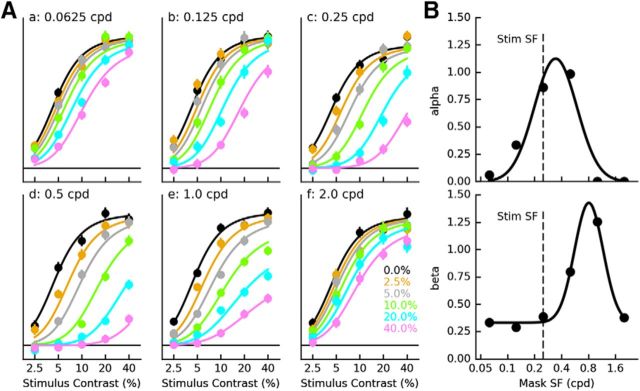
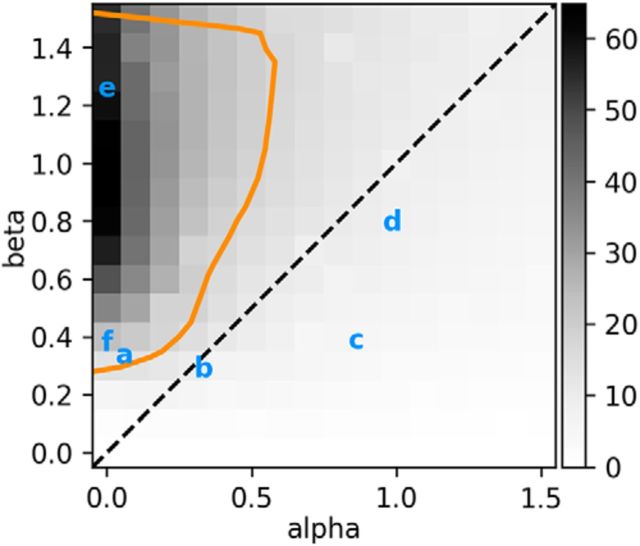
Sensory neurons are activated by a range of stimuli to which they are said to be tuned. Usually, they are also suppressed by another set of stimuli that have little effect when presented in isolation. The interactions between preferred and suppressive stimuli are often quite complex and vary across neurons, even within a single area, making it difficult to infer their collective effect on behavioral responses mediated by activity across populations of neurons. Here, we investigated this issue by measuring, in human subjects (three males), the suppressive effect of static masks on the ocular following responses induced by moving stimuli. We found a wide range of effects, which depend in a nonlinear and nonseparable manner on the spatial frequency, contrast, and spatial location of both stimulus and mask. Under some conditions, the presence of the mask can be seen as scaling the contrast of the driving stimulus. Under other conditions, the effect is more complex, involving also a direct scaling of the behavioral response. All of this complexity at the behavioral level can be captured by a simple model in which stimulus and mask interact nonlinearly at two stages, one monocular and one binocular. The nature of the interactions is compatible with those observed at the level of single neurons in primates, usually broadly described as divisive normalization, without having to invoke any scaling mechanism.SIGNIFICANCE STATEMENT The response of sensory neurons to their preferred stimulus is often modulated by stimuli that are not effective when presented alone. Individual neurons can exhibit multiple modulatory effects, with considerable variability across neurons even in a single area. Such diversity has made it difficult to infer the impact of these modulatory mechanisms on behavioral responses. Here, we report the effects of a stationary mask on the reflexive eye movements induced by a moving stimulus. A model with two stages, each incorporating a divisive modulatory mechanism, reproduces our experimental results and suggests that qualitative variability of masking effects in cortical neurons might arise from differences in the extent to which such effects are inherited from earlier stages.

Keywords: masking; motion; normalization.


Figures

Figure 1.
Figure 1.
Masking of sample OFRs. The sudden onset of a drifting horizontal sinusoidal grating (0.25 cpd SF, 18.75 Hz TF, 32% contrast) induces a short-latency (∼70 ms in humans) vertical OFR (black). When a static horizontal sinusoidal grating (0.5 cpd SF, 32% contrast) is added to the stimulus, the ensuing OFR is much smaller (gray), although its latency is unchanged. Most tuning properties of the OFR are highly similar across subjects, although the absolute magnitude of a response to a given stimulus can vary widely across subjects (vertical scale corresponds to 0.25 deg/s). We quantify the strength of the response by computing the average eye speed in a time window that goes from the onset of the response to twice the latency (open-loop period), indicated here with a gray bar above the abscissa. Space–time diagrams show the temporal evolution of unmasked and masked stimuli. Data are shown from three subjects (S1, S2, and S3).
Figure 2.
Figure 2.
SF tuning of masking suppression. A, When the SF of stimulus and mask are varied while keeping their contrast fixed (32% each), the extent of suppression varies widely. Here, three different SFs are used for the stimulus: 0.125 cpd (red), 0.25 cpd (blue), and 0.5 cpd (green). Each of these is paired with six SFs of the mask, from 0.0625 to 2.0 cpd in one-octave steps. For each SF of the stimulus, a SF of the mask can be found that exerts almost complete suppression. In all three subjects, the SF tuning of suppression varies considerably as a function of the SF of the stimulus (log-Gaussian fits are shown; Eq. 1). Small colored dots and bars indicate mean and SEM of the location of the trough in each fit. Parameters of the fitting functions (mean and SEM) as a function of the SF of the stimulus are shown in BE. B, SF corresponding to the strongest attenuation (μ). C, FWHH bandwidth (γ). D, Low SF cutoff (SFfL). E, High SF cutoff (SFfH). Values for the parameters are also listed in Table 1.
Figure 3.
Figure 3.
Contrast tuning of masking suppression. When the contrast of stimulus and mask are varied while keeping their SF fixed (0.25 cpd for the stimulus, 0.5 cpd for the mask), the extent of suppression varies as a function of both. We used five contrast levels for the stimulus, from 2.5% to 40% in one-octave increments and five for the mask (see color key), which could also be absent (0% contrast). A Naka–Rushton function in which the mask acts in a divisive manner (Eq. 3) fits the data remarkably well in all three subjects. Parameter values for the fitting function are reported in Table 2.
Figure 4.
Figure 4.
Contrast tuning of masking suppression. Same as Figure 3, but the SFs of stimulus and mask are now farther apart (0.125 cpd for the stimulus, 1.0 cpd for the mask). In this case, a purely divisive model does not provide a good fit to the data; a model that incorporates both divisive and scaling effects (Eq. 5), the fits of which are shown, is necessary. Parameter values can be found in Table 2.
Figure 5.
Figure 5.
Nonseparable interactions between contrast and SF. A, When the SF and contrast of the stimulus are kept constant (0.25 cpd, 20%) and those of the mask are varied (SF on the abscissa, see color key for contrast), the mask SF resulting in the strongest suppression varies as a function of mask contrast and so does the bandwidth of the effect. B, When contrast of mask and stimulus are the same (see color key), the SF tuning of suppression is essentially invariant, with only a slight broadening and deepening of the curves with increasing contrast. Fit parameters can be found in Table 3.
Figure 6.
Figure 6.
Suppression in center-surround configurations. A, When the stimulus (0.25 cpd, 32% contrast) is presented in a central aperture and the mask (0.5 cpd, 32% contrast) flanks it with a variable gap (abscissa; negative values indicates overlap), the strength of suppression decreases as the gap increases. The spatial configuration of stimulus and mask apertures is represented graphically: gray/dot represent the static mask, black/arrow represent the drifting grating; both are presented in rectangular apertures, arranged as shown. B, When the mask is presented in a central aperture and the stimulus flanks it with a variable gap, the strength of suppression varies only slightly with gap size, although it is still considerably weaker than in the overlap condition.
Figure 7.
Figure 7.
SF tuning of masking for nonoverlapping masks. Same format as in Figure 2. Two different SFs, 0.25 cpd (blue) and 0.5 cpd (green), are used for the stimulus, whereas the mask can have one of six SFs. Both have 32% contrast and are arranged in a center-surround configuration with a small (1°) gap. Log-Gaussian fits to the data are shown (parameter values in Table 1). When stimulus and mask overlap, the two SF tuning curves are shifted relative to each other with the one associated with the lower stimulus SF having its trough at a lower mask SF (Fig. 2). Now the two curves are very similar and the location of their trough is not significantly different. The curves are also considerably shallower because the strength of suppression is weaker in the center-surround configuration (Fig. 6).
Figure 8.
Figure 8.
Contrast tuning of masking for nonoverlapping masks. Same format and SF for stimulus (0.25 cpd) and mask (0.5 cpd) as in Figure 3. Because stimulus and mask do not overlap, a wider range of contrasts could be explored. In the overlap condition, a purely divisive model was sufficient to account for the effect of the mask (i.e., the mask mostly shifted the contrast response function to the right without changing its slope). In the center-surround condition shown here, a significant scaling component of suppression is also present (note how the slope of the curves decreases as mask contrast increases). Fit parameters are listed in Table 2.
Figure 9.
Figure 9.
Suppression from overlapping monocular and dichoptic masks. With stimulus (0.25 cpd SF, 32% contrast) and mask (0.5 cpd SF, 32% contrast) spatially overlapping, the mask is significantly more effective at suppressing the OFR induced by the stimulus (i.e., lower normalized OFR) when it is presented to the same eye (orange) than when it is presented to the other eye (blue). Black bars indicate SEM. Unpaired bootstrap-based (i.e., nonparametric) test was used to compute significance levels.
Figure 10.
Figure 10.
Suppression from nonoverlapping monocular and dichoptic masks. When stimulus (0.25 cpd SF) and mask (0.5 cpd SF, 80% contrast) are presented in a center-surround configuration (4° gap), the mask is equally effective whether is presented to the same (orange) or to the other eye (blue). In both cases, a divisive and a scaling suppressive effect of the mask are observed. Fit parameters are listed in Table 3.
Figure 11.
Figure 11.
Suppression from nonstatic masks. Stimulus (drifting sinusoidal grating, SF = 0.25 cpd, TF = 15 Hz, contrast = 8%) and mask (high-pass-filtered 1D noise pattern) have both motion energy, but for the mask it is balanced in both directions. The TF around which the motion energy of the mask is concentrated is indicated on the abscissa. Low-TF masks are more effective at suppressing the OFR to the stimulus. Both a low-pass temporal filter (blue) and a band-pass temporal filter (orange) fit the data reasonably well. Importantly, both filters predict the amount of suppression exerted by a flickering mask (FL on the abscissa).
Figure 12.
Figure 12.
Cascading effects of masking suppression. The behavior of the cascade model as a function of the relative contributions to masking suppression of the first and second stage is illustrated. Four different model instantiations are considered, differing only in the stage(s) at which the mask exerts divisive suppression: at neither stage (black), only at the first stage (gray), only at the second stage (dashed yellow), or at both stages (dashed pink). A, Output of the first stage. B, Output of the second stage.
Figure 13.
Figure 13.
Modeling contrast tuning of masking suppression over a wide range of mask SFs. A, Same as Figures 3 and 4, but here for a single SF of the stimulus (0.25 cpd) the contrast tuning of suppression is measured for a wide range of mask SFs (indicated in each subpanel). The data are fit using a two-stage cascade model. The model has eight parameters, but only two are different in each of the six panels, one in the first stage (α) and one in the second stage (β). Therefore, all of the fits shown here require a combined total of 18 parameters. Parameters for the fits are listed in Table 4. B, α (top) and β (bottom) vary in a lawful manner as a function of the SF of the mask. Log-Gaussian fits are shown.
Figure 14.
Figure 14.
Divisive and scaling components of suppression. The values of parameters α (abscissa) and β (ordinate) in the cascade model (Eq. 8) predict whether the effect of suppression can be described by a purely divisive model or if a scaling component of suppression must also be included. Here, a wide range of values for both parameters is explored using simulated data and the increase in the χ2 measure associated with the purely divisive model is shown as a grayscale heatmap. The region over which the improvement is significant according to the AICc is outlined (orange). Lowercase letters are placed in correspondence to the parameter values for the fits in the subpanels in Figure 13A. a, 0.0625 cpd; b, 0.125 cpd; c, 0.25 cpd; d, 0.5 cpd; e, 1.0 cpd; f, 2.0 cpd. Mask SFs two or more octaves away from the stimulus SF required a scaling component, whereas closer ones did not.

Similar articles

Cited by

References

    1. Adelson EH, Bergen JR (1985) Spatiotemporal energy models for the perception of motion. J Opt Soc Am A 2:284–299. 10.1364/JOSAA.2.000284 - DOI - PubMed
    1. Albrecht DG, Geisler WS (1991) Motion selectivity and the contrast-response function of simple cells in the visual cortex. Vis Neurosci 7:531–546. 10.1017/S0952523800010336 - DOI - PubMed
    1. Albrecht DG, Geisler WS, Frazor RA, Crane AM (2002) Visual cortex neurons of monkeys and cats: temporal dynamics of the contrast response function. J Neurophysiol 88:888–913. - PubMed
    1. Alitto HJ, Usrey WM (2008) Origin and dynamics of extraclassical suppression in the lateral geniculate nucleus of the macaque monkey. Neuron 57:135–146. 10.1016/j.neuron.2007.11.019 - DOI - PMC - PubMed
    1. Alitto HJ, Moore BD 4th, Rathbun DL, Usrey WM (2011) A comparison of visual responses in the lateral geniculate nucleus of alert and anaesthetized macaque monkeys. J Physiol 589:87–99. 10.1113/jphysiol.2010.190538 - DOI - PMC - PubMed

Publication types

LinkOut - more resources