Review
. 2017 Oct 10;8(1):816.
doi: 10.1038/s41467-017-00846-4.

Microfluidics with fluid walls

Affiliations
Review

Microfluidics with fluid walls

Edmond J Walsh et al. Nat Commun. .

Abstract

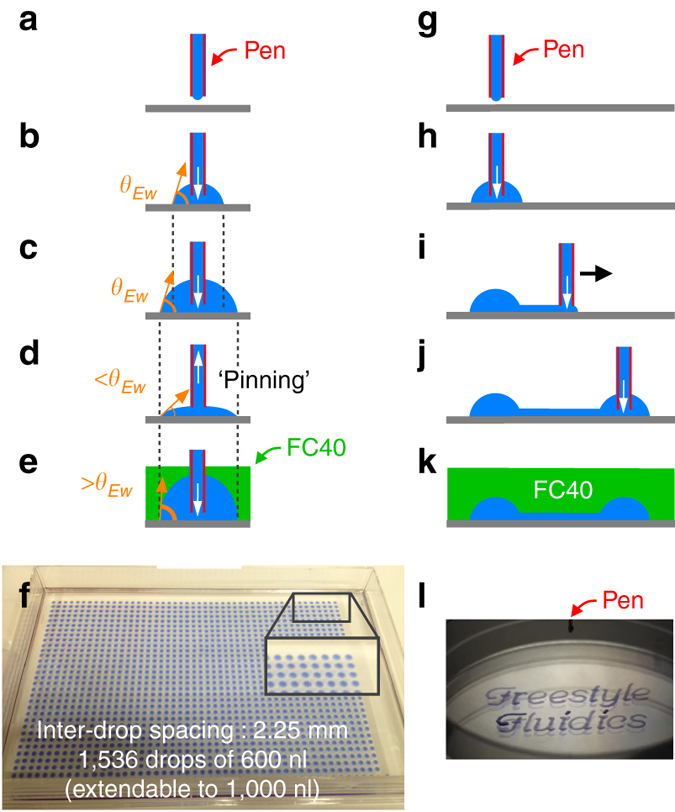
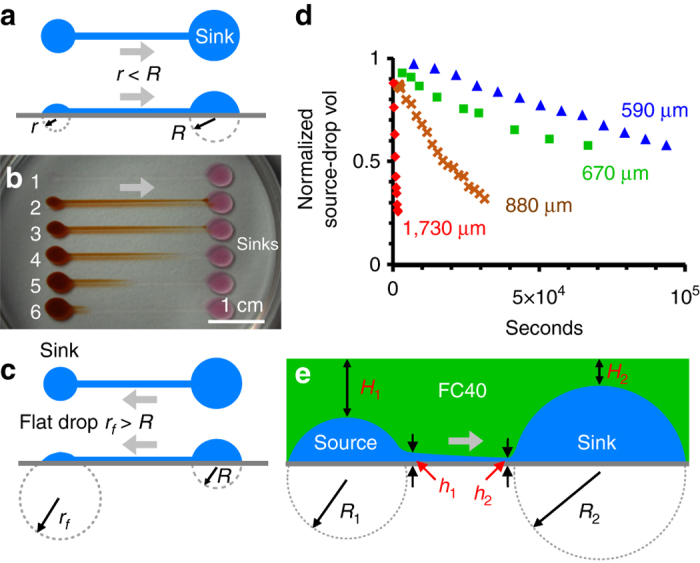
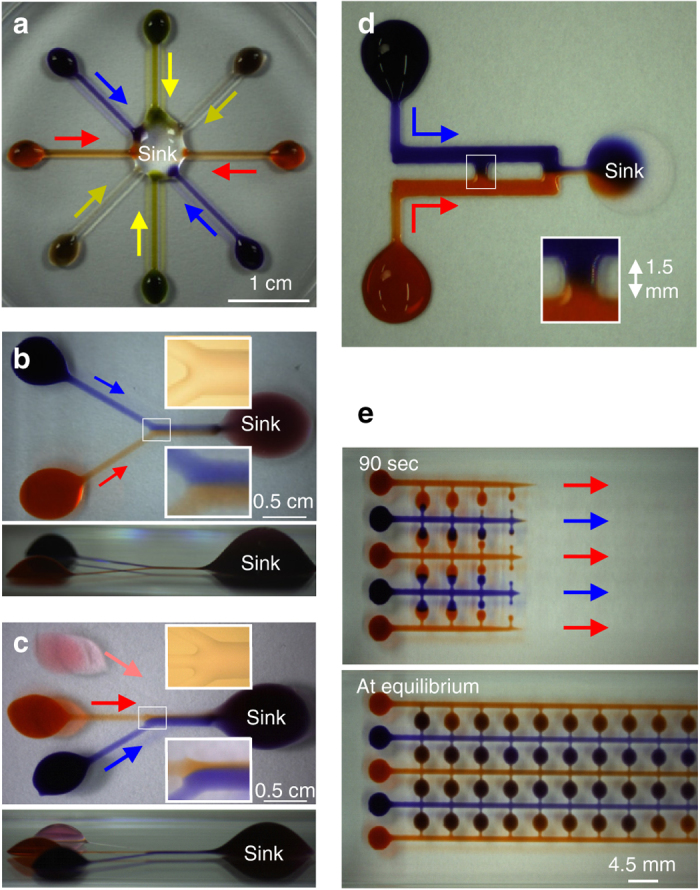
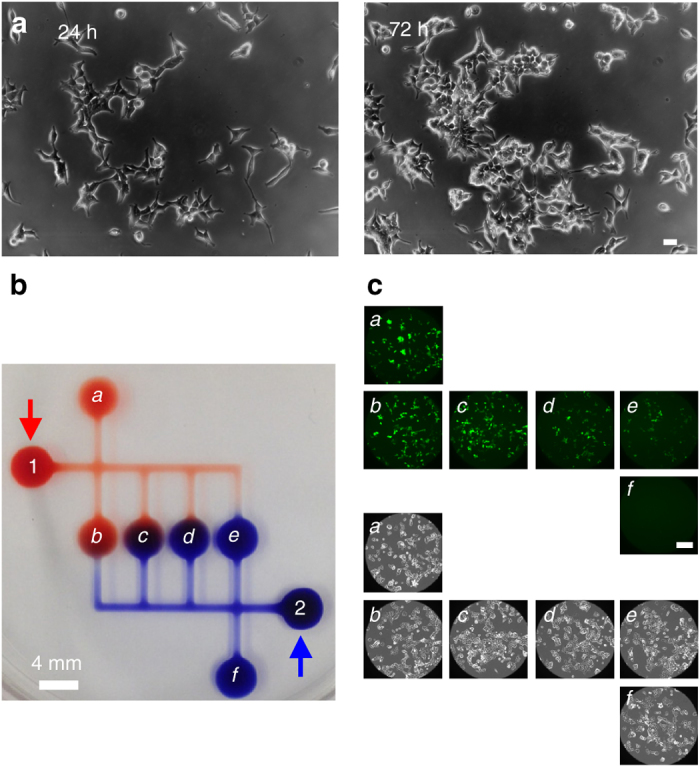
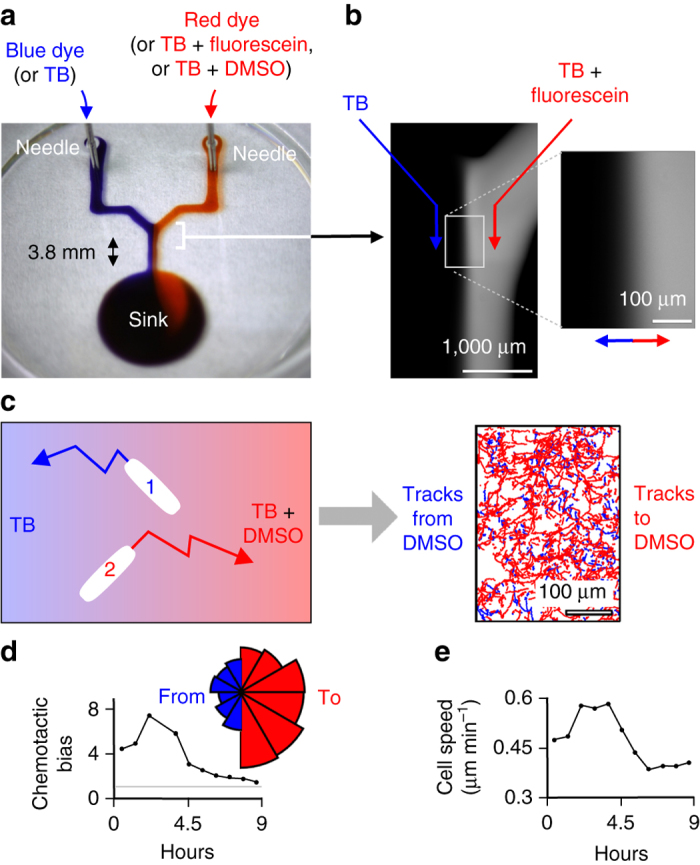
Microfluidics has great potential, but the complexity of fabricating and operating devices has limited its use. Here we describe a method - Freestyle Fluidics - that overcomes many key limitations. In this method, liquids are confined by fluid (not solid) walls. Aqueous circuits with any 2D shape are printed in seconds on plastic or glass Petri dishes; then, interfacial forces pin liquids to substrates, and overlaying an immiscible liquid prevents evaporation. Confining fluid walls are pliant and resilient; they self-heal when liquids are pipetted through them. We drive flow through a wide range of circuits passively by manipulating surface tension and hydrostatic pressure, and actively using external pumps. Finally, we validate the technology with two challenging applications - triggering an inflammatory response in human cells and chemotaxis in bacterial biofilms. This approach provides a powerful and versatile alternative to traditional microfluidics.The complexity of fabricating and operating microfluidic devices limits their use. Walsh et al. describe a method in which circuits are printed as quickly and simply as writing with a pen, and liquids in them are confined by fluid instead of solid walls.


Conflict of interest statement

Oxford University Innovation—the technology transfer company of The University of Oxford – has filed provisional patent applications on behalf of E.J.W., A.F., and P.R.C. partly based on this study. E.J.W., A.F., and P.R.C. each hold equity in iotaSciences Ltd, a company that is exploiting this technology. iotaSciences Ltd also partially funds salaries and research of A.F. and A.N.T. The remaining authors declare no competing financial interests.

Figures

Fig. 1
Fig. 1
Making circuits without solid walls. af Some principles. θ Ew: equilibrium contact angle (media in air). a, b Ejected media is held in place by surface tension. c Adding media increases the footprint, but d removing large amounts does not. e Overlaying FC40 allows more media than in (c) to be added without altering the footprint because the equilibrium contact angle of media under FC40 is greater. f Array of 1536 drops of media plus blue dye under FC40 in a flat microtiter plate lacking wells (inset shows magnification). The pen ejected fluid continuously as it deposited drops (locations as in a conventional 1536-well plate). gk Steps in printing a simple circuit. See text. l Example circuit printed in ∼40 s in air using media mixed with blue dye in a 6-cm tissue-culture dish. It is not yet overlaid with FC40
Fig. 2
Fig. 2
Using Laplace pressure to drive flow through FF circuits. Grey arrows: direction of flow. a Principles. In this simple circuit (plan, side views), the left‐hand drop has the smaller radius of curvature (r < R), and a pressure difference between the drops is the main driver of flow. b A frame from Supplementary Movie 3. Media (20 µl) was added through the 5 ml overlay of FC40 to each sink drop; next, 10, 8, 6, 4, and 2 µl red dye were pipetted successively into drops 6–2, and the dish photographed after ∼30 s. Advection transports dye away from drops with the smaller radii of curvature (diffusion down the conduit is negligible). Although dye was added to drop 2 last, it reaches a sink first. c This circuit (plan, side views) has the same footprint as that in (a), but flow is reversed because the small flat drop has the larger radius of curvature (r f > R) and lowest pressure. d Flow rate depends on conduit width. Four circuits were made like the one in (a); each had an 18-µl left-hand (source) drop connected to a 20-µl sink through a 11-mm conduit (widths indicated). Circuits were overlaid with 3-mm FC40. Time-lapse imaging (side views) show volumes of source drops decrease over time; these volumes were determined and normalized relative to initial ones. e Interplay between Laplace and hydrostatic pressures. The left-hand drop has a smaller radius of curvature (and so higher Laplace pressure) than the right-hand one (R 1  < R 2), and is overlaid with a greater depth of FC40 (H 1 > H 2) and so experiences a higher hydrostatic pressure. Both pressures combine to drive flow to the right
Fig. 3
Fig. 3
Some FF circuits carrying out different functions. Colored dyes were pipetted manually into input drops, and they are flowing (colored arrows) to sink drops autonomously. Insets illustrate how accurately pinning lines are built. a Mixing 8 fluids. b Generating a stable concentration gradient across two laminar streams after the junction (side view below). c Flow focusing the central laminar stream after the junction (side view below). d Generating a flow-free diffusion gradient across the central conduit (inset). e Feeding circuit after 90 s (upper) and at equilibrium (lower); dyes were pipetted into large drops on the left, which then feed the small chambers
Fig. 4
Fig. 4
HEKs in drops/circuits in 6-cm plates grow as expected. a Phase-contrast images (frames from Supplementary Movie 8) showing cells in an FF drop increase in number. Bar: 40 µm. b Circuit operation demonstrated using dyes. Blue and red dyes were pipetted into drops 1 and 2 (arrows); they flow autonomously into chambers a–f to create serial dilutions in minutes (a contains the highest concentration of red dye and no blue, while f contains the highest concentration of blue dye and no red). c Cells in the FF circuit respond to TNFα. A total of 1 µl HEKs (∼600 cells) were plated in each chamber a–f, grown (24 h), and TNFα (9 µl; 10 ng/ml) pipetted into drop 1 and medium (9 µl) into 2. Automatic dilution/mixing gives the highest concentration of TNFα in a, and serial dilutions in b–e; f receives no TNFα. TNFα concentrations in chambers a–f were 5.1, 4.7, 3.4, 1.8, 0.8, and 0 ng/ml. Cells were now incubated for 24 h to allow TNFα to induce GFP expression. Fluorescence (upper) and bright-field images (lower) of the centers of chambers a–f are shown. For quantitative analysis of TNFα concentrations and fluorescence intensities, see Supplementary Fig. 7. Bar: 200 µm
Fig. 5
Fig. 5
Integrating external pumps into an FF circuit to study bacterial chemotaxis. a Overview (40-mm glass-bottomed dish). Blue and red dyes (or alternatives indicated) each flow (100 nl/s) from syringes driven by one external pump through hollow needles to the sink. b Using fluorescein to characterize the diffusion gradient across the conduit. The circuit was placed on a confocal microscope, and TB and TB + fluorescein were pumped (12 µl/h) through arms of the Y. An image of the region downstream of the junction reveals fluorescent and dark laminar streams. Inset: diffusion of fluorescein to the left generates a concentration gradient (arrows point to highest concentrations). c Chemotaxis of P. aeruginosa towards DMSO. The circuit was placed on an inverted microscope, bacteria pipetted into the central conduit, TB and TB + DMSO injected into left and right arms (each at 12 µl/h), bright-field images collected over 9 h, and trajectories of individual bacteria in a region near the junction determined. The cartoon (left) shows individual trajectories (cells 1 and 2 move down and up the gradient, respectively), and the map (right) shows more trajectories (red; collected between 0 and 6 h) are to the right towards high DMSO concentrations compared to those to the left (blue). d Chemotactic bias (number bacteria travelling up DMSO gradient divided by number moving down). Bias > 1 indicates more cells move up gradient (grey line: lack of chemotaxis). Inset: probability-density functions of angle from each trajectory’s origin to final position (0–6 h), with red/blue bins denoting movement towards/away DMSO. A slight downstream bias occurs because flow pushes bacteria. e Average speed of individual cells increases initially before decreasing due to cell crowding caused by population growth

References

    1. Duffy DCD, McDonald JCJ, Schueller OJO, Whitesides GMG. Rapid prototyping of microfluidic systems in poly(dimethylsiloxane) Anal. Chem. 1998;70:4974–4984. doi: 10.1021/ac980656z. - DOI - PubMed
    1. Sackmann EK, Fulton AL, Beebe DJ. The present and future role of microfluidics in biomedical research. Nature. 2014;507:181–189. doi: 10.1038/nature13118. - DOI - PubMed
    1. Duncombe TA, Tentori AM, Herr AE. Microfluidics: reframing biological enquiry. Nat. Rev. Mol. Cell Biol. 2015;16:554–567. doi: 10.1038/nrm4041. - DOI - PMC - PubMed
    1. Lee JM, Park C, Whitesides GM. Solvent compatibility of poly(dimethylsiloxane)-based microfluidic devices. Anal. Chem. 2003;75:6544–6554. doi: 10.1021/ac0346712. - DOI - PubMed
    1. Regehr KJ, et al. Biological implications of polydimethylsiloxane-based microfluidic cell culture. Lab Chip. 2009;9:2132–2139. doi: 10.1039/b903043c. - DOI - PMC - PubMed

Publication types