. 2017 Oct 10;8(1):845.
doi: 10.1038/s41467-017-00900-1.

The gut microbiome in atherosclerotic cardiovascular disease

Affiliations

The gut microbiome in atherosclerotic cardiovascular disease

Zhuye Jie et al. Nat Commun. .

Abstract

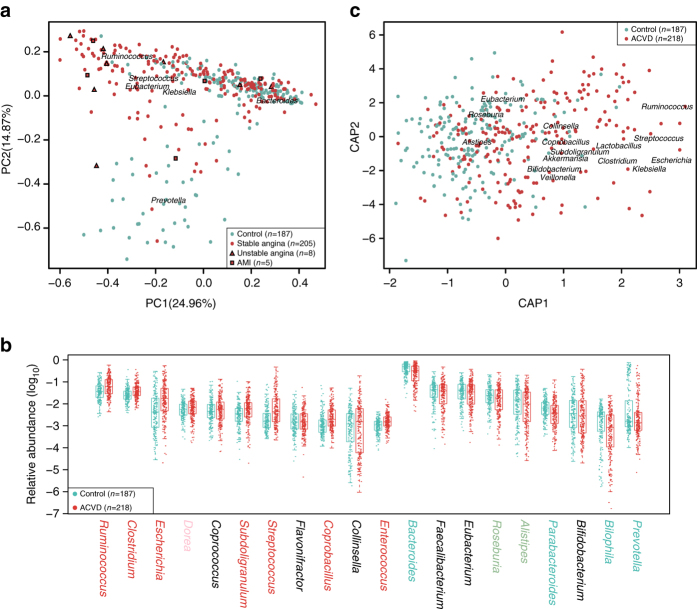
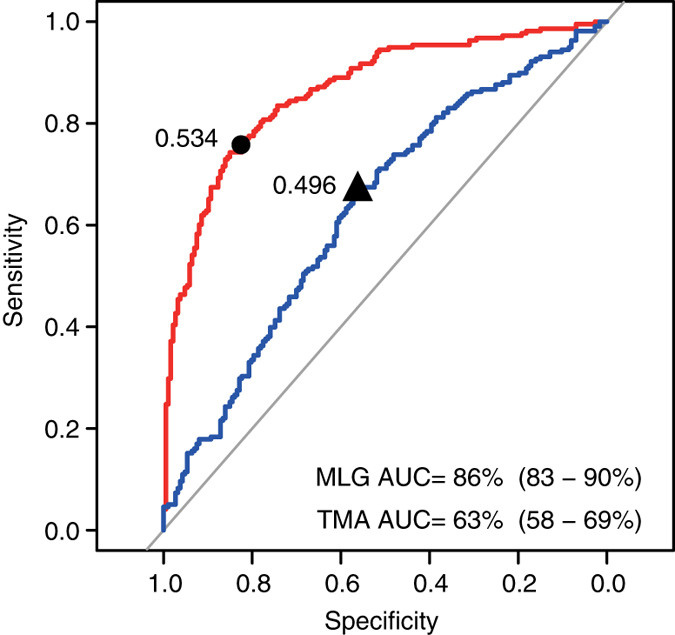
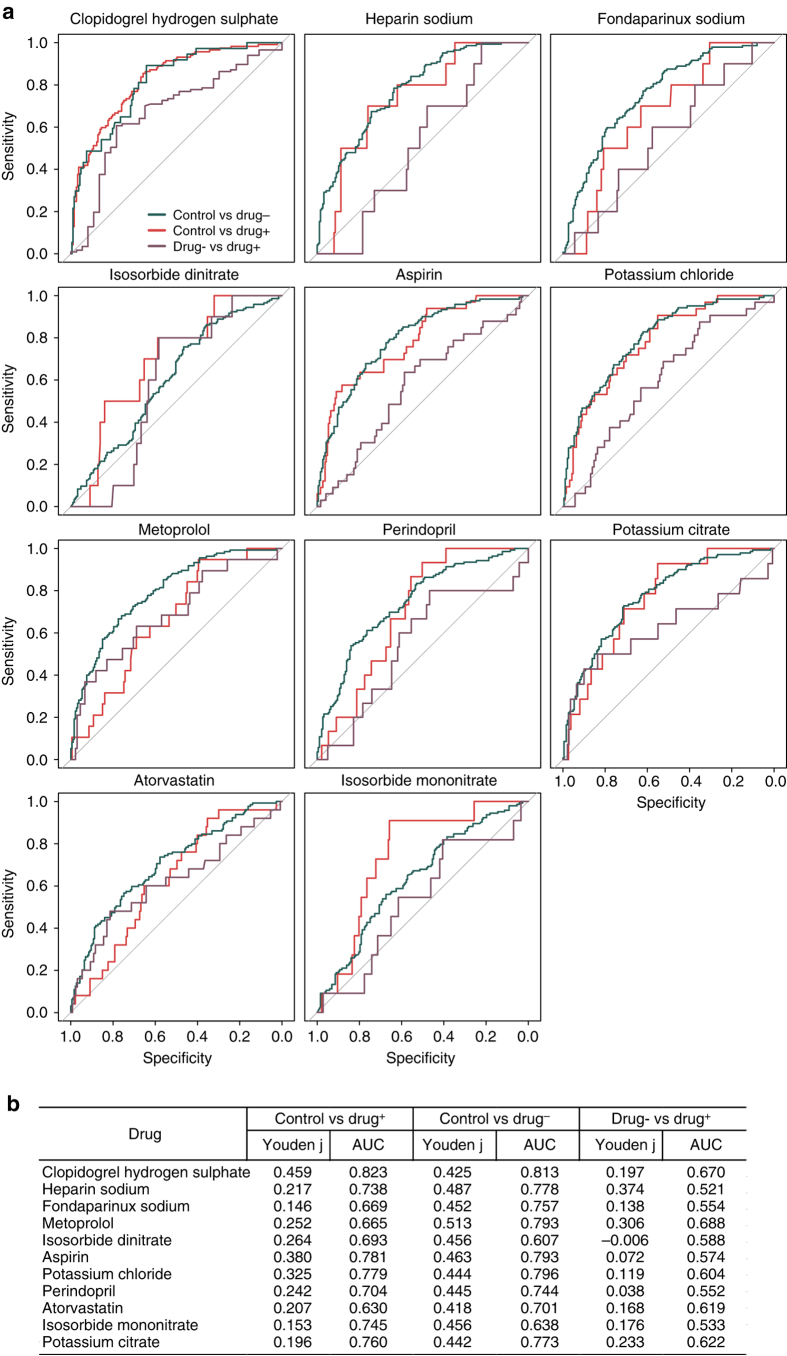
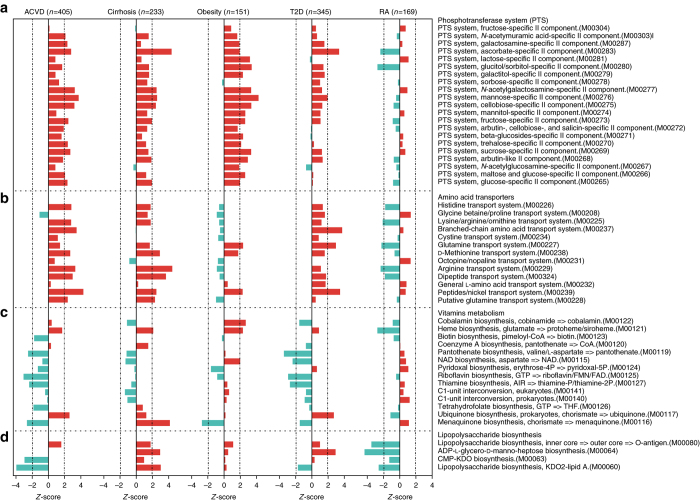
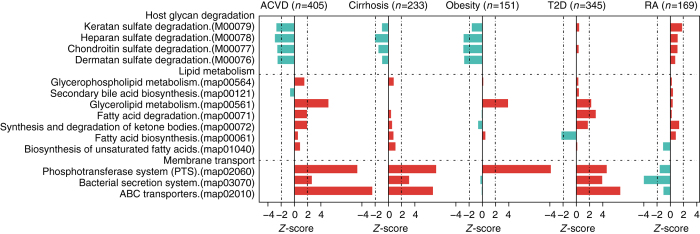
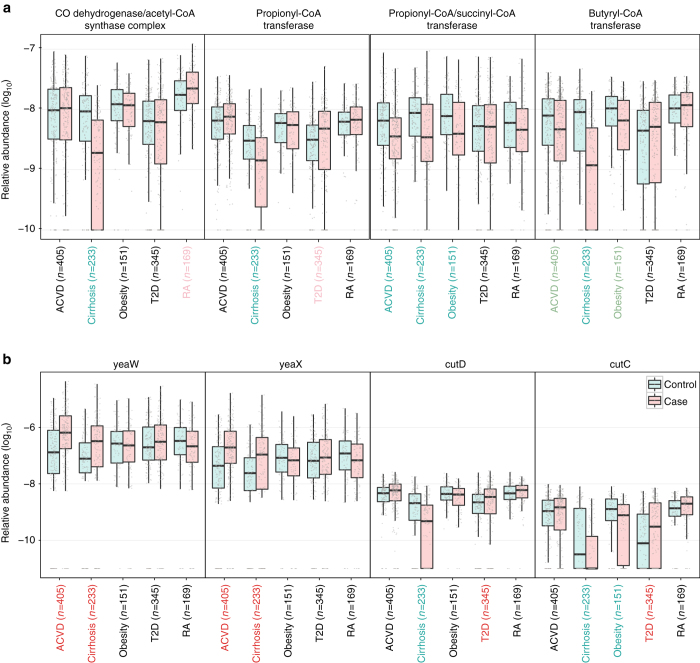
The gut microbiota has been linked to cardiovascular diseases. However, the composition and functional capacity of the gut microbiome in relation to cardiovascular diseases have not been systematically examined. Here, we perform a metagenome-wide association study on stools from 218 individuals with atherosclerotic cardiovascular disease (ACVD) and 187 healthy controls. The ACVD gut microbiome deviates from the healthy status by increased abundance of Enterobacteriaceae and Streptococcus spp. and, functionally, in the potential for metabolism or transport of several molecules important for cardiovascular health. Although drug treatment represents a confounding factor, ACVD status, and not current drug use, is the major distinguishing feature in this cohort. We identify common themes by comparison with gut microbiome data associated with other cardiometabolic diseases (obesity and type 2 diabetes), with liver cirrhosis, and rheumatoid arthritis. Our data represent a comprehensive resource for further investigations on the role of the gut microbiome in promoting or preventing ACVD as well as other related diseases.The gut microbiota may play a role in cardiovascular diseases. Here, the authors perform a metagenome-wide association study on stools from individuals with atherosclerotic cardiovascular disease and healthy controls, identifying microbial strains and functions associated with the disease.


Conflict of interest statement

The authors declare no competing financial interests.

Figures

Fig. 1
Fig. 1
Major genera in the ACVD gut microbiome. a PCA of genus-level ACVD gut microbiomes. Control samples, n = 187 (cyan); ACVD samples, n = 218 (red). For the ACVD samples (Supplementary Data 1), 205 were stable angina (circles), 8 were unstable angina (triangles), and 5 were acute myocardial infarction (AMI) (squares). Genera with the largest weights on each principal component are shown. b Relative abundances of the top 20 most abundant genera. The genus names were colored according to significant differences between the ACVD and control samples, i.e., red or cyan, q-value <0.01; light red or green, q-value <0.05; black, q-value ≥0.05, Wilcoxon rank-sum test, controlled for multiple testing. Boxes represent the median and interquartile ranges (IQRs) between the first and third quartiles; whiskers represent the lowest or highest values within 1.5 times IQR from the first or third quartiles. Circles represent all data points. c Differentially changed genera in ACVD and controls according to dbRDA based on Bray–Curtis distance. Genera with the largest weights on each principal coordinate are shown. CAP constrained analysis of principal coordinates
Fig. 2
Fig. 2
Co-abundance network of MLGs differentially enriched in individuals with and without ACVD. Left, network in healthy controls (n = 187); right, network in individuals with ACVD (n = 218), arranged in the same order. MLGs (>100 genes) whose relative abundances were significantly different between the groups are shown (q-value <0.05, FDR-controlled Wilcoxon rank-sum test). Red circles, ACVD-enriched; cyan circles, control-enriched. The size of each circle indicates the number of genes in an MLG (100–3723). MLGs not annotated to a known species are shown with their identification number only. Please see Supplementary Data 3 for more information on taxonomic annotations. Green edges, positive correlations; red edges, negative correlations. The width of the edges decreases with the absolute value of the Spearman’s cc: thick edges, |cc| > 0.7; medium, 0.5 < |cc| < 0.7; thin, 0.3 < |cc| < 0.5
Fig. 3
Fig. 3
Gut microbiome-based identification of ACVD. Receiver operating curve (ROC, red) according to cross-validated random forest models on MLGs (fivefold RFCV performed five times) from stool samples of 218 ACVD and 187 healthy individuals. The 47 MLGs selected are shown in Supplementary Fig. 5 and Supplementary Data 3. The 95% confidence intervals (CIs) of the AUCs are shown in parentheses. The blue line indicates ROC based on TMA lyases (CutC/D, YeaW/X), with its corresponding ACVD probability shown in Supplementary Data 8 and Supplementary Table 3. The best cutoff points were marked on the ROCs
Fig. 4
Fig. 4
Associations between ACVD-enriched or depleted MLGs and clinical indices. Differentially enriched MLGs (q-value <0.05, FDR-controlled Wilcoxon rank-sum test, Fig. 2, Supplementary Data 3) were analyzed for associations with clinical indices (Supplementary Data 1). ACVD-enriched MLGs are represented by red circles, and control-enriched MLGs are represented by cyan circles. The size of each circle indicates the number of genes in an MLG (100–3723, detailed in Supplementary Data 3). Associations were defined as permutational Wilcoxon rank-sum test P-value for Spearman correlation <0.05, |Spearman’s cc| ≥ 0.2 and selected by an MLG-based RFCV model for the clinical index. The thicker lines had a stronger association of |Spearman’s cc| > 0.25. Green lines indicate positive association, and red lines—negative associations. Dotted grey lines indicate correlations between MLGs in the control samples, as shown in Fig. 2. Clinical indices: age, ALB (albumin), ALT, APOA, APOB, AST, BMI (body mass index), BUN (blood urea nitrogen), CHOL (cholesterol), CKMB, CREA (creatinine), DBIL (direct bilirubin), diastolic BP (diastolic blood pressure), HBDH, HDLC (high-density lipoprotein cholesterol), hip (hip circumference), LDLC (LDL cholesterol), Lpa (lysophosphatidic acid), systolic BP (systolic blood pressure), TBIL, TP (total protein), TRIG (triglyceride), URIC (uric acid), and waist-to-hip ratio
Fig. 5
Fig. 5
Performance of random forest classifiers for ACVD samples stratified by medication. a ROC for two-way classification models of ACVD patients with and without the drug and healthy controls. Fivefold cross-validation repeated five times. Numbers of individuals treated with each drug are given in Supplementary Data 2. b AUC and Youden’s index for the ROC plots in a
Fig. 6
Fig. 6
Alterations in gut microbial functional modules in ACVD and other diseases. a PTS transport systems. b Amino acid transporters. c Vitamin metabolism. d LPS biosynthesis. Red, case-enriched; cyan, control-enriched, compared within each disease cohort (ACVD, total n = 405 including 218 cases; cirrhosis, total n = 231 including 120 cases; obesity, total n = 151 including 72 cases; T2D, total n = 345 including 171 cases; RA, total n = 169 including 95 cases). Dashed lines indicate a reporter score of 1.96, corresponding to 95% confidence in a normal distribution
Fig. 7
Fig. 7
Differential enrichment of membrane transport pathways, lipid metabolism pathways, and modules for host glycan degradation. X-axis represents reporter score. Red, case-enriched; cyan, control-enriched, compared within each disease cohort (ACVD, total n = 405 including 218 cases; Cirrhosis, total n = 231 including 120 cases; Obesity, total n = 151 including 72 cases; T2D, total n = 345 including 171 cases; RA, total n = 169 including 95 cases). Dashed lines indicate a reporter score of 1.96, corresponding to 95% confidence in a normal distribution
Fig. 8
Fig. 8
Abundance differences in specific gut microbial KOs in ACVD and other diseases. a Enzymes for production of SCFAs. b Enzymes for TMA production. CutD is an activator for CutC. The cohort names were colored according to the direction of enrichment, i.e. green and red for control- and case-enriched, respectively within each disease cohort (ACVD, total n = 405 including 218 cases; Cirrhosis, total n = 231 including 120 cases; Obesity, total n = 151 including 72 cases; T2D, total n = 345 including 171 cases; RA, total n = 169 including 95 cases). Wilcoxon rank-sum test, P-value < 0.01; light green and light red, Wilcoxon rank-sum test 0.01 ≤ P-value < 0.05; black, P-value ≥ 0.05. Boxes represent the median and interquartile ranges (IQRs) between the first and third quartiles; whiskers represent the lowest or highest values within 1.5 times IQR from the first or third quartiles. Circles represent all data points

References

    1. Aron-Wisnewsky J, Clément K. The gut microbiome, diet, and links to cardiometabolic and chronic disorders. Nat. Rev. Nephrol. 2016;12:169–181. doi: 10.1038/nrneph.2015.191. - DOI - PubMed
    1. Clemente JC, Ursell LK, Parfrey LW, Knight R. The impact of the gut microbiota on human health: an integrative view. Cell. 2012;148:1258–1270. doi: 10.1016/j.cell.2012.01.035. - DOI - PMC - PubMed
    1. Wang J, Jia H. Metagenome-wide association studies: fine-mining the microbiome. Nat. Rev. Microbiol. 2016;14:508–522. doi: 10.1038/nrmicro.2016.83. - DOI - PubMed
    1. Qin J, et al. A metagenome-wide association study of gut microbiota in type 2 diabetes. Nature. 2012;490:55–60. doi: 10.1038/nature11450. - DOI - PubMed
    1. Karlsson FH, et al. Gut metagenome in European women with normal, impaired and diabetic glucose control. Nature. 2013;498:99–103. doi: 10.1038/nature12198. - DOI - PubMed

Publication types