The chromosomal organization of horizontal gene transfer in bacteria
- PMID: 29018197
- PMCID: PMC5635113
- DOI: 10.1038/s41467-017-00808-w
The chromosomal organization of horizontal gene transfer in bacteria
Erratum in
-
Author Correction: The chromosomal organization of horizontal gene transfer in bacteria.Nat Commun. 2020 Feb 26;11(1):1155. doi: 10.1038/s41467-020-15091-5. Nat Commun. 2020. PMID: 32103021 Free PMC article.
Abstract
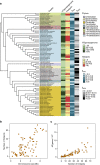
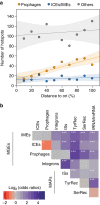
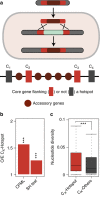
Bacterial adaptation is accelerated by the acquisition of novel traits through horizontal gene transfer, but the integration of these genes affects genome organization. We found that transferred genes are concentrated in only ~1% of the chromosomal regions (hotspots) in 80 bacterial species. This concentration increases with genome size and with the rate of transfer. Hotspots diversify by rapid gene turnover; their chromosomal distribution depends on local contexts (neighboring core genes), and content in mobile genetic elements. Hotspots concentrate most changes in gene repertoires, reduce the trade-off between genome diversification and organization, and should be treasure troves of strain-specific adaptive genes. Most mobile genetic elements and antibiotic resistance genes are in hotspots, but many hotspots lack recognizable mobile genetic elements and exhibit frequent homologous recombination at flanking core genes. Overrepresentation of hotspots with fewer mobile genetic elements in naturally transformable bacteria suggests that homologous recombination and horizontal gene transfer are tightly linked in genome evolution.Horizontal gene transfer (HGT) is an important mechanism for genome evolution and adaptation in bacteria. Here, Oliveira and colleagues find HGT hotspots comprising ~ 1% of the chromosomal regions in 80 bacterial species.
Conflict of interest statement
The authors declare no competing financial interests.
Figures


Similar articles
-
Mobile elements drive recombination hotspots in the core genome of Staphylococcus aureus.Nat Commun. 2014 May 23;5:3956. doi: 10.1038/ncomms4956. Nat Commun. 2014. PMID: 24853639 Free PMC article.
-
The extent and characteristics of DNA transfer between plasmids and chromosomes.Curr Biol. 2024 Jul 22;34(14):3189-3200.e5. doi: 10.1016/j.cub.2024.06.030. Epub 2024 Jul 3. Curr Biol. 2024. PMID: 38964320
-
Bacterial Transformation Buffers Environmental Fluctuations through the Reversible Integration of Mobile Genetic Elements.mBio. 2020 Mar 3;11(2):e02443-19. doi: 10.1128/mBio.02443-19. mBio. 2020. PMID: 32127449 Free PMC article.
-
The interplay of homologous recombination and horizontal gene transfer in bacterial speciation.Methods Mol Biol. 2009;532:29-53. doi: 10.1007/978-1-60327-853-9_3. Methods Mol Biol. 2009. PMID: 19271178 Review.
-
Origins of bacterial diversity through horizontal genetic transfer and adaptation to new ecological niches.FEMS Microbiol Rev. 2011 Sep;35(5):957-76. doi: 10.1111/j.1574-6976.2011.00292.x. Epub 2011 Jul 29. FEMS Microbiol Rev. 2011. PMID: 21711367 Review.
Cited by
-
Solanimycin: Biosynthesis and Distribution of a New Antifungal Antibiotic Regulated by Two Quorum-Sensing Systems.mBio. 2022 Dec 20;13(6):e0247222. doi: 10.1128/mbio.02472-22. Epub 2022 Oct 10. mBio. 2022. PMID: 36214559 Free PMC article.
-
Chromosome Architecture and Gene Content of the Emergent Pathogen Acinetobacter haemolyticus.Front Microbiol. 2020 May 25;11:926. doi: 10.3389/fmicb.2020.00926. eCollection 2020. Front Microbiol. 2020. PMID: 32670207 Free PMC article.
-
Metagenomic methylation patterns resolve bacterial genomes of unusual size and structural complexity.ISME J. 2022 Aug;16(8):1921-1931. doi: 10.1038/s41396-022-01242-7. Epub 2022 Apr 22. ISME J. 2022. PMID: 35459792 Free PMC article.
-
Phages and their satellites encode hotspots of antiviral systems.Cell Host Microbe. 2022 May 11;30(5):740-753.e5. doi: 10.1016/j.chom.2022.02.018. Epub 2022 Mar 21. Cell Host Microbe. 2022. PMID: 35316646 Free PMC article.
-
Antimicrobial Resistance in Bacterial Pathogens and Detection of Carbapenemases in Klebsiella pneumoniae Isolates from Hospital Wastewater.Antibiotics (Basel). 2019 Jun 27;8(3):85. doi: 10.3390/antibiotics8030085. Antibiotics (Basel). 2019. PMID: 31252510 Free PMC article.
References
-
- Thomas CM, Nielsen KM. Mechanisms of, and barriers to, horizontal gene transfer between bacteria. Nat. Rev. Microbiol. 2005;3:711–721. - PubMed
Publication types
MeSH terms
Grants and funding
LinkOut - more resources
Full Text Sources
Other Literature Sources

