

Spatial-temporal distribution of dengue and climate characteristics for two clusters in Sri Lanka from 2012 to 2016
- PMID: 29018222
- PMCID: PMC5635062
- DOI: 10.1038/s41598-017-13163-z
Spatial-temporal distribution of dengue and climate characteristics for two clusters in Sri Lanka from 2012 to 2016
Abstract
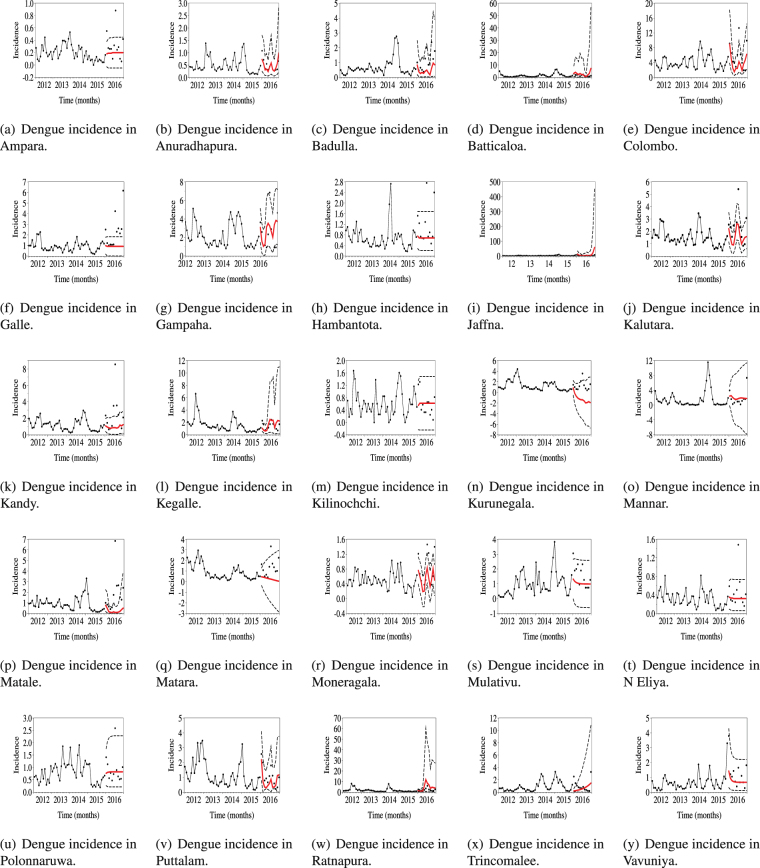
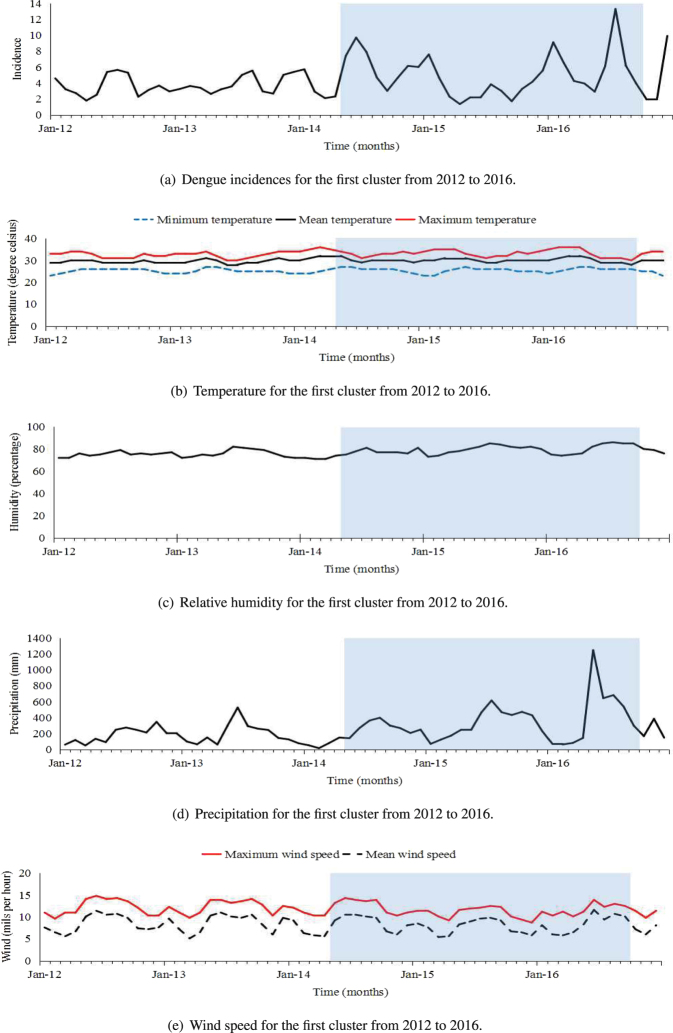
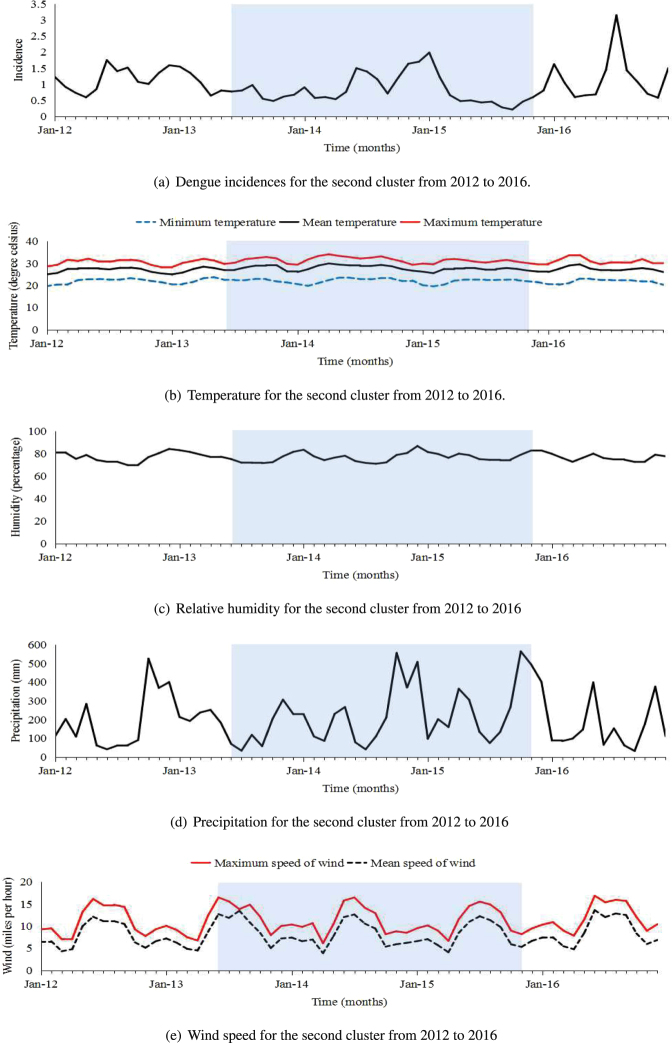
Dengue is a vector-borne disease causing high morbidity and mortality in tropical and subtropical countries. Urbanization, globalization, and lack of effective mosquito control have lead to dramatically increased frequency and magnitude of dengue epidemic in the past 40 years. The virus and the mosquito vectors keep expanding geographically in the tropical regions of the world. Using the hot spot analysis and the spatial-temporal clustering method, we investigated the spatial-temporal distribution of dengue in Sri Lanka from 2012 to 2016 to identify spatial-temporal clusters and elucidate the association of climatic factors with dengue incidence. We detected two important spatial-temporal clusters in Sri Lanka. Dengue incidences were predicted by combining historical dengue incidence data with climate data, and hot and cold spots were forecasted using the predicted dengue incidences to identify areas at high risks. Targeting the hot spots during outbreaks instead of all the regions can save resources and time for public health authorities. Our study helps better understand how climatic factors impact spatial and temporal spread of dengue virus. Hot spot prediction helps public health authorities forecast future high risk areas and direct control measures to minimize cost on health, time, and economy.
Conflict of interest statement
The authors declare that they have no competing interests.
Figures
Similar articles
-
Spatiotemporal patterns of dengue outbreaks in Sri Lanka.Infect Dis (Lond). 2020 May;52(5):350-360. doi: 10.1080/23744235.2020.1725108. Epub 2020 Feb 11. Infect Dis (Lond). 2020. PMID: 32043410
-
Effect of Climatic Factors and Population Density on the Distribution of Dengue in Sri Lanka: A GIS Based Evaluation for Prediction of Outbreaks.PLoS One. 2017 Jan 9;12(1):e0166806. doi: 10.1371/journal.pone.0166806. eCollection 2017. PLoS One. 2017. PMID: 28068339 Free PMC article.
-
Evolution of dengue in Sri Lanka-changes in the virus, vector, and climate.Int J Infect Dis. 2014 Feb;19:6-12. doi: 10.1016/j.ijid.2013.10.012. Epub 2013 Dec 11. Int J Infect Dis. 2014. PMID: 24334026 Review.
-
Fuzzy Multidimensional Model to Cluster Dengue Risk in Sri Lanka.Biomed Res Int. 2020 Nov 4;2020:2420948. doi: 10.1155/2020/2420948. eCollection 2020. Biomed Res Int. 2020. PMID: 33204687 Free PMC article.
-
Leishmaniasis in Sri Lanka: spatial distribution and seasonal variations from 2009 to 2016.Parasit Vectors. 2018 Jan 25;11(1):60. doi: 10.1186/s13071-018-2647-5. Parasit Vectors. 2018. PMID: 29370864 Free PMC article. Review.
Cited by
-
Improving Dengue Forecasts by Using Geospatial Big Data Analysis in Google Earth Engine and the Historical Dengue Information-Aided Long Short Term Memory Modeling.Biology (Basel). 2022 Jan 21;11(2):169. doi: 10.3390/biology11020169. Biology (Basel). 2022. PMID: 35205036 Free PMC article.
-
The Direct and Spillover Effect of Multi-Dimensional Urbanization on PM2.5 Concentrations: A Case Study from the Chengdu-Chongqing Urban Agglomeration in China.Int J Environ Res Public Health. 2021 Oct 10;18(20):10609. doi: 10.3390/ijerph182010609. Int J Environ Res Public Health. 2021. PMID: 34682356 Free PMC article.
-
Breeding Habitat Distribution of Medically Important Mosquitoes in Kurunegala, Gampaha, Kegalle, and Kandy Districts of Sri Lanka and Potential Risk for Disease Transmission: A Cross-Sectional Study.J Trop Med. 2020 Sep 2;2020:7915035. doi: 10.1155/2020/7915035. eCollection 2020. J Trop Med. 2020. PMID: 32934657 Free PMC article.
-
Transmission dynamics of brucellosis: Mathematical modelling and applications in China.Comput Struct Biotechnol J. 2020 Nov 21;18:3843-3860. doi: 10.1016/j.csbj.2020.11.014. eCollection 2020. Comput Struct Biotechnol J. 2020. PMID: 33335683 Free PMC article. Review.
-
Integrating Spatial Modelling and Space-Time Pattern Mining Analytics for Vector Disease-Related Health Perspectives: A Case of Dengue Fever in Pakistan.Int J Environ Res Public Health. 2021 Nov 16;18(22):12018. doi: 10.3390/ijerph182212018. Int J Environ Res Public Health. 2021. PMID: 34831785 Free PMC article.
References
-
- Global strategy for dengue prevention and control, 2012–2020. Tech. Rep., World Health Organization, Geneva, Switzerland (2012).
-
- Gubler D. The global pandemic of dengue/dengue haemorrhagic fever: current status and prospects for the future. Ann Acad Med Singapore. 1998;27:227–234. - PubMed
-
- Gubler D. Epidemic dengue/dengue hemorrhagic fever as a public health, social and economic problem in the 21st century. Ann Acad Med Singapore. 2002;10:100–103. - PubMed
Publication types
MeSH terms
LinkOut - more resources
Full Text Sources
Other Literature Sources
Medical
Miscellaneous
