. 2017 Oct 10;7(1):12905.
doi: 10.1038/s41598-017-13376-2.

S1P1 deletion differentially affects TH17 and Regulatory T cells

Affiliations

S1P1 deletion differentially affects TH17 and Regulatory T cells

Ahmet Eken et al. Sci Rep. .

Abstract

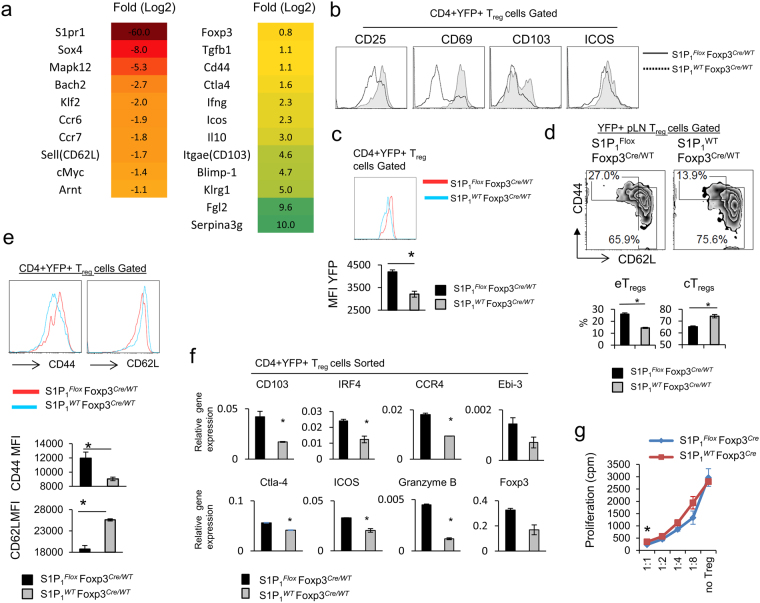
Sphingosine-1 phosphate receptor 1 (S1P1) is critical for the egress of T and B cells out of lymphoid organs. Although S1P1 agonist fingolimod is currently used for the treatment of multiple sclerosis (MS) little is known how S1P1 signaling regulates Th17 and Treg cell homeostasis. To study the impact of S1P1 signaling on Th17 and Treg cell biology, we specifically deleted S1P1 in Th17 and Treg cells using IL-17A Cre and Foxp3 Cre mice, respectively. Deletion of S1P1 in Th17 cells conferred resistance to experimental autoimmune encephalomyelitis (EAE). On the other hand, permanent deletion of S1P1 in Treg cells resulted in autoimmunity and acute deletion rendered mice more susceptible to EAE. Importantly, our study revealed that S1P1 not only regulated the egress of Treg cells out of lymphoid organs and subsequent non-lymphoid tissue distribution but also their phenotypic diversity. Most of the Treg cells found in S1P1-deficient mice as well as MS patients on fingolimod therapy had an activated phenotype and were more prone to apoptosis, thus converted to effector Treg. Our results provide novel insight into the functions of S1P1 and potential impact of long term fingolimod use on Th17 and Treg cell biology and general health in MS patients.


Conflict of interest statement

The authors declare that they have no competing interests.

Figures

Figure 1
Figure 1
S1P1 is required for peripheral organ distribution and in vivo generation of Th17 cells. (a) EAE scores of S1P 1 Flox IL-17A Cre ROSA RFPand control mice (S1P 1 WT IL-17A Cre ROSA RFP) that were immunized with MOG35–55 and Complete Freund’s Adjuvant. N = 5 mice per group, the experiment was repeated three times. (b) IL-17A and IFN-γ expression of CD4+ T cells from central nervous system (CNS) of S1P 1 Flox IL-17A Cre ROSA RFP and control mice 15 days after MOG35–55 immunization (left). The cells were cultured 4 h with PMA/ionomycin and Golgi Plug for intracellular staining. Quantification of flow plots, (right).* indicates p-value <0.05. (c) Th17 and Th1 cell distribution across the peripheral organs in S1P 1 Flox IL-17A Cre ROSA RFP and control mice, 7 days after MOG35–55 immunization, and quantification was shown in (d). (e) Representative flow plot of RFP+ CD4+ cells after rechallenge with media, MOG35–55 or MOG35–55 + IL-23 following the first immunization. (f) IL-17A and IFN-γ production by S1P 1 Flox IL-17A Cre ROSA RFP and control mice in MOG35–55 + IL-23 rechallenge condition.
Figure 2
Figure 2
Treg-specific deletion of S1P1 causes autoimmunity. (a) Representative image of skin lesions that develop around the eyes of 8-week-old S1P 1 Flox Foxp3 Cre compared to S1P 1 WT Foxp3 Cre mice. (b) Representative splenomegaly and lymphadenopathy in 8 weeks-old S1P 1 Flox Foxp3 Cre mice compared to S1P 1 WT Foxp3 Cre mice. (c) Representative section of liver and lung stained with hematoxylin & eosin (H&E) depicting higher lymphocytic infiltrates in 6 weeks-old S1P 1 Flox Foxp3 Cre mice. Arrows point the lymphocytic infiltrates. PV, portal vein in liver; PV, pulmonary vein in lung; B, bronchiole. (d) Colon inflammation and discoloration in 8-week-old S1P 1 Flox Foxp3 Cre mice compared to S1P 1 WT Foxp3 Cre mice. (e) Weight chart indicating lack of weight gain over time in S1P 1 Flox Foxp3 Cre mice. (*) indicates significance, p < 0.05. (f) Elevated systemic TNF-α and IFN-γ levels in the serum of 8 weeks-old S1P 1 Flox Foxp3 Cre mice. (*) indicates significance, p < 0.05. (g) Colorimetric assay measuring hemoglobin in adult S1P 1 Flox Foxp3 Cre mice (*) indicates significance, p < 0.05. A total of 7 to 15 mice per group used for experiments (e–g). (h) Activation status of CD4+ or CD8+ T cells in the blood of 8-week-old S1P 1 Flox Foxp3 Cre compared to S1P 1 WT Foxp3 Cre mice by CD44 and CD62L staining (left) and quantified (right). 3 mice per group used.
Figure 3
Figure 3
S1P1-deficient Treg cells exit thymus but show impaired secondary lymphoid tissue egress and reduced non-lymphoid tissue localization. a) Lymphocytes from various organs of 8-week-old control S1P 1 WT Foxp3 Cre or S1P 1 Flox Foxp3 Cre mice were stained for CD4. Treg (CD4+Foxp3+) distribution was analyzed by flow (representative zebra plots in (a) and quantified in (b), n = 4–7 mice), (*) indicates p < 0.05 quantified. (c) Thymus, spleen and LN from 6–8-week-old mice of indicated genotype were stained for CD45, CD3, CD4, CD25, and CD25+CD4+CD3+ Treg cells gated and among them RFP+ or YFP+ Treg cells visualized. A representative plot is provided.
Figure 4
Figure 4
Acute deletion of S1P1 in Treg cells renders mice more susceptible to EAE. (a) Treatment schematic (Top), and EAE scores after acute deletion of S1P1 in S1P 1 Flox Foxp3 Cre-ERT2 and control S1P 1 WT Foxp3 Cre-ERT2 mice. (b) Absolute number of CNS-infiltrating cells (left), and intracellular staining of CNS-infiltrating CD4+ T cells at the peak of disease in test and control groups as treated in (a). (c) Representative plot for percentage of Treg cell in pLN and CNS at the peak of disease (left) and quantification of Treg percentage (right) in CNS and pLN. (d) Th17 cells in the pLN at the peak of the disease, intracellular staining of draining pLN lymphocytes 4 hours after stimulation with PMA/Ionomycin.
Figure 5
Figure 5
S1P1 deletion intrinsically alters Treg transcriptional program and promotes central to effector Treg switch. (a) Heat Map of differentially regulated transcripts in Treg cells purified from 8 week-old control S1P 1 WT Foxp3 Cre and S1P 1 Flox Foxp3 Cre mice and (b). Surface expression of indicated Treg associated markers on YFP+ WT (dashed line) or S1P1 KO (solid filled line) Treg cells isolated from the LN of healthy female S1P 1 WT Foxp3 Cre/WT mice as control, or S1P 1 Flox Foxp3 Cre/WT mice as KO source (harboring 50% WT 50% S1P1KO Treg due to random X inactivation), and (c) quantification of YFP-Foxp3 protein expression by MFI. d) YFP+ WT or YFP+S1P1KO Treg cells among LN lymphocytes of healthy female S1P 1 WT Foxp3 Cre/WT or S1P 1 Flox Foxp3Cre/WT mice gated. Higher percentages of eTreg cells (CD44+CD62Llow) are observed (bar graphs in (d) bottom panel) and MFI values of CD44 and CD62L are charted for quantification purposes in (e). (f) YFP/Foxp3+ Treg cells were sorted from control S1P 1 WT Foxp3 Cre/WT or S1P 1 Flox Foxp3 Cre/WT female mice and RNA was extracted. Relative gene expression of indicated eTreg associated genes was quantified by real time qPCR. Higher levels of indicated genes detected in S1P1KO Treg cells. (g) In vitro suppression assay performed with Treg cells sorted from 8-week-old WT or S1P 1 Flox Foxp3 Cre mice. (*) indicates <0.05. n = 3–5 mice per group.
Figure 6
Figure 6
Fingolimod promotes the conversion of cTreg cells to eTreg cells in MS patients. (a) Percentage of CD4+CD45RO+CD25+CD127 memory Treg cells in healthy controls, untreated MS patients (no meds), MS patients treated with fingolimod or dimethyl fumarate. Percentage of CD103+ Treg cells (CD4+CD45RO+CD25+CD127) (b) and CD103+ T helper cells (CD4+CD45RO+CD25CD127+) (c) in the same cohort of MS patients and healthy controls as in (a). Data are mean ± SEM of five or six donors in each group. *p < 0.05; **p < 0.01; ***p < 0.001 (ANOVA). Comparison of the number of naïve (CD45RO) (d) or memory (e) Treg cells (CD45RO+) in MS patients before (gray bars) and after (black bars) fingolimod treatment. (f) Increase in Memory Treg cells in individual MS patients after fingolimod treatment. CD103 expression on Treg (g) and T helper (h) cells from MS patients before (grey bars) and after (black bars) fingolimod treatment. Percentage of Foxp3+CCR4+ (i) and Foxp3+CCR4 (j) T cell subsets in MS patients before (filled circle) and after (filled square) fingolimod treatment. Data are mean ± SEM of five to seven donors. *p < 0.05; **p < 0.01; ***p < 0.001 (two-tailed paired t test). All data are presented as frequency among total CD4+ T cells.

References

    1. Chi H. Sphingosine-1-phosphate and immune regulation: Trafficking and beyond. Trends in Pharmacological Sciences. 2011;32:16–24. doi: 10.1016/j.tips.2010.11.002. - DOI - PMC - PubMed
    1. Cinamon G, et al. Sphingosine 1-phosphate receptor 1 promotes B cell localization in the splenic marginal zone. Nat. Immunol. 2004;5:713–720. doi: 10.1038/ni1083. - DOI - PubMed
    1. Matloubian M, et al. Lymphocyte egress from thymus and peripheral lymphoid organs is dependent on S1P receptor 1. Nature. 2004;427:355–360. doi: 10.1038/nature02284. - DOI - PubMed
    1. Allende ML, Dreier JL, Mandala S, Proia RL. Expression of the Sphingosine 1-Phosphate Receptor, S1P1, on T-cells Controls Thymic Emigration. J. Biol. Chem. 2004;279:15396–15401. doi: 10.1074/jbc.M314291200. - DOI - PubMed
    1. Pappu R, et al. Promotion of Lymphocyte Egress into Blood and Lymph by Distinct Sources of Sphingosine-1-Phosphate. Science (80-.). 2007;316:295–298. doi: 10.1126/science.1139221. - DOI - PubMed

Publication types

MeSH terms

Substances

LinkOut - more resources