

Atmospheric observations show accurate reporting and little growth in India's methane emissions
- PMID: 29018226
- PMCID: PMC5635116
- DOI: 10.1038/s41467-017-00994-7
Atmospheric observations show accurate reporting and little growth in India's methane emissions
Abstract
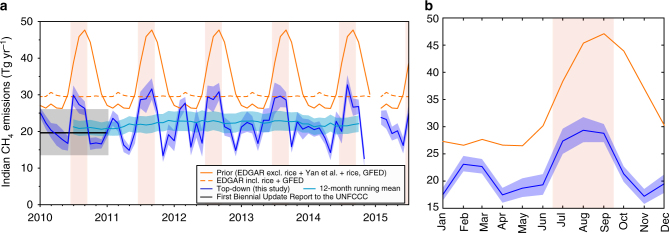
Changes in tropical wetland, ruminant or rice emissions are thought to have played a role in recent variations in atmospheric methane (CH4) concentrations. India has the world's largest ruminant population and produces ~ 20% of the world's rice. Therefore, changes in these sources could have significant implications for global warming. Here, we infer India's CH4 emissions for the period 2010-2015 using a combination of satellite, surface and aircraft data. We apply a high-resolution atmospheric transport model to simulate data from these platforms to infer fluxes at sub-national scales and to quantify changes in rice emissions. We find that average emissions over this period are 22.0 (19.6-24.3) Tg yr-1, which is consistent with the emissions reported by India to the United Framework Convention on Climate Change. Annual emissions have not changed significantly (0.2 ± 0.7 Tg yr-1) between 2010 and 2015, suggesting that major CH4 sources did not change appreciably. These findings are in contrast to another major economy, China, which has shown significant growth in recent years due to increasing fossil fuel emissions. However, the trend in a global emission inventory has been overestimated for China due to incorrect rate of fossil fuel growth. Here, we find growth has been overestimated in India but likely due to ruminant and waste sectors.India's methane emissions have been quantified using atmospheric measurements to provide an independent comparison with reported emissions. Here Ganesan et al. find that derived methane emissions are consistent with India's reports and no significant trend has been observed between 2010-2015.
Conflict of interest statement
The authors declare no competing financial interests.
Figures
References
-
- Myhre, G. et al. In Contribution of Working Group I to the Fifth Assessment Report of the Intergovernmental Panel on Climate Change (Eds Stocker, T. F. et al.) 659–740 (Cambridge University Press, 2013).
-
- Ko, M., Newman, P., Reimann, S., Strahan, S. SPARC Report on Lifetimes of Stratospheric Ozone-Depleting Substances, Their Replacements, and Related Species. SPARC Report No. 6, (2013).
-
- European Commission, Joint Research Centre (JRC)/Netherlands Environmental Assessment Agency (PBL), Emission Database for Global Atmospheric Research (EDGAR), release EDGARv4.2 FT2012, http://edgar.jrc.ec.europa.eu. (2014).
-
- European Commission, Joint Research Centre (JRC)/Netherlands Environmental Assessment Agency (PBL), Emission Database for Global Atmospheric Research (EDGAR), release EDGARv4.2 FT2010, http://edgar.jrc.ec.europa.eu. (2013).
Publication types
LinkOut - more resources
Full Text Sources
Other Literature Sources
Miscellaneous
