. 2017 Sep 22:8:729.
doi: 10.3389/fphys.2017.00729. eCollection 2017.

Xiao-Yao-San, a Chinese Medicine Formula, Ameliorates Chronic Unpredictable Mild Stress Induced Polycystic Ovary in Rat

Affiliations

Xiao-Yao-San, a Chinese Medicine Formula, Ameliorates Chronic Unpredictable Mild Stress Induced Polycystic Ovary in Rat

Hao-Yu Sun et al. Front Physiol. .

Abstract

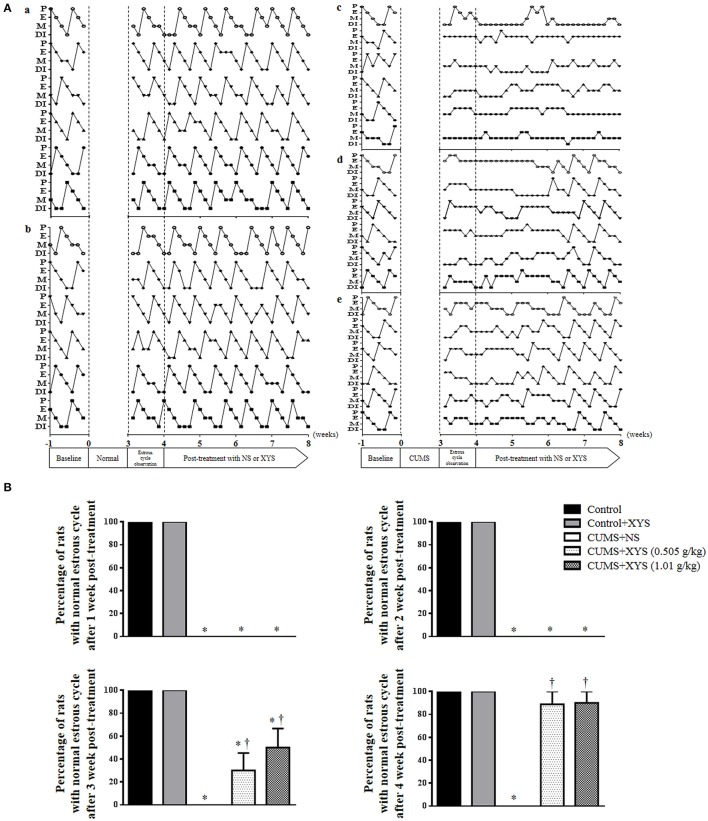
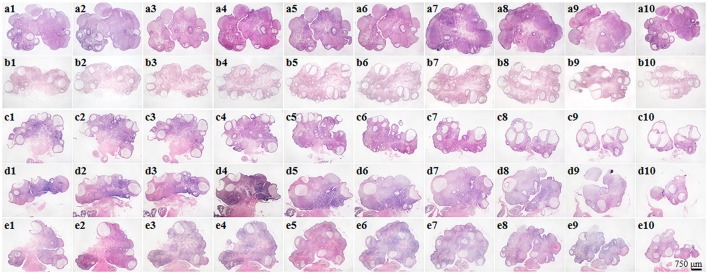
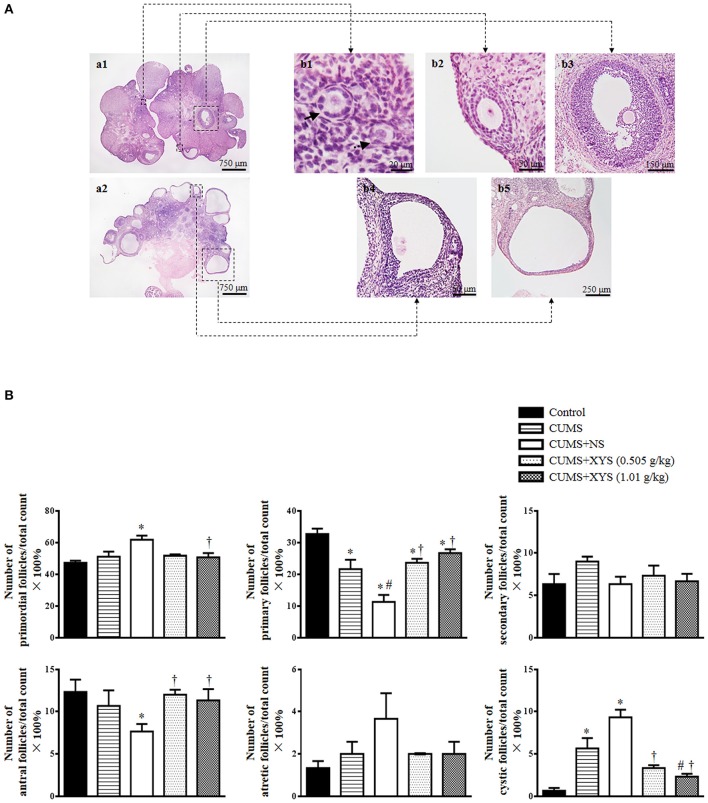
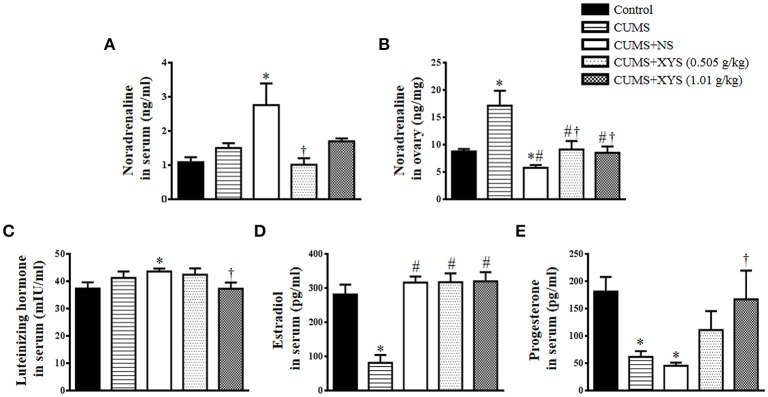
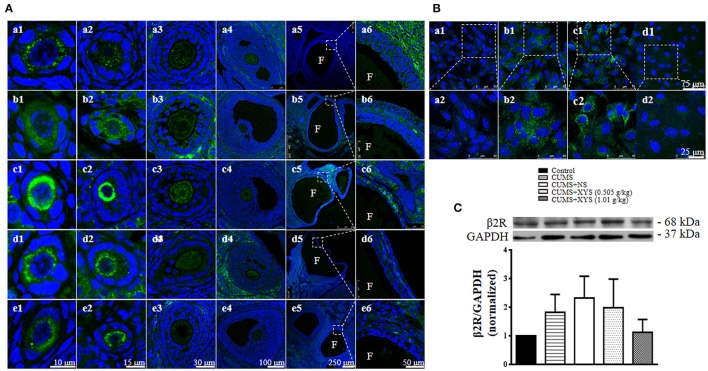
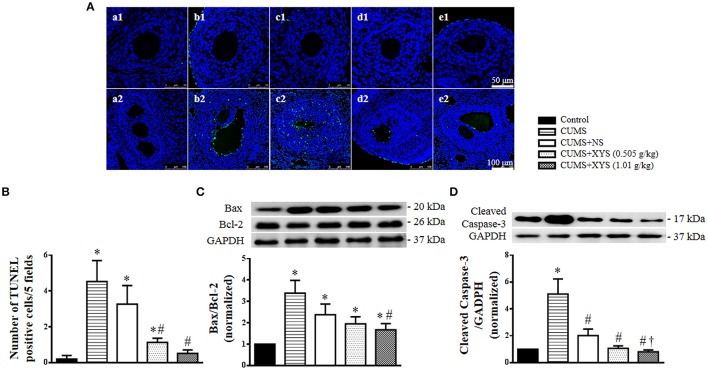
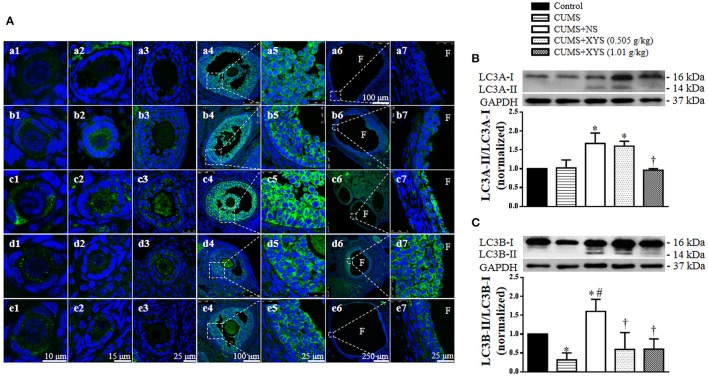
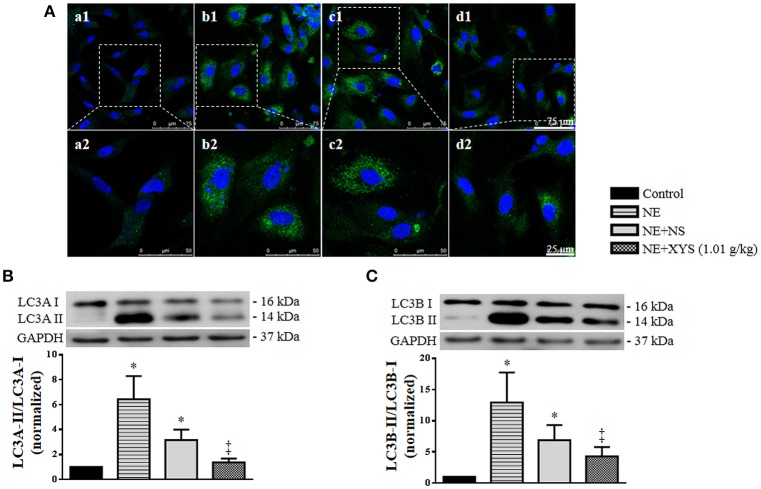
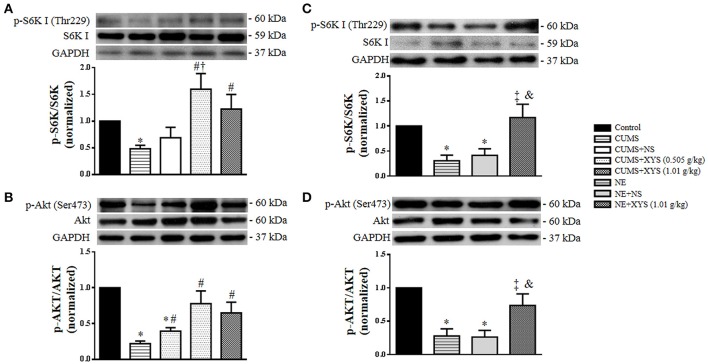
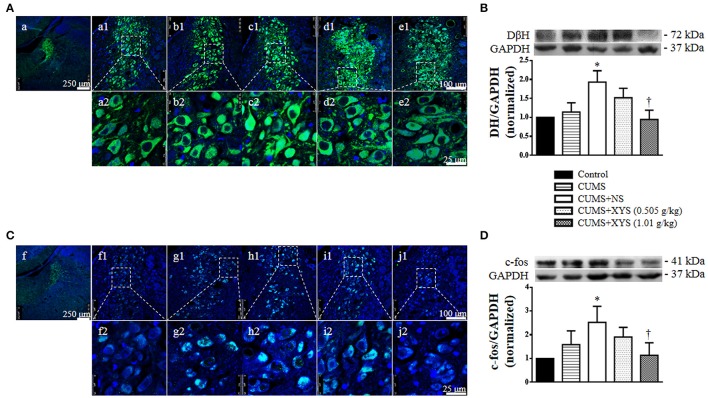
Chronic stress induces endocrine disturbance, which contributes to the development of polycystic ovary syndrome (PCOS), a condition that remains a challenge for clinicians to cope with. The present study investigated the effect of Xiao-Yao-San (XYS), a traditional Chinese medicine formula used for treatment of gynecological disease, on the chronic stress-induced polycystic ovary and its underlying mechanism. Female Sprague-Dwaley rats underwent a 3 weeks chronic unpredictable mild stress (CUMS) procedure to establish the PCOS model, followed by 4 weeks treatment with XYS (0.505 g/kg or 1.01 g/kg) by gavage. Granulosa cells were exposed to noradrenaline (1 mM) in vitro for 24 h, followed by incubation with or without XYS-treated rat serum for 24 h. Post-treatment with XYS ameliorated CUMS-induced irregular estrous cycles and follicles development abnormalities, decrease of estradiol and progesterone level as well as increase of luteinizing hormone in serum, reduced cystic follicles formation and the apoptosis and autophagy of granulosa cells, attenuated the increase in dopamine beta hydroxylase and c-fos level in locus coeruleus, the noradrenaline level in serum and ovarian tissue, and the expression of beta 2 adrenergic receptor in ovarian tissue. Besides, XYS alleviated the reduction of phosphorylation of ribosomal protein S6 kinase polypeptide I and protein kinase B, as well as the increase of microtubule-associated protein light chain 3-I to microtubule-associated protein light chain 3-II conversion both in vivo and in vitro. This study demonstrated XYS as a potential strategy for CUMS induced polycystic ovary, and suggested that the beneficial role of XYS was correlated with the regulation of the sympathetic nerve activity.

Keywords: beta 2 adrenergic receptor; chronic unpredictable stress; granulosa cells autophagy; noradrenaline; polycystic ovary.


Figures

Figure 1
Figure 1
Effect of XYS post-treatment on rat estrous cycle. (A) Representative images exhibiting the changes of estrous cycle in Control (a), Control+XYS (1.01 g/kg) (b), CUMS+NS (c), CUMS+XYS (0.505 g/kg) (d), and CUMS+XYS (1.01 g/kg) (e) group, respectively. P, preoestrus; E, estrus; M, metaoestrus; DI, diestrus. (B) Statistical result of the percentage of rats with normal estrous cycle after 1, 2, 3, and 4 weeks XYS post-treatment. Results are presented as mean ± SE. *P < 0.05 vs. Control group; P < 0.05 vs. CUMS+NS group, n = 11.
Figure 2
Figure 2
Effect of XYS post-treatment on histology of the ovarian tissue. Representative 10 sections of HE staining images of rat ovarian tissue in Control (a1–a10), CUMS (b1–b10), CUMS+NS (c1–c10), CUMS+XYS (0.505 g/kg) (d1–d10), and CUMS+XYS (1.01 g/kg) (e1–e10) group, respectively.
Figure 3
Figure 3
Effect of XYS post-treatment on follicle development of the ovary. (A) Representative HE staining images of rat ovarian tissue (a1,a2). The area within the rectangle in each image in left panel is enlarged and presented right, exhibiting the representative images of primordial follicle (b1, dotted arrow), primary follicle (b1, solid arrow), secondary follicle (b2), antral follicle (b3), atretic follicle (b4), and cystic follicle (b5), respectively. (B) Statistical result of the percentage of the follicles in different development stages in various groups. Results are presented as mean ± SE. *P < 0.05 vs. Control group; #P < 0.05 vs. CUMS group; P < 0.05 vs. CUMS+NS group, n = 3.
Figure 4
Figure 4
Effect of XYS post-treatment on the level of NE, luteinizing hormone, estradiol, and progesterone in rats. (A) NE concentration in serum in different groups. (B) NE concentration in ovarian tissue from different groups. (C) Luteinizing hormone in serum from different groups. (D) Estradiol in serum from different groups. (E) Progesterone in serum from different groups. Results are presented as mean±SE. *P < 0.05 vs. Control group; #P < 0.05 vs. CUMS group; P < 0.05 vs. CUMS+NS group, n = 8.
Figure 5
Figure 5
Effect of XYS post-treatment on the expression of β2R in ovarian tissue. (A) Representative immunofluorescence confocal images of primordial follicles (1, bar = 10 μm), primary follicles (2, bar = 15 μm), secondary follicles (3, bar = 30 μm), antral follicles (4, bar = 100 μm), cystic follicles (5, bar = 250 μm) and enlarged images of cystic follicles (6, bar = 50 μm) in Control (a), CUMS (b), CUMS+NS (c), CUMS+XYS (0.505 g/kg) (d), and CUMS+XYS (1.01 g/kg) (e) group, respectively. F, follicular antrum. The sections were immunochemically stained for β2R (green) and nuclei (blue). (B) Representative immunofluorescence confocal images of granulosa cells in Control (a), NE (b), NE+NS (c), NE+XYS (1.01 g/kg) (d) group, respectively. The areas inside the rectangle of upper panel (1) are shown in the lower penal (2) at high magnification. The sections were immunochemically stained for β2R (green) and nuclei (blue). (C) Western blot for the expression of β2R in different groups with the quantification of β2R showing below. Results were presented as mean ± SE. No difference was noted among groups, n = 4.
Figure 6
Figure 6
Effect of XYS post-treatment on the apoptosis of granulosa cells in ovarian tissue. (A) Representative TUNEL staining images of secondary follicles (1), and antral follicles (2) in Control (a), CUMS (b), CUMS+NS (c), CUMS+XYS (0.505 g/kg) (d), and CUMS+XYS (1.01 g/kg) (e) group, respectively. TUNEL positive cells are stained green. (B) Statistical result of number of TUNEL positive cells per 5 fields. (C) Western blot for the expression of Bax and Bcl-2 in different groups with the quantification of Bax/Bcl-2 showing below. (D) Western blot for the expression of cleaved caspase-3 in different groups with the quantification of cleaved caspase-3 showing below. Results are presented as mean ± SE. *P < 0.05 vs. Control group; #P < 0.05 vs. CUMS group; P < 0.05 vs. CUMS+NS group, n = 3 for TUNEL staining, n = 4 for western blot.
Figure 7
Figure 7
Effect of XYS post-treatment on the autophagy of granulosa cells in ovarian tissue. (A) Representative immunofluorescence confocal images of primordial follicles (1), primary follicles (2), secondary follicles (3), antral follicles (4), enlarged images of antral follicles (5), cystic follicles (6), and enlarged images of cystic follicles (7) in Control (a), CUMS (b), CUMS+NS (c), CUMS+XYS (0.505 g/kg) (d), and CUMS+XYS (1.01 g/kg) (e) group, respectively. F, follicular antrum. The sections were immunochemically stained for LC3A (green) and nuclei (blue). (B) Western blot for the expression of LC3A in different groups with the quantification of LC3A showing below. (C) Western blot for the expression of LC3B in different groups with the quantification of LC3B showing below. Results are presented as mean ± SE. *P < 0.05 vs. Control group; #P < 0.05 vs. CUMS group; P < 0.05 vs. CUMS+NS group, n = 4.
Figure 8
Figure 8
Effect of XYS post-treatment on the autophagy of cultured granulosa cells. (A) Representative immunofluorescence confocal images of granulosa cells in Control (a), NE (b), NE+NS (c), and NE+XYS (1.01 g/kg) (d) group, respectively. The upper panel (1) is low magnification of the images, the areas inside the rectangle are shown in the lower penal (2) at high magnification. The sections were immunochemically stained for LC3A (green) and nuclei (blue). (B) Western blot for the expression of LC3A in different groups with the quantification of LC3A showing below. (C) Western blot for the expression of LC3B in different groups with the quantification of LC3B showing below. Results are presented as mean ± SE. *P < 0.05 vs. Control group; P < 0.05 vs. NE group, n = 4.
Figure 9
Figure 9
Effect of XYS post-treatment on the phosphorylation of S6K I and Akt in ovarian tissue and cultured granulosa cells. (A) Western blot for the phosphorylation of S6K I in ovarian tissue from different groups with the quantification of phosphorylation of S6K I showing below. (B) Western blot for the phosphorylation of Akt in ovarian tissue from different groups with the quantification of phosphorylation of Akt showing below. (C) Western blot for the phosphorylation of S6K I in cultured granulosa cells from different groups with the quantification of phosphorylation of S6K I showing below. (D) Western blot for the phosphorylation of Akt in cultured granulosa cells from different groups with the quantification of phosphorylation of Akt showing below. Results are presented as mean ± SE. *P < 0.05 vs. Control group; #P < 0.05 vs. CUMS group; P < 0.05 vs. CUMS+NS group; P < 0.05 vs. NE group; &P < 0.05 vs. NE+NS group, n = 4.
Figure 10
Figure 10
Effect of XYS post-treatment on expression of DβH and c-fos in locus coeruleus. (A) Representative immunofluorescence confocal images of locus coeruleus in Control (a), CUMS (b), CUMS+NS (c), CUMS+XYS (0.505 g/kg) (d), and CUMS+XYS (1.01 g/kg) (e) group, respectively. The upper panel (1) is low magnification of the images, the areas inside the rectangle are shown in the lower penal (2) at high magnification. The sections were immunochemically stained for DβH (green) and nuclei (blue). (B) Western blot for the expression of DβH in locus coeruleus of different groups with the quantification of DβH showing below. (C) Representative immunofluorescence confocal images of locus coeruleus in Control (f), CUMS (g), CUMS+NS (h), CUMS+XYS (0.505 g/kg) (i), and CUMS+XYS (1.01 g/kg) (j) group, respectively. The upper panel (1) is low magnification of the images, the areas inside the rectangle are shown in the lower penal (2) at high magnification. The sections were immunochemically stained for c-fos (green) and nuclei (blue). (D) Western blot for the expression of c-fos in locus coeruleus of different groups with the quantification of c-fos showing below. Results are presented as mean ± SE. *P < 0.05 vs. Control group; P < 0.05 vs. CUMS+NS group, n = 4.

Similar articles

Cited by

References

    1. Abedini A., Zamberlam G., Lapointe E., Touriqny C., Boyer A., Paquet M., et al. . (2016). WNT5a is required for normal ovarian follicle development and antagonizes gonadotropin responsiveness in granulosa cells by suppressing canonical WNT signaling. FASEB J. 30, 1534–1547. 10.1096/fj.15-280313 - DOI - PMC - PubMed
    1. Acuna E., Fornes R., Fernandois D., Garrido M. P., Greiner M., Lara H. E. (2009). Increases in norepinephrine release and ovarian cyst formation during ageing in the rat. Reprod. Biol. Endocrinol. 7:64. 10.1186/1477-7827-7-64 - DOI - PMC - PubMed
    1. Cao B., Zhang Z. H., Zhang Y. Q., Li J. Q., Liang G., Li J. H. (2013). Effect of Smilax china L.-containing serum on the expression of POLD1 mRNA in human hepatocarcinoma SMMC-7721 cells. Exp. Ther. Med. 6, 1070–1076. 10.3892/etm.2013.1264 - DOI - PMC - PubMed
    1. Cesta C. E., Månsson M., Palma C., Lichtenstein P., Iliadou A. N., Landén M. (2016). Polycystic ovary syndrome and psychiatric disorders: Co-morbidityand heritability in a nationwide Swedish cohort. Psychoneuroendocrinology 73, 196–203. 10.1016/j.psyneuen.2016.08.005 - DOI - PubMed
    1. Chang R. J., Andersen H. C. (2013). Disordered follicle development. Mol. Cell. Endocrinol. 373, 51–60. 10.1016/j.mce.2012.07.011 - DOI - PMC - PubMed

LinkOut - more resources