

Sequencing of Single Pollen Nuclei Reveals Meiotic Recombination Events at Megabase Resolution and Circumvents Segregation Distortion Caused by Postmeiotic Processes
- PMID: 29018459
- PMCID: PMC5623100
- DOI: 10.3389/fpls.2017.01620
Sequencing of Single Pollen Nuclei Reveals Meiotic Recombination Events at Megabase Resolution and Circumvents Segregation Distortion Caused by Postmeiotic Processes
Abstract
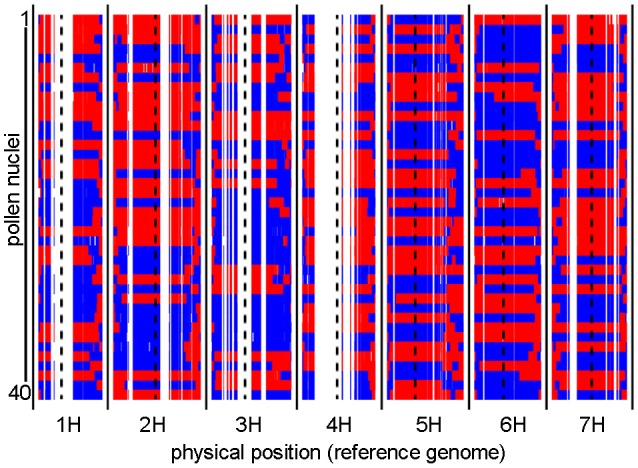
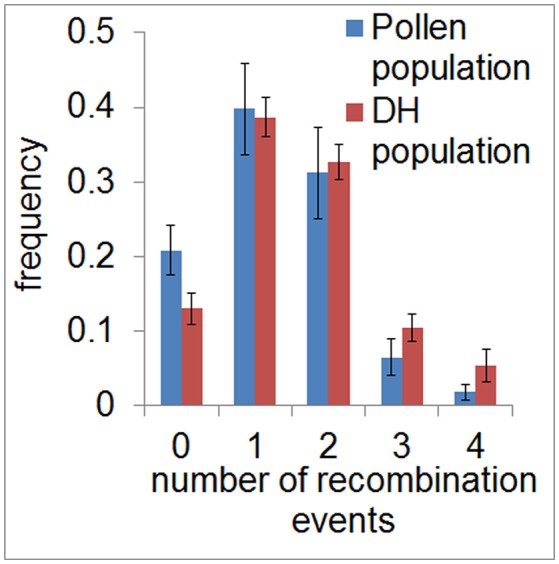
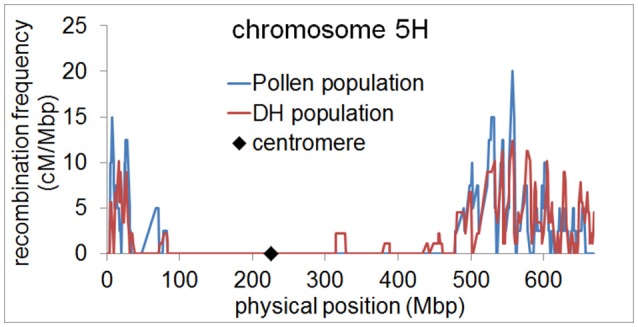
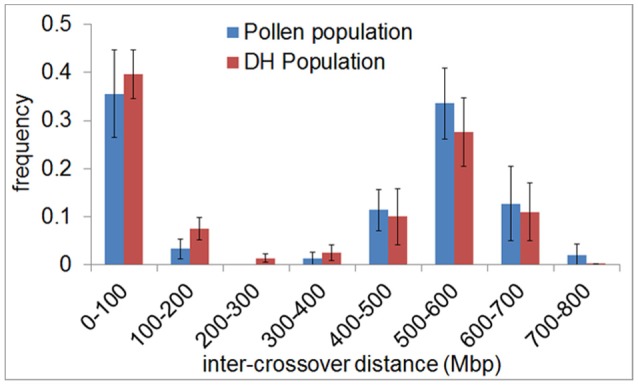
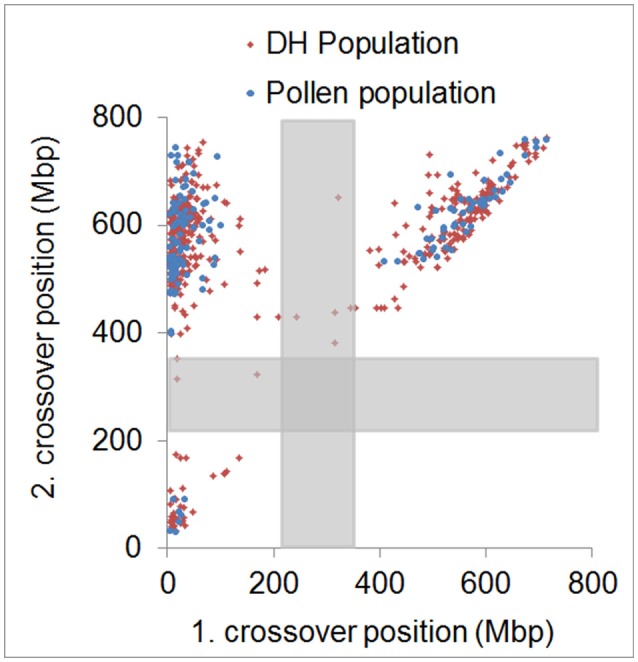
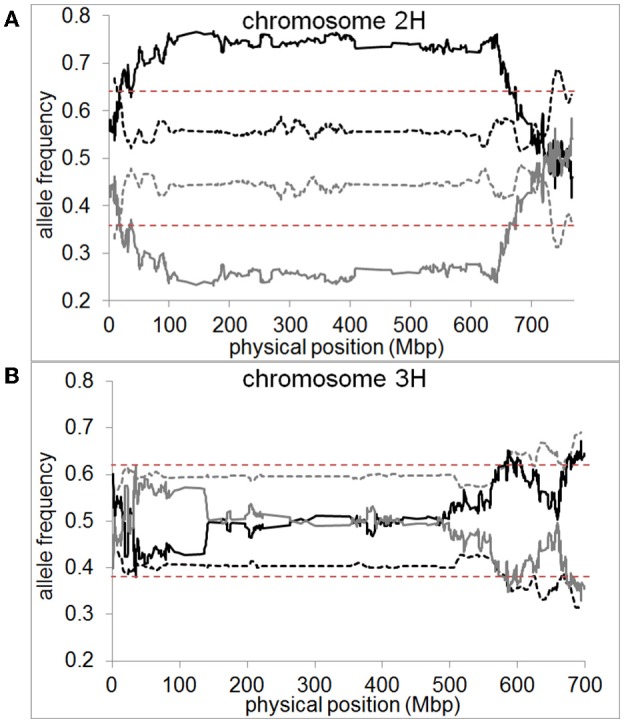
Meiotic recombination is a fundamental mechanism to generate novel allelic combinations which can be harnessed by breeders to achieve crop improvement. The recombination landscape of many crop species, including the major crop barley, is characterized by a dearth of recombination in 65% of the genome. In addition, segregation distortion caused by selection on genetically linked loci is a frequent and undesirable phenomenon in double haploid populations which hampers genetic mapping and breeding. Here, we present an approach to directly investigate recombination at the DNA sequence level by combining flow-sorting of haploid pollen nuclei of barley with single-cell genome sequencing. We confirm the skewed distribution of recombination events toward distal chromosomal regions at megabase resolution and show that segregation distortion is almost absent if directly measured in pollen. Furthermore, we show a bimodal distribution of inter-crossover distances, which supports the existence of two classes of crossovers which are sensitive or less sensitive to physical interference. We conclude that single pollen nuclei sequencing is an approach capable of revealing recombination patterns in the absence of segregation distortion.
Keywords: crossover; crossover interference; homologous recombination; meiosis; pollen; segregation distortion; single-cell genomics.
Figures
Similar articles
-
Tackling Plant Meiosis: From Model Research to Crop Improvement.Front Plant Sci. 2018 Jun 19;9:829. doi: 10.3389/fpls.2018.00829. eCollection 2018. Front Plant Sci. 2018. PMID: 29971082 Free PMC article. Review.
-
Quantification of Recombination Rate and Segregation Distortion by Genotyping and Sequencing of Single Pollen Nuclei.Methods Mol Biol. 2020;2061:281-300. doi: 10.1007/978-1-4939-9818-0_20. Methods Mol Biol. 2020. PMID: 31583667
-
Measuring Meiotic Crossovers via Multi-Locus Genotyping of Single Pollen Grains in Barley.PLoS One. 2015 Sep 10;10(9):e0137677. doi: 10.1371/journal.pone.0137677. eCollection 2015. PLoS One. 2015. PMID: 26356084 Free PMC article.
-
High-throughput measuring of meiotic recombination rates in barley pollen nuclei using Crystal Digital PCRTM.Plant J. 2021 Jul;107(2):649-661. doi: 10.1111/tpj.15305. Epub 2021 Jun 23. Plant J. 2021. PMID: 33949030
-
Meiotic recombination hotspots - a comparative view.Plant J. 2015 Jul;83(1):52-61. doi: 10.1111/tpj.12870. Epub 2015 May 20. Plant J. 2015. PMID: 25925869 Review.
Cited by
-
Tackling Plant Meiosis: From Model Research to Crop Improvement.Front Plant Sci. 2018 Jun 19;9:829. doi: 10.3389/fpls.2018.00829. eCollection 2018. Front Plant Sci. 2018. PMID: 29971082 Free PMC article. Review.
-
Analysis of Crossover Events and Allele Segregation Distortion in Interspecific Citrus Hybrids by Single Pollen Genotyping.Front Plant Sci. 2020 May 25;11:615. doi: 10.3389/fpls.2020.00615. eCollection 2020. Front Plant Sci. 2020. PMID: 32523591 Free PMC article.
-
From molecules to populations: appreciating and estimating recombination rate variation.Nat Rev Genet. 2020 Aug;21(8):476-492. doi: 10.1038/s41576-020-0240-1. Epub 2020 May 29. Nat Rev Genet. 2020. PMID: 32472059 Review.
-
Assessing Ploidy Level Analysis and Single Pollen Genotyping of Diploid and Euploid Citrus Genotypes by Fluorescence-Activated Cell Sorting and Whole-Genome Amplification.Front Plant Sci. 2019 Sep 24;10:1174. doi: 10.3389/fpls.2019.01174. eCollection 2019. Front Plant Sci. 2019. PMID: 31611896 Free PMC article.
-
DMC1 stabilizes crossovers at high and low temperatures during wheat meiosis.Front Plant Sci. 2023 Aug 8;14:1208285. doi: 10.3389/fpls.2023.1208285. eCollection 2023. Front Plant Sci. 2023. PMID: 37615022 Free PMC article.
References
-
- Aliyeva-Schnorr L., Beier S., Karafiatova M., Schmutzer T., Scholz U., Dolezel J., et al. . (2015). Cytogenetic mapping with centromeric bacterial artificial chromosomes contigs shows that this recombination-poor region comprises more than half of barley chromosome 3H. Plant J. 84, 385–394. 10.1111/tpj.13006 - DOI - PubMed
LinkOut - more resources
Full Text Sources
Other Literature Sources