. 2017 Sep 26:8:1659.
doi: 10.3389/fpls.2017.01659. eCollection 2017.

Overexpression of SlGRAS40 in Tomato Enhances Tolerance to Abiotic Stresses and Influences Auxin and Gibberellin Signaling

Affiliations

Overexpression of SlGRAS40 in Tomato Enhances Tolerance to Abiotic Stresses and Influences Auxin and Gibberellin Signaling

Yudong Liu et al. Front Plant Sci. .

Abstract

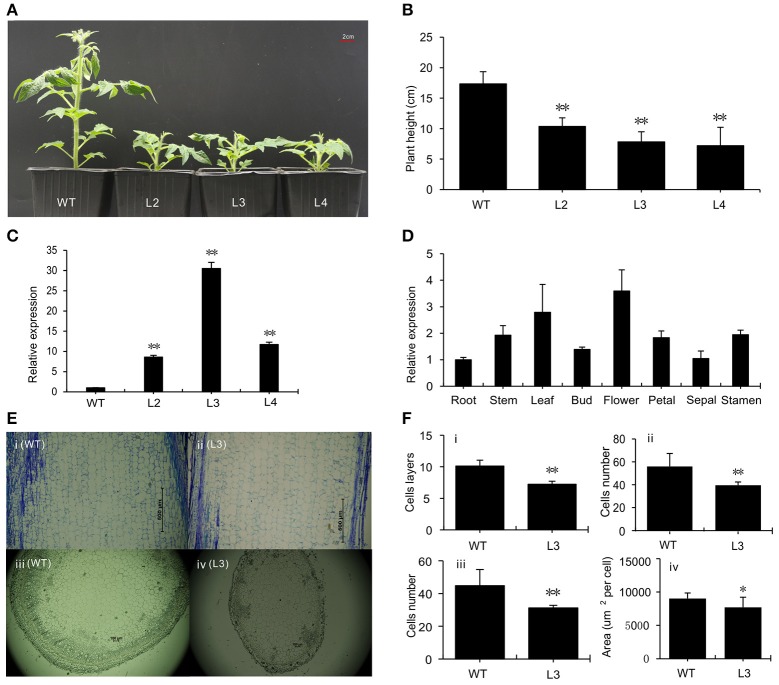
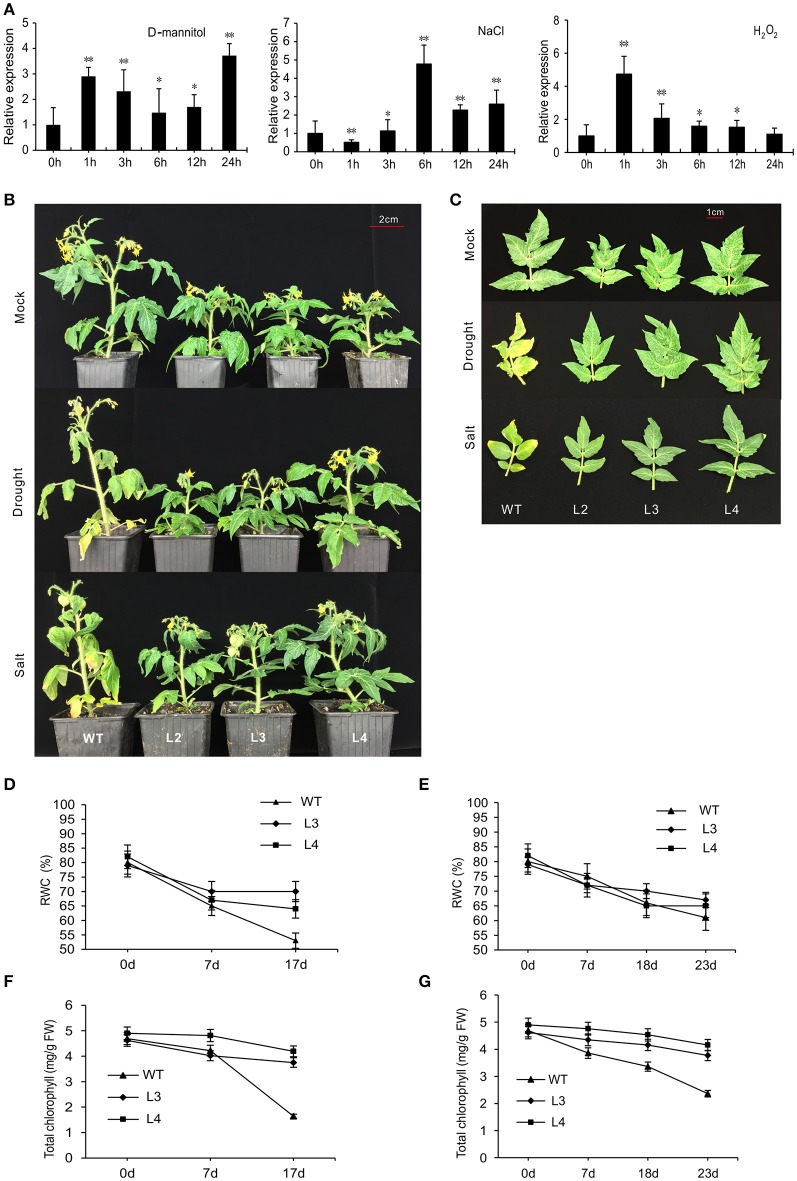
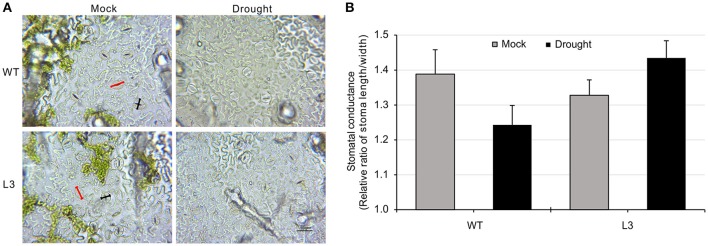
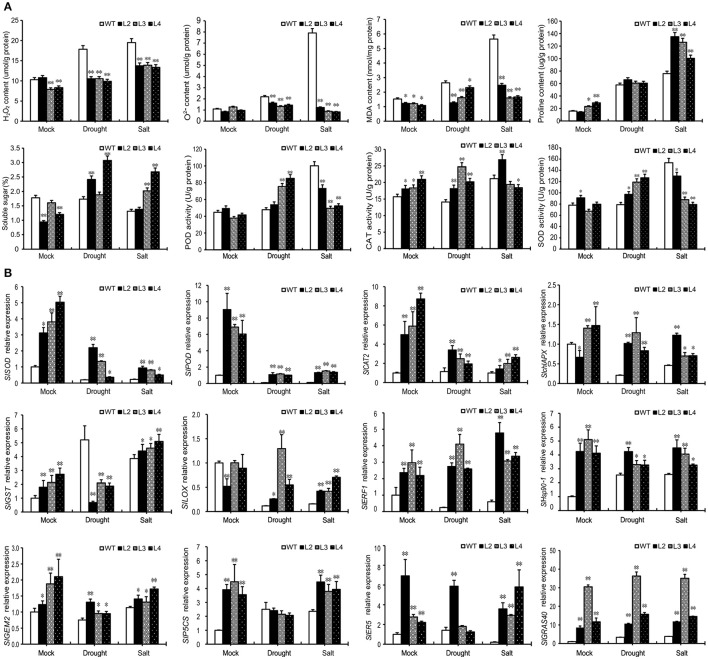
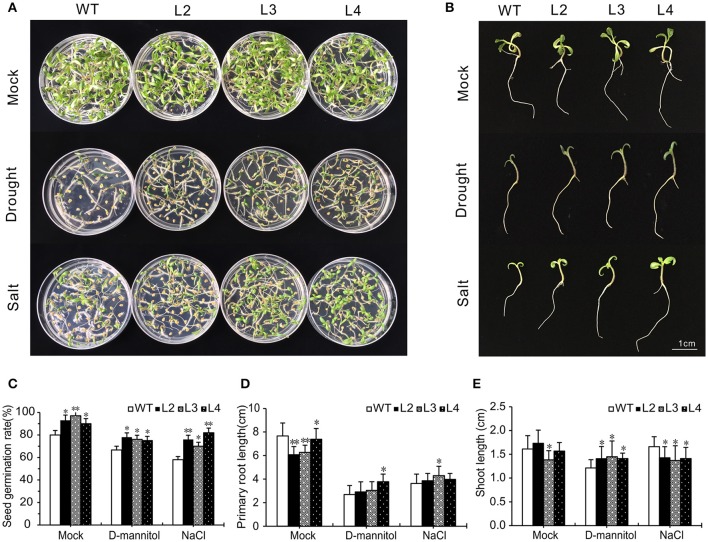
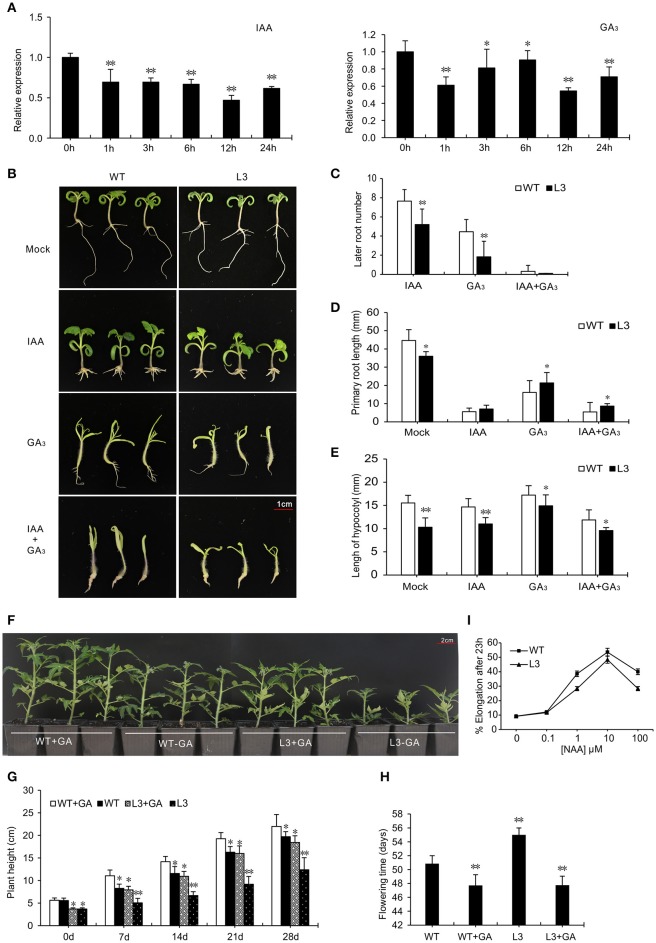
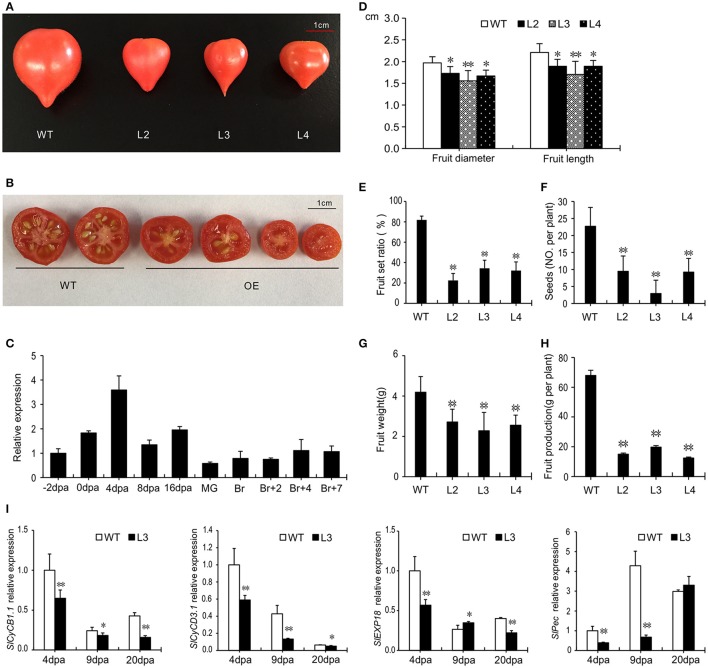
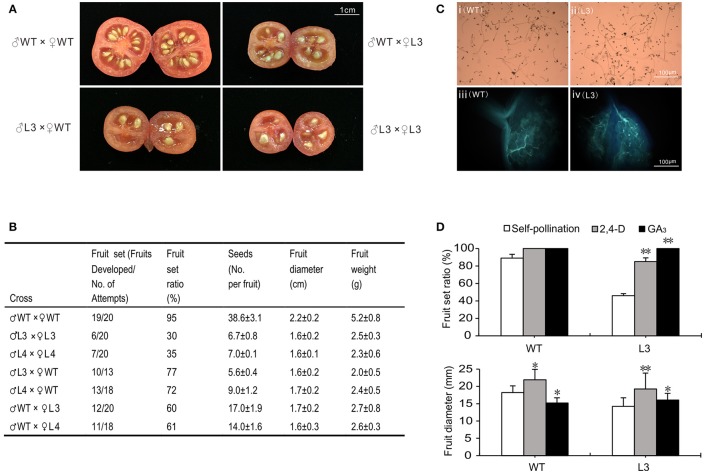
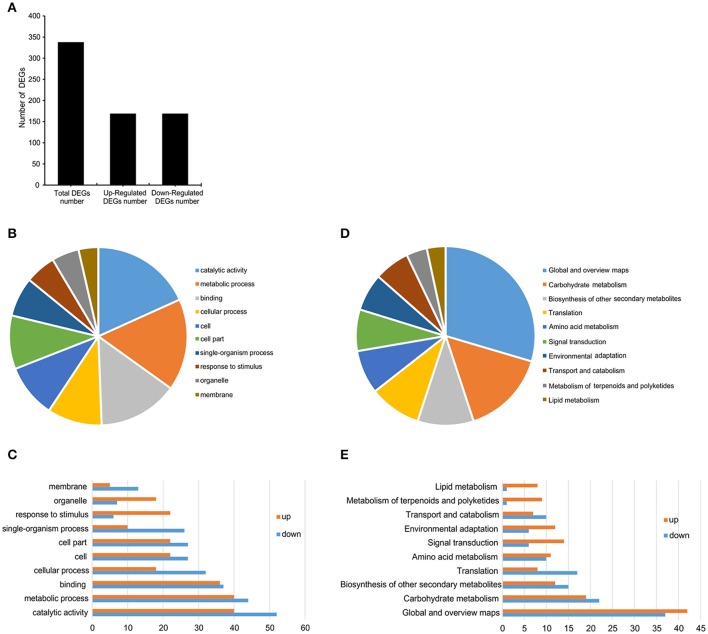
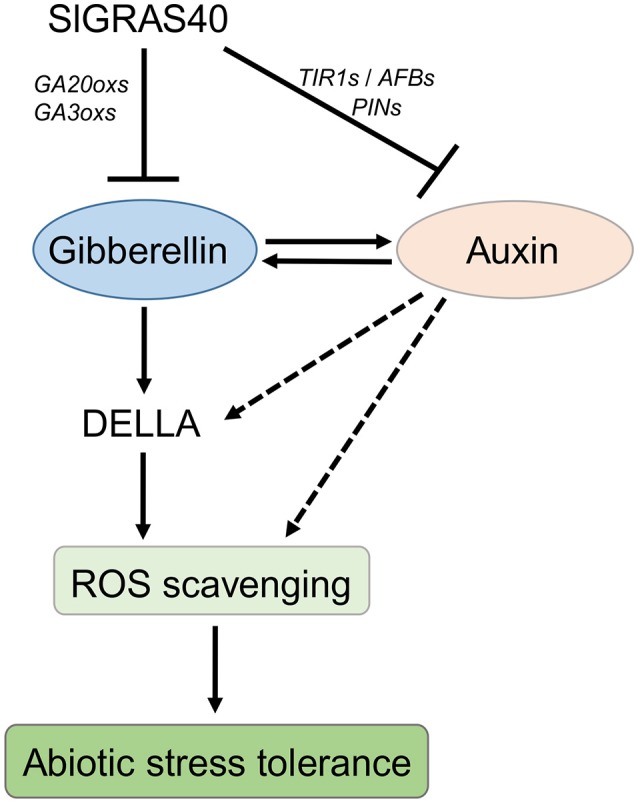
Abiotic stresses are major environmental factors that inhibit plant growth and development impacting crop productivity. GRAS transcription factors play critical and diverse roles in plant development and abiotic stress. In this study, SlGRAS40, a member of the tomato (Solanum lycopersicum) GRAS family, was functionally characterized. In wild-type (WT) tomato, SlGRAS40 was upregulated by abiotic stress induced by treatment with D-mannitol, NaCl, or H2O2. Transgenic tomato plants overexpressing SlGRAS40 (SlGRAS40-OE) were more tolerant of drought and salt stress than WT. SlGRAS40-OE plants displayed pleiotropic phenotypes reminiscent of those resulting from altered auxin and/or gibberellin signaling. A comparison of WT and SlGRAS40-OE transcriptomes showed that the expression of a large number of genes involved in hormone signaling and stress responses were modified. Our study of SlGRAS40 protein provides evidence of how another GRAS plays roles in resisting abiotic stress and regulating auxin and gibberellin signaling during vegetative and reproductive growth in tomato.

Keywords: GRAS transcription factor; SlGRAS40; abiotic stresses; auxin; gibberellin; tomato (Solanum lycopersicum).


Figures

Figure 1
Figure 1
Phenotypic characterization of wild-type and transgenic plants. (A) One-month-old plants of WT and SlGRAS40-overexpressing lines. L2, L3, L4, three independent SlGRAS40-overexpressing lines. (B) Height of plants shown in (A). Error bars show the standard error between three biological replicates (n = 3) with more than 10 plants for each replicate performed. (C) Expression levels of SlGRAS40 in plants of WT and SlGRAS40-OE lines. Expression data were normalized with SlGRAS40 expression in WT as 1. Error bars show the standard error between three biological replicates (n = 3). (D) Tissue profiling analysis of SlGRAS40 in different organs of wild-type tomato. Expression data were normalized with SlGRAS40 expression in root set as 1. (E) Histological analysis of 1-month-old stems from WT (i, iii) and SlGRAS40-OE L3 (ii, iv) shown in longitudinal section (i, ii) and transverse section (iii, iv). (F) Analysis of histological data from (E). (i) and (ii) are data from longitudinal sections; (iii) and (iv) are data from transverse sections. All data are measurements under 40× microscopic field. Asterisks indicate significant differences using Student's t-test (*P < 0.05, **P < 0.01).
Figure 2
Figure 2
Overexpression of SlGRAS40 enhances tolerance to drought and salt stress. (A) Quantitative RT-PCR analysis of SlGRAS40 mRNA from leaves of 1-month-old WT plants sprayed with 100 mM D-mannitol, 200 mM NaCl ,or 100 mM H2O2. Expression data was normalized with expression of SlGRAS40 in treated plants at 0 h set as 1. Asterisks indicate significant differences using Student's t-test (*P < 0.05, **P < 0.01). (B) Photographs of representative plants after 17 days of drought treatment or 23 days of salt treatment compared to control plants. (C) Phenotypes of the fifth leaves of plants shown in (B). RWC (D,E) and total chlorophyll content (F,G) were measured after drought (D,F) and salt (E,G) stress treatment. Error bars show the standard error of data from three replicates.
Figure 3
Figure 3
Overexpression of SlGRAS40 reduces stoma opening under drought stress. (A) Stoma morphology of WT and SlGRAS40-OE L3 leaves under mock and drought conditions. Red indicates pore length, black indicates pore width. (B) Stomatal conductance of WT and SlGRAS40-OE L3 leaves under mock and drought conditions. Stomatal conductance = pore length/pore width. Error bars show the standard error between three biological replicates (n = 3) with more than five leaves per replicate.
Figure 4
Figure 4
Overexpression of SlGRAS40 elevates ROS scavenging ability. (A) H2O2, O2−, MDA, proline, and soluble sugar contents and POD, CAT, and SOD activities in leaves of WT and SlGRAS40-OE plants under normal and stress conditions. Leaf samples were from the plants shown in Figure 2B. (B) Transcript levels of stress related genes in wild-type and transgenic plants under normal and stress conditions. Leaf samples from the plants shown in Figure 2B were used for RNA extraction. Error bars show the standard error between three replicates performed. Asterisks indicate significant differences using Student's t-test (*P < 0.05, **P < 0.01).
Figure 5
Figure 5
Comparative analysis of WT and SlGRAS40-OE lines under drought and salt stress. (A, B) Seed germination of WT and SlGRAS40-OE lines after 2 weeks in medium containing 150 mM D-mannitol or 75 mM NaCl. (C) Germination rate of WT and SlGRAS40-OE lines under control and drought or salt treatments. (D) Primary root length of WT and SlGRAS40-OE seedlings under control and drought or salt treatments. (E) Shoot length of WT and SlGRAS40-OE seedlings under control and drought or salt treatments. Error bars show the standard errors between three replicates. Asterisks indicate significant differences using Student's t-test (*P < 0.05, **P < 0.01).
Figure 6
Figure 6
Overexpression of SlGRAS40 alters responsiveness to IAA and GA3. (A) Quantitative RT-PCR analysis of SlGRAS40 mRNA from leaves of 15-day-old WT seedlings treated with 20 μM IAA and 20 μM GA3. (B) Phenotypes of 15-day-old WT and SlGRAS40-OE L3 seedlings grown on ½ × MS medium containing 1 μM IAA and/or 50 μM GA3. (C) Number of lateral roots of WT and SlGRAS40-OE L3 seedlings treated with IAA, GA3 or IAA + GA3. (D) Primary root length of WT and SlGRAS40-OE L3 seedlings shown in (B). (E) Hypocotyl length of WT and SlGRAS40-OE L3 seedlings shown in (B). (F) Rescue of SlGRAS40-OE L3 dwarfism by exogenous GA3 application. (G) Plant height and (H) Phase transition time of GA3 treated plants shown in (F). (I) Hypocotyl elongation of WT and SlGRAS40-OE L3 after NAA treatment. Asterisks indicate significant differences using Student's t-test (*P < 0.05, **P < 0.01).
Figure 7
Figure 7
SlGRAS40-OE plants bear smaller fruits with fewer seeds. (A,B) Fruits of WT and SlGRAS40-OE plants. (C) Tissue profiling of SlGRAS40 in different stage ovaries and fruits of wild-type tomato. dpa, days post anthesis; MG, mature green fruit; Br, color breaker fruit. The expression data was normalized with the value for −2 dpa ovary set to 1. (D) Diameter and length of WT and SlGRAS40-OE fruits in (A). (E) Fruit set ratio, (F) Seed number, (G) Fruit weight, and (H) Fruit production of WT and SlGRAS40-OE fruits. Error bars show the standard error of values from three biological replicates (n = 3) with more than 20 fruits or 20 plants per replicate. (I) Quantitative RT-PCR analysis of cell division and expansion genes in 4, 9, and 20 dpa WT and SlGRAS40-OE L3 fruits. dpa, days post anthesis. Error bars show the standard error between three replicates. Asterisks indicate significant differences using Student's t-test (*P < 0.05, **P < 0.01).
Figure 8
Figure 8
Overexpression of SlGRAS40 disturbs fertilization. (A) Images of cross-fertilization assay. (B) Cross-fertilization assay data. (C) Pollen germination (i, ii) and pollen tube growth (iii, iv) of WT (i, iii) and SlGRAS40-OE L3 (ii, iv) plants. (D) Fruit-set ratio and fruit diameter of WT and SlGRAS40-OE L3 plants treated with 2,4-D and GA3 for 20 days. Error bars show the standard error between three biological replicates (n = 3) with more than eight ovaries per replicate. Asterisks indicate significant differences using Student's t-test (*P < 0.05, **P < 0.01).
Figure 9
Figure 9
Classification of DEGs in RNA-Seq data. (A) The number of DEGs from the RNA-Seq data. (B,C) The top 10 GO terms of DEGs between SlGRAS40-OE L3 and WT. (D,E) The top 10 KEGG pathways of DEGs between SlGRAS40-OE L3 and WT.
Figure 10
Figure 10
A hypothesized model of SlGRAS40 enhances abiotic resistance interlink with auxin and gibberellin. SlGRAS40 suppresses gibberellin biosynthesis and disrupts auxin signaling, and then influences auxin and gibberellin homeostasis. The crosstalk between auxin and gibberellin may be stimulate DELLA accumulation under abiotic stresses, and then enhances ROS scavenging ability and abiotic resistance.

References

    1. Achard P., Cheng H., De Grauwe L., Decat J., Schoutteten H., Moritz T., et al. . (2006). Integration of plant responses to environmentally activated phytohormonal signals. Science 311, 91–94. 10.1126/science.1118642 - DOI - PubMed
    1. Achard P., Renou J. P., Berthome R., Harberd N. P., Genschik P. (2008). Plant DELLAs restrain growth and promote survival of adversity by reducing the levels of reactive oxygen species. Curr. Biol. 18, 656–660. 10.1016/j.cub.2008.04.034 - DOI - PubMed
    1. Apel K., Hirt H. (2004). Reactive oxygen species: metabolism, oxidative stress, and signal transduction. Annu. Rev. Plant Biol. 55, 373–399. 10.1146/annurev.arplant.55.031903.141701 - DOI - PubMed
    1. Bates L. S., Waldren R. P., Teare I. D. (1973). Rapid determination of free proline for water-stress studies. Plant Soil 39, 205–207. 10.1007/BF00018060 - DOI
    1. Chen Z., Cuin T. A., Zhou M., Twomey A., Naidu B. P., Shiabala S. (2007). Compatible solute accumulation and stress-mitigating effects in barley genotypes contrasting in their salt tolerance. J. Exp. Bot. 58, 4245–4255. 10.1093/jxb/erm284 - DOI - PubMed

LinkOut - more resources