. 2017 Oct 6:3:30.
doi: 10.1038/s41540-017-0031-2. eCollection 2017.

Deconstructing a multiple antibiotic resistance regulation through the quantification of its input function

Affiliations

Deconstructing a multiple antibiotic resistance regulation through the quantification of its input function

Guillermo Rodrigo et al. NPJ Syst Biol Appl. .

Abstract

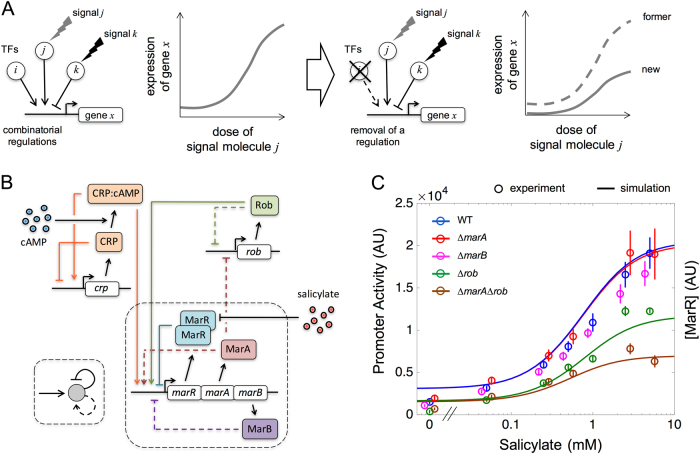
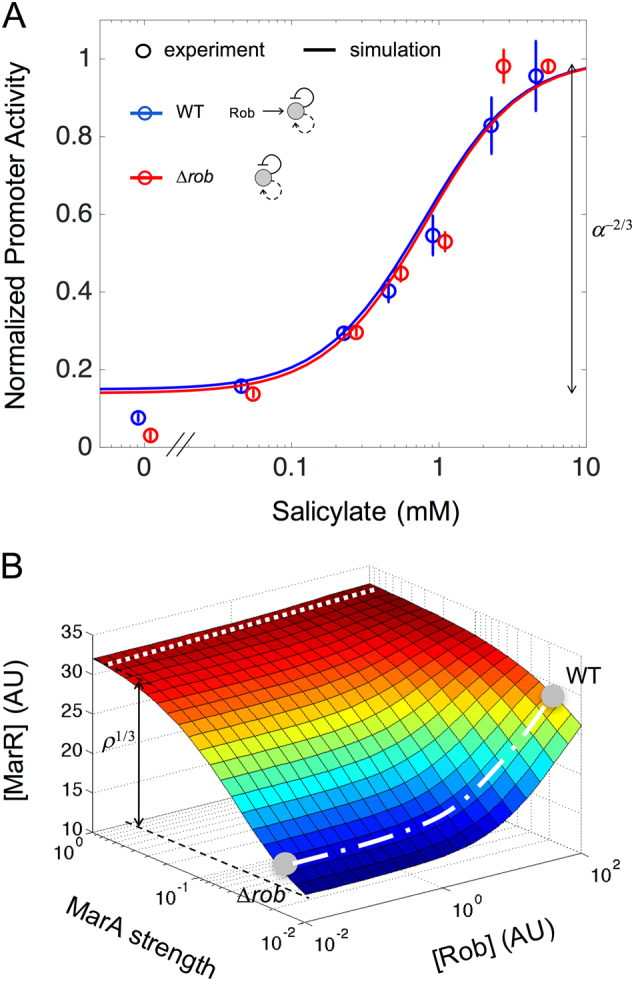
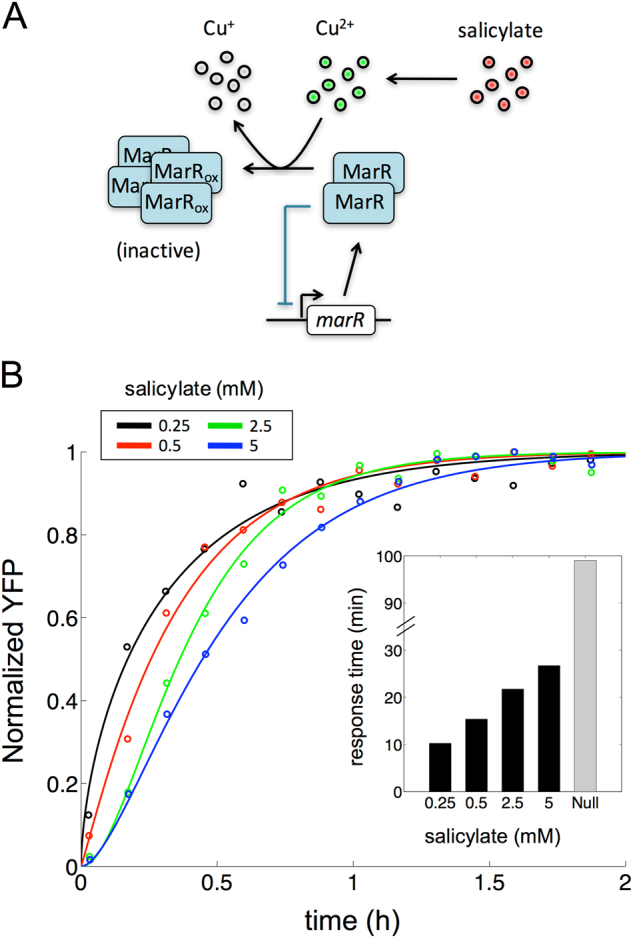
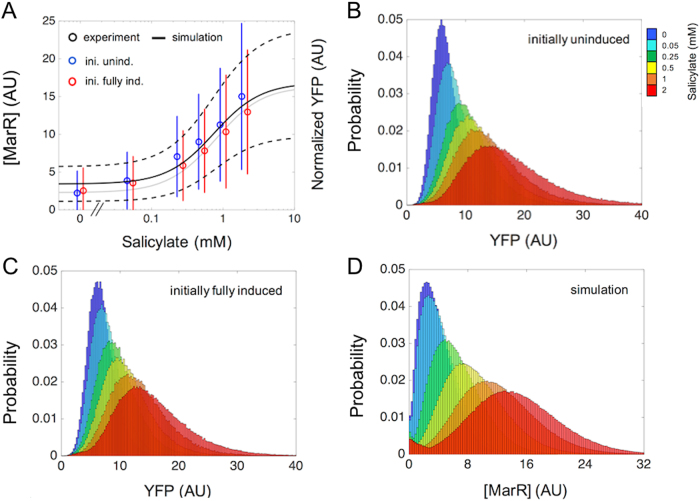
Many essential bacterial responses present complex transcriptional regulation of gene expression. To what extent can the study of these responses substantiate the logic of their regulation? Here, we show how the input function of the genes constituting the response, i.e., the information of how their transcription rates change as function of the signals acting on the regulators, can serve as a quantitative tool to deconstruct the corresponding regulatory logic. To demonstrate this approach, we consider the multiple antibiotic resistance (mar) response in Escherichia coli. By characterizing the input function of its representative genes in wild-type and mutant bacteria, we recognize a dual autoregulation motif as main determinant of the response, which is further adjusted by the interplay with other regulators. We show that basic attributes, like its reaction to a wide range of stress or its moderate expression change, are associated with a strong negative autoregulation, while others, like the buffering of metabolic signals or the lack of memory to previous stress, are related to a weak positive autoregulation. With a mathematical model of the input functions, we identify some constraints fixing the molecular attributes of the regulators, and also notice the relevance of the bicystronic architecture harboring the dual autoregulation that is unique in E. coli. The input function emerges then as a tool to disentangle the rationale behind most of the attributes defining the mar phenotype. Overall, the present study supports the value of characterizing input functions to deconstruct the complexity of regulatory architectures in prokaryotic and eukaryotic systems.


Conflict of interest statement

The authors declare no competing financial interests.

Figures

Fig. 1
Fig. 1
Inferring the regulatory complexity of the mar operon though the characterization of the input function. a A complex regulatory scheme can be associated to a particular input function (left) whose change when a regulator is perturbed helps us appreciate the role of this regulator (right). b Scheme of the mar core control network, which includes the components of the mar operon, MarR (a repressor acting as a dimer), MarA (an activator acting as a monomer), and MarB (a periplasmatic protein that may act as repressor), as well as two additional elements that are not part of the operon, CRP:cAMP and Rob (both monomeric activators). The mar operon (through MarA) controls the bacterial response to a number of toxic compounds, including antibiotics, and is also sensitive to metabolic signals (through CRP). Dashed lines indicate weak regulations. Inset illustrates the logical regulatory architecture of the operon. c Input function (promoter activity in steady state as a function of salicylate) measured by means of a YFP reporter system (YFP follows the dynamics of MarR). Functions corresponding to the wild type and several mutant strains are shown. Open circles correspond to experimental data (error bars are standard deviations of three replicates); solid lines correspond to model predictions of gene expression levels (MarR, representation in arbitrary units, AU)
Fig. 2
Fig. 2
Effect of Rob on the mar operon input function. a Normalized input function (promoter activity in steady state relative to the maximum) as a function of the salicylate concentration for the wild-type (WT, blue) and ∆rob (red) strains. Open circles correspond to experimental data (error bars are standard deviations of three replicates), with input and output ranges of R in = 31.11 ± 2.46 and R out = 8.85 ± 0.04 (WT), and R in = 20.88 ± 1.17 and R out = 11.48 ± 1.03 (∆rob). Solid lines correspond to model predictions, with R in = 28.32 and R out = 6.77 (WT), and R in = 27.51 and R out = 7.17 (∆rob). Response fold change dependence on the fraction of functional MarR upon full induction (α parameter in the model, α ≈ 5%, Supplementary Table S1) is well predicted by the theory to be R out ≈ α −2/3 ≈ 7.4. b Both MarA activation strength and Rob concentration modulate the expression level of MarR in equilibrium (simulations for 5 mM salicylate). The effect or Rob becomes evident in a weak regime of MarA (natural system; dashed-dotted white line). The same scaling (≈ ρ 1/3) could be obtained if the action of MarA were strong, which would inactivate the effect of Rob (dotted white line). See text for details
Fig. 3
Fig. 3
Input function of the mar operon with respect to salicylate and cAMP. Two-dimensional input function (promoter activity in steady state) as function of salicylate and cAMP (42 concentration combinations of the two input signals). a Wild-type system. brob system. Inset figures show model simulations of gene expression levels (MarR) for the corresponding system that anticipate the experimental data. Absence of Rob leads to the appearance of cross talk between signals
Fig. 4
Fig. 4
The effect of MarR as a sensor in the mar operon. a Scheme of the role of copper signaling in MarR regulation. Salicylate induces the intracellular accumulation of Cu2+ ions, which in turn oxidize MarR molecules. While non-oxidized MarR molecules form dimers (with repressor action), oxidized MarR (MarRox) molecules form tetramers (inactive). b Temporal dynamics of the system, as given by the normalized fluorescence (YFP, relative to the maximum), for different salicylate concentrations. Small circles represent experimental data (averages of three replicates), solid lines represent fittings to an exponential model (data for wild-type strain). Inset shows the associated times to reach to half the steady state values (response times; gray bar corresponds to cell-cycle time, i.e., a null scenario in which the operon is considered to be constitutively expressed.)
Fig. 5
Fig. 5
Single-cell response of the mar operon with two unrelated previous exposures to inducer. a Open circles denote the median respond to salicylate corresponding to single-cell experimental data using the YFP reporter system (error bars are standard deviations; representation in arbitrary units AU). Bacteria were initially uninduced (blue) or fully induced (red) before exposure to the different dosages of salicylate. Solid gray line indicates the deterministic input function obtained by simulation, while the solid black line represents the median input function predicted by a stochastic model (dashed lines represent standard deviations over the median; all data and simulations here for a ∆rob system). b Probability distributions in steady state for different salicylate concentrations for cells previously uninduced. c As before when cells were previously fully induced (5 mM salicylate). d Model simulation of the probability distributions in steady state for different salicylate concentrations were also independent of the presence/absence of a preceding induction (no hysteresis)
Fig. 6
Fig. 6
Predicted input function of an alternative genetic implementation of the mar dual autoregulatory motif. a Schemes of two possible genetic implementations of the mar core network with positive and negative autoregulation (in the absence of Rob and CRP:cAMP). Left scheme correspond to the natural circuit. Right scheme corresponds to the hypothetical circuit where the oxidized MarR works as an activator (with competitive binding). b Input function (model simulations of normalized promoter activity relative to the maximum) with respect to salicylate. Solid line denotes the natural circuit (input and output range being R in = 27.51 and R out = 7.17, respectively). Dashed line denotes the hypothetical one (R in = 5.16 and R out = 62.17). Inset shows the associated response times (time to reach steady state) of these two implementations. Black bars correspond to the natural circuit. Hatched bars to the hypothetical circuit (gray bar shows a null reference value relative to a system that would start the production of the mar operon at a constant rate). Low dose corresponds to 0.01 mM and high dose to 10 mM

References

    1. Jacob F, Monod J. Genetic regulatory mechanisms in the synthesis of proteins. J. Mol. Biol. 1961;3:318–356. doi: 10.1016/S0022-2836(61)80072-7. - DOI - PubMed
    1. Lwoff A. Lysogeny. Bacteriol. Rev. 1953;17:269–337. - PMC - PubMed
    1. Ptashne, M. & Gann, A. Genes and signals (Cold Spring Harbor Laboratory Press, 2002).
    1. Ptashne, M. Genetic Switch (Cold Spring Harbor Laboratory Press, 2004).
    1. Goldberger RF. Autogenous regulation of gene expression. Science. 1974;183:810–816. doi: 10.1126/science.183.4127.810. - DOI - PubMed

LinkOut - more resources