. 2017 Oct 11:6:e31652.
doi: 10.7554/eLife.31652.

Recruitment dynamics of ESCRT-III and Vps4 to endosomes and implications for reverse membrane budding

Affiliations

Recruitment dynamics of ESCRT-III and Vps4 to endosomes and implications for reverse membrane budding

Manuel Alonso Y Adell et al. Elife. .

Abstract

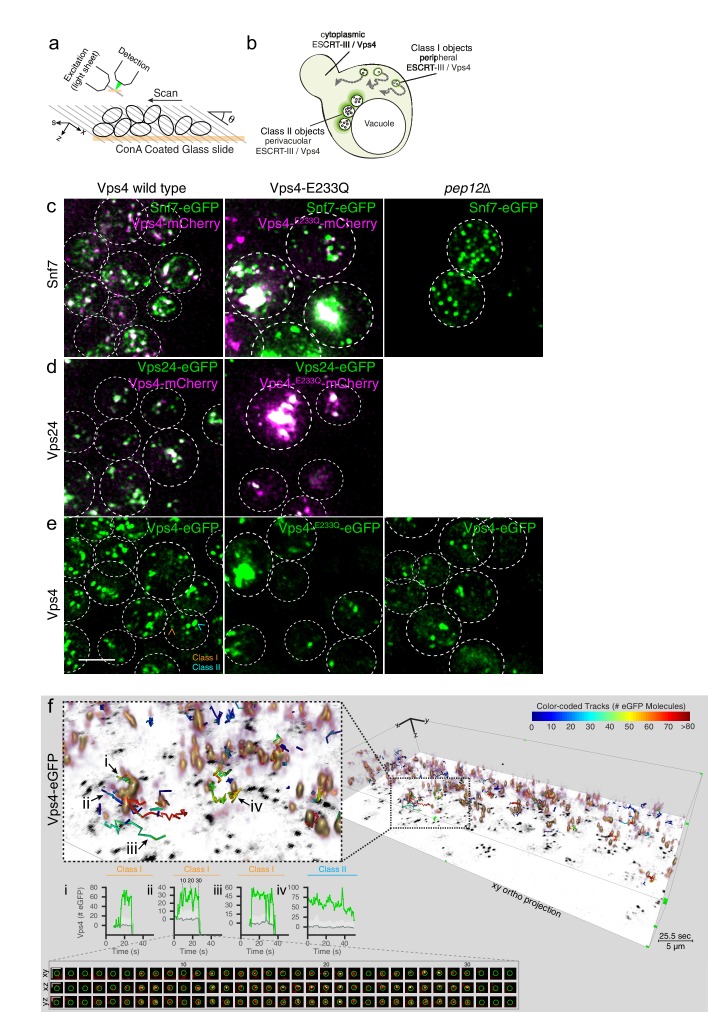
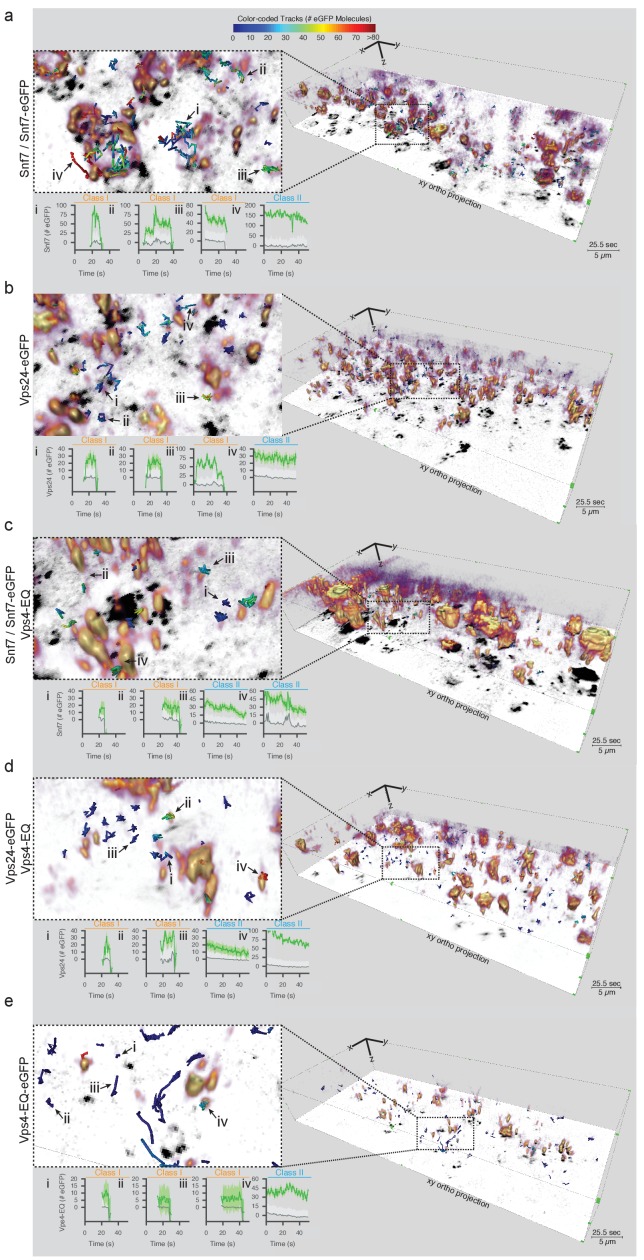
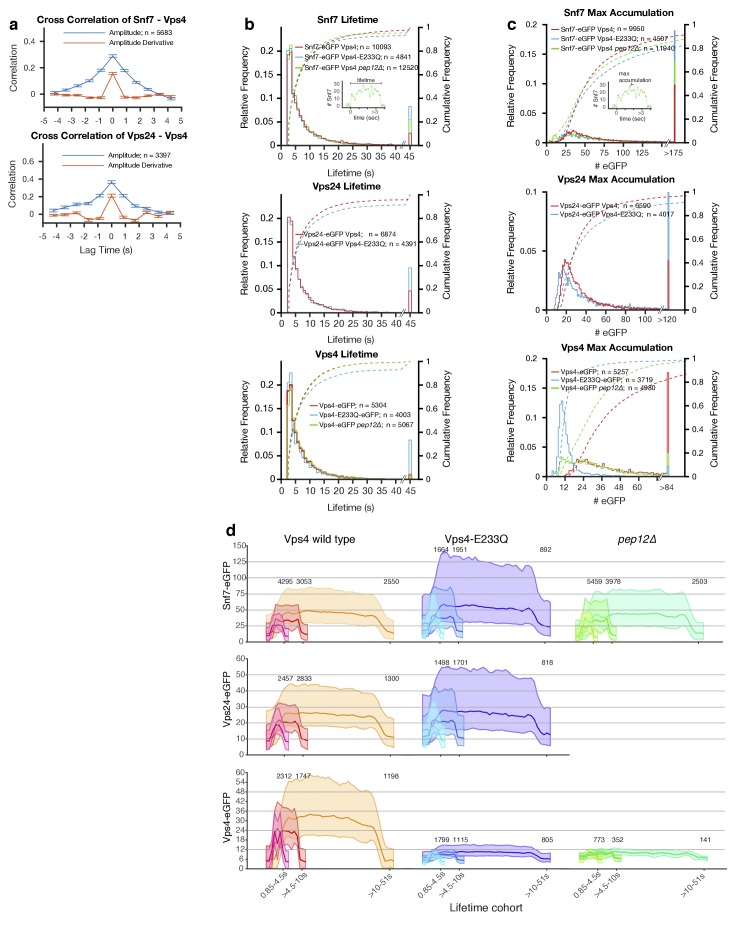
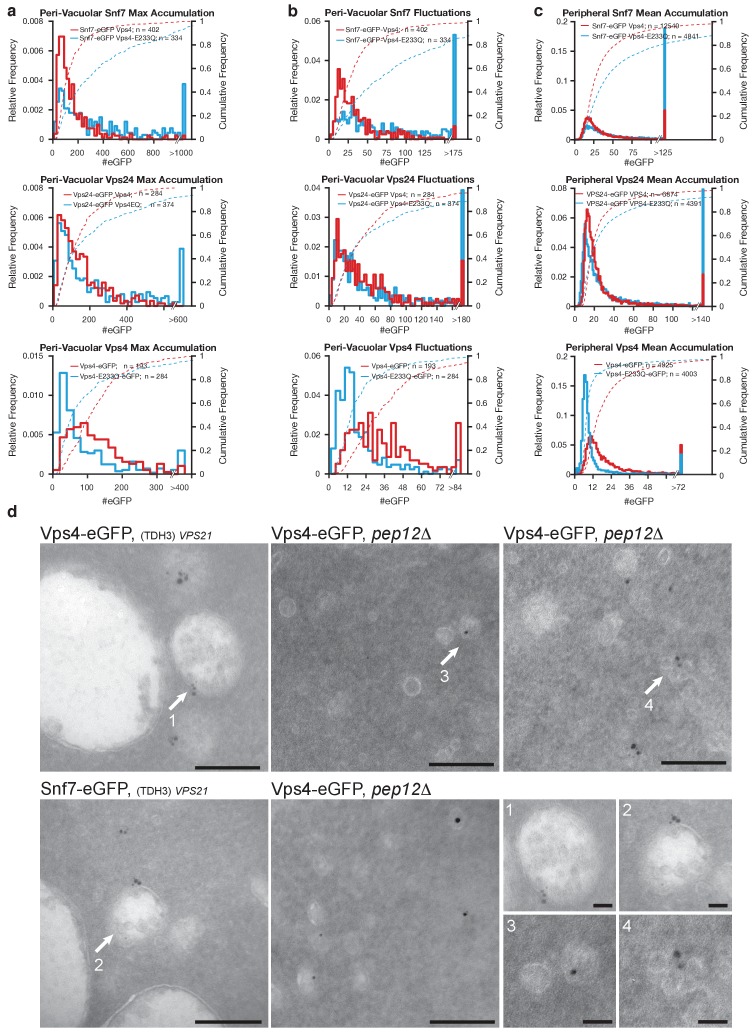
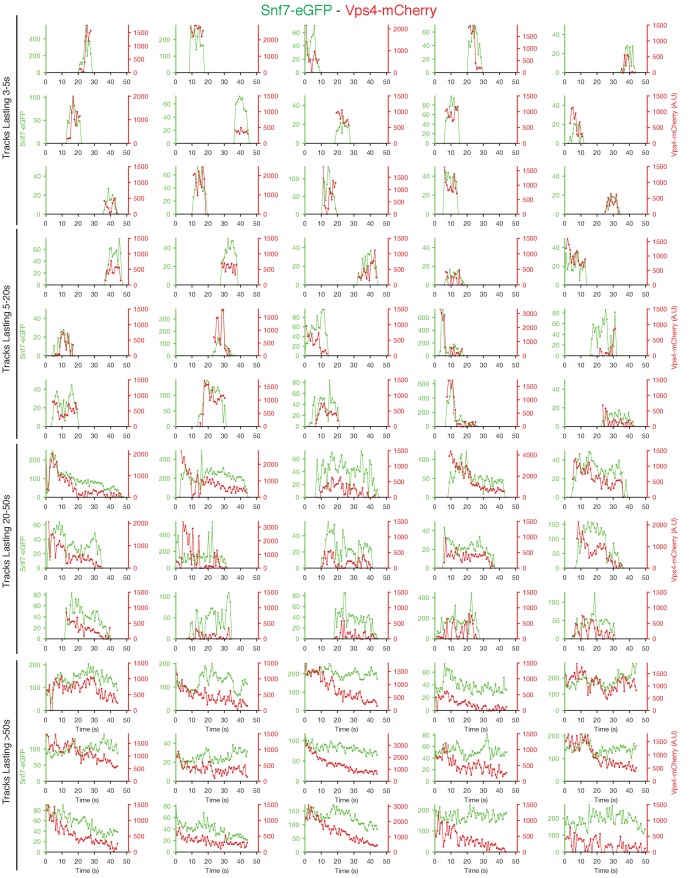
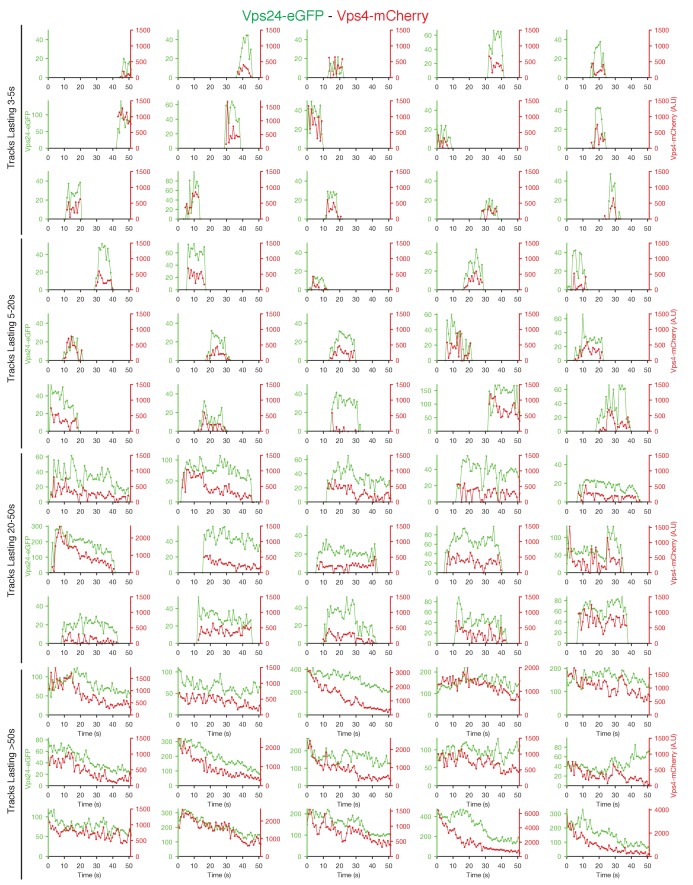
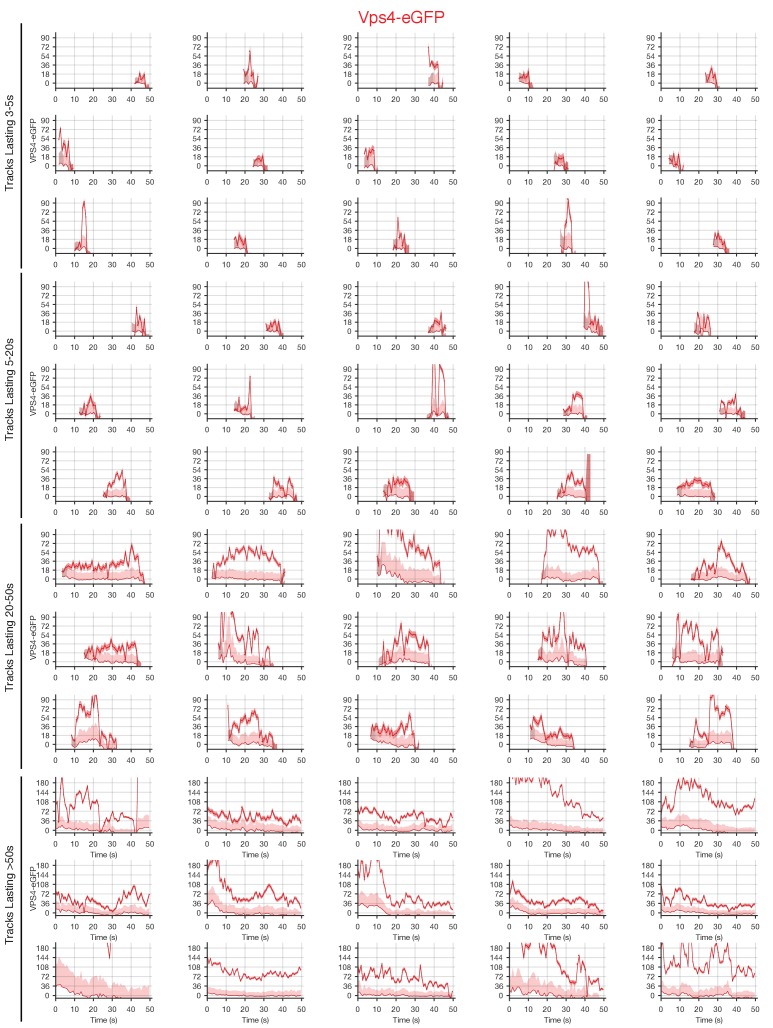
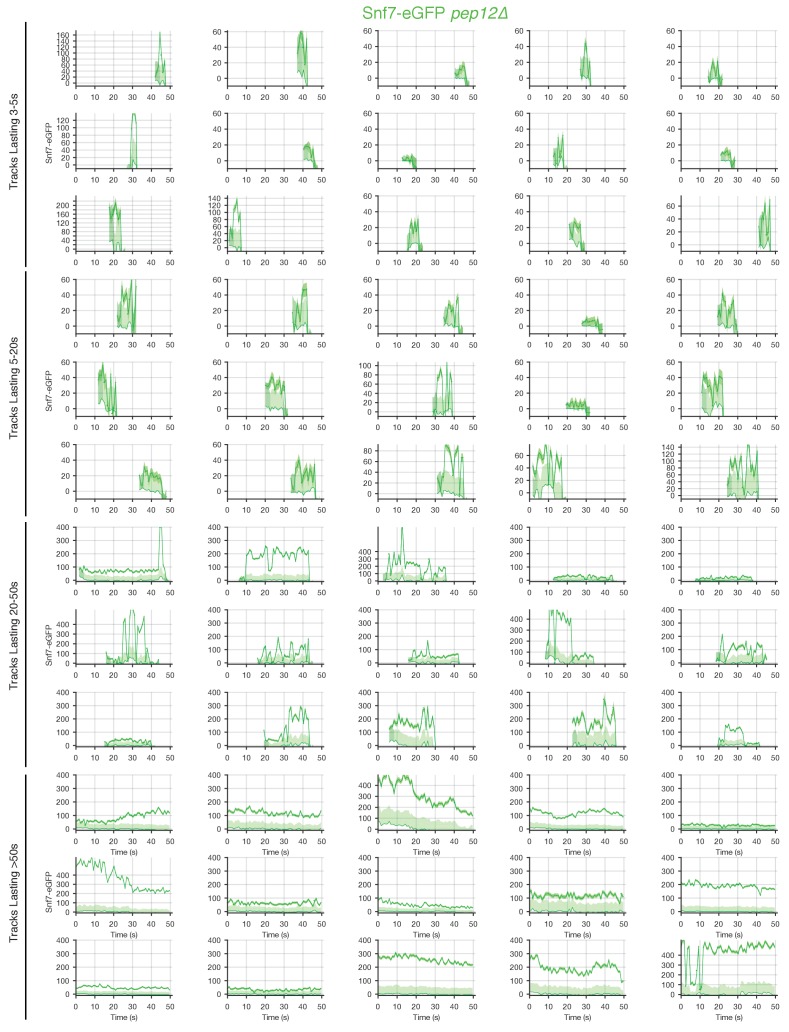
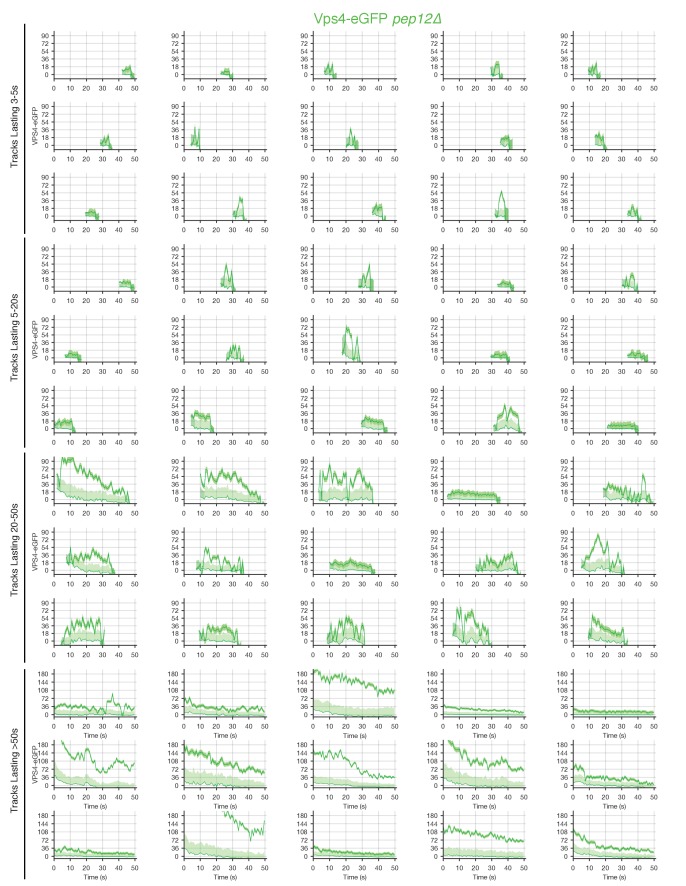
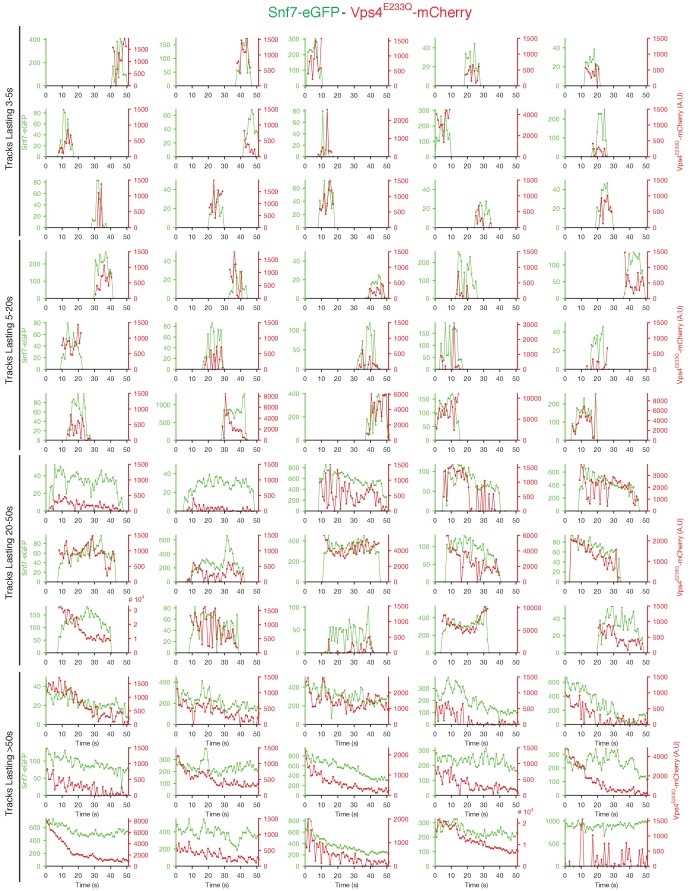
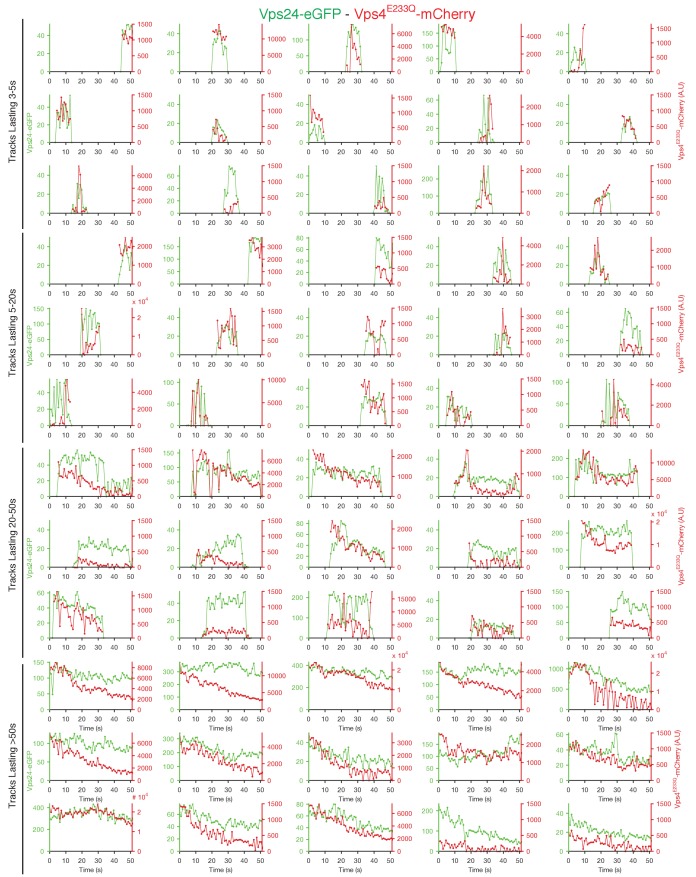
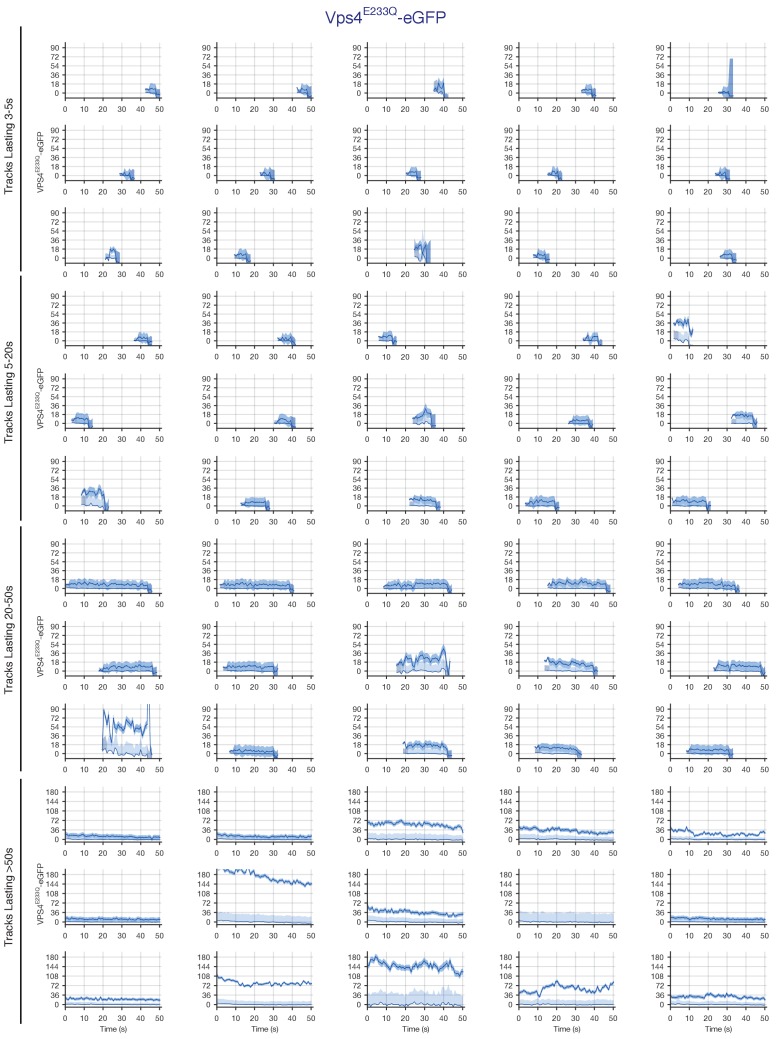
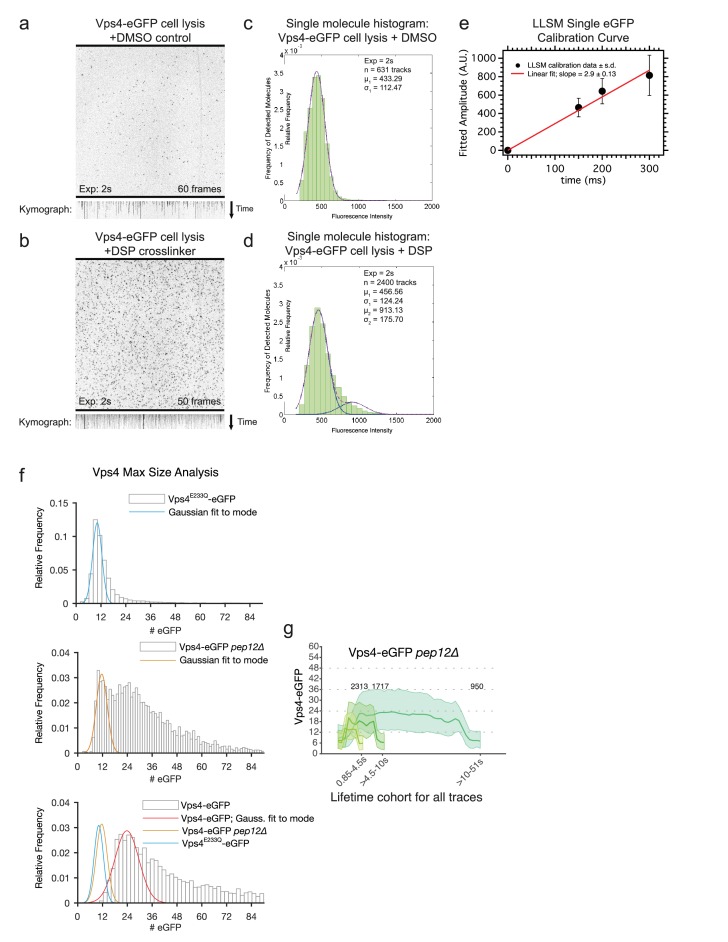
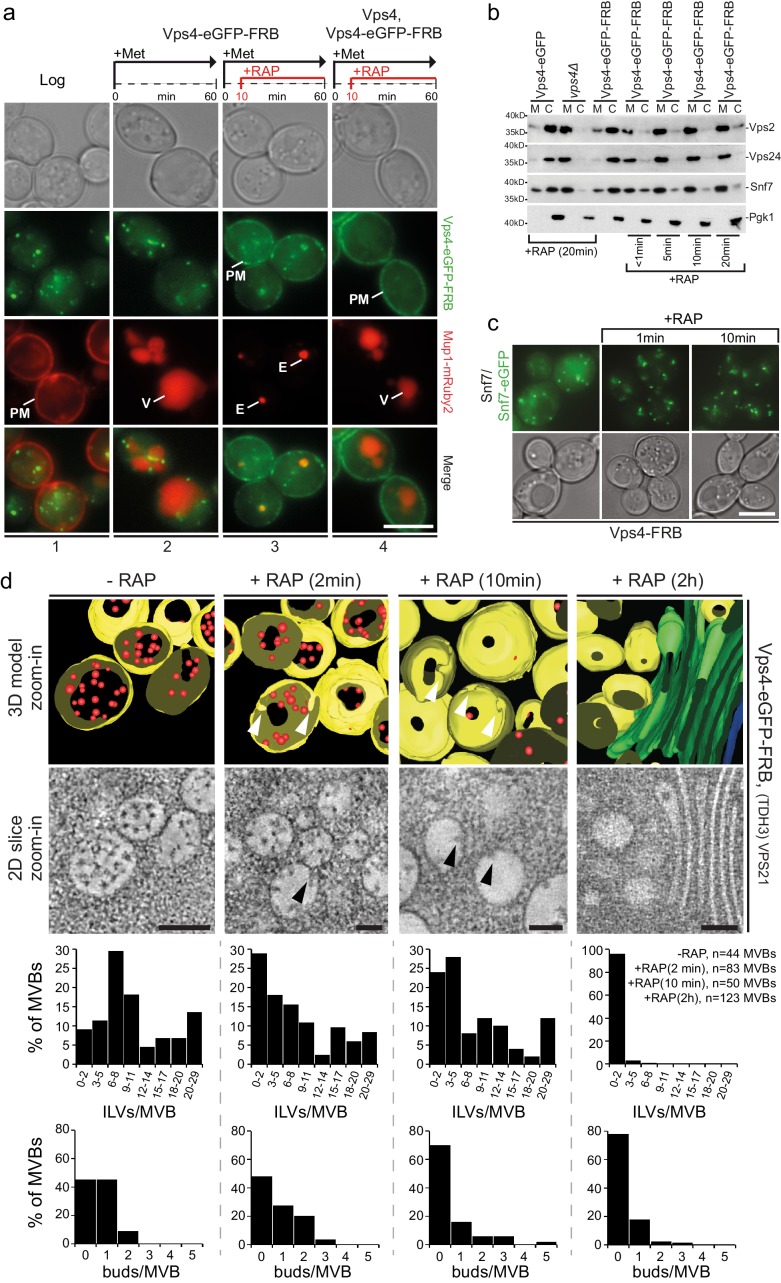
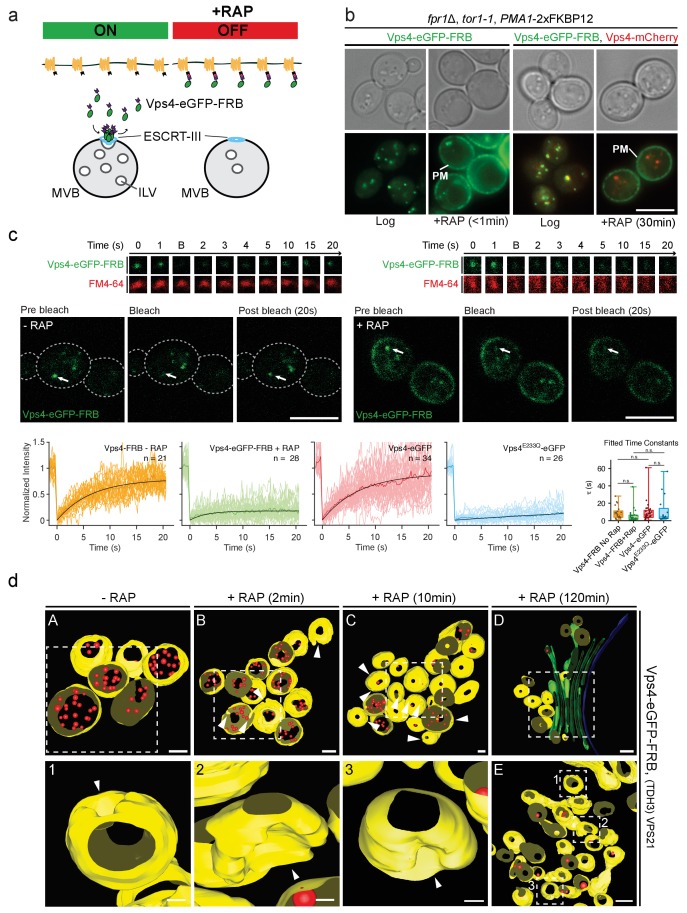
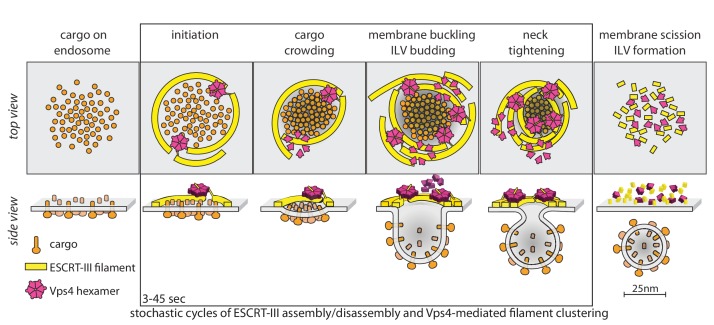
The ESCRT machinery mediates reverse membrane scission. By quantitative fluorescence lattice light-sheet microscopy, we have shown that ESCRT-III subunits polymerize rapidly on yeast endosomes, together with the recruitment of at least two Vps4 hexamers. During their 3-45 s lifetimes, the ESCRT-III assemblies accumulated 75-200 Snf7 and 15-50 Vps24 molecules. Productive budding events required at least two additional Vps4 hexamers. Membrane budding was associated with continuous, stochastic exchange of Vps4 and ESCRT-III components, rather than steady growth of fixed assemblies, and depended on Vps4 ATPase activity. An all-or-none step led to final release of ESCRT-III and Vps4. Tomographic electron microscopy demonstrated that acute disruption of Vps4 recruitment stalled membrane budding. We propose a model in which multiple Vps4 hexamers (four or more) draw together several ESCRT-III filaments. This process induces cargo crowding and inward membrane buckling, followed by constriction of the nascent bud neck and ultimately ILV generation by vesicle fission.

Keywords: 3D tracking; ESCRT; S. cerevisiae; cell biology; electron tomography; endosomes; high pressure freeze substitution; lattice light sheet microscopy; membrane budding.


Conflict of interest statement

No competing interests declared.

Figures

Figure 1.
Figure 1.. Fluorophore tagged ESCRT-III subunits and Vps4 do not interfere with endosomal traffic to the vacuole.
Epifluorescence and phase contrast microscopy of live yeast cells expressing Snf7-eGFP mixed with untagged Snf7, Vps24-eGFP, Vps4-eGFP, Vps4E233Q-eGFP or control cells, together with fluorescently tagged MVB cargo (mCherry-CPS or Mup1-mCherry), imaged 60 min after methionine addition. Arrowheads and arrows point to small peripheral and to larger perivacuolar objects, respectively; vacuole (V) and class E compartment (E) (red) are indicated. Scale bar = 5 µm.
Figure 1—figure supplement 1.
Figure 1—figure supplement 1.. Effect of fluorophore tagging of ESCRT-III subunits and Vps4 on the endosomal traffic of cargo to the vacuole.
(a–c) SDS-PAGE and western blot analysis using the indicated antibodies from total cell lysates (a) or equal volumes of subcellular fractions (b, c). Input (I), membrane fraction (M) and cytosol (C) samples for the various yeast strains are shown. Pgk1 was used as loading control. (d) Live cell epifluorescence and phase contrast microscopy of yeast cells expressing Vps4-mCherry (red) with Mup1-eGFP (green), Vps4-mNeonGreen (green) with Mup1-mScarlet (red) or Snf7-eGPF with or without endogenous Snf7 and Mup1-mCherry (red) 60 min after the addition of Methionine. Vacuole (V) and class E compartment (E) are indicated. Size bar = 5 µm. (e) Effect of canavanine in the growth of yeast cells. Canavanine sensitivity assays were carried with different strains as indicated in the presence of 1 µg /ml L-canavanine. (f) Live cell epifluorescence and phase contrast microscopy of yeast cells carrying different ESCRT deletion mutants and expressing untagged Snf7 and Snf7-eGFP, Vps24-eGFP or Vps4-eGFP together with cargo (Mup1-mRuby2 or mCherry-CPS). These experiments constitute a positive control showing that the endosomal localization of the fluorophore-tagged ESCRT-III components or Vps4 depends on an active functional ESCRT pathway. Plasma membrane (PM), Vacuole (V) and class E compartment (E) are indicated. Size bar = 5 µm.
Figure 1—figure supplement 2.
Figure 1—figure supplement 2.. Internalized cargo traffics through Vps4-containing carriers.
(a) Representative z-projection images acquired using LLSM from the complete cell volume of yeast cells expressing the cargo Mup1-eGFP and Vps4-mCherry. The cells were, visualized 5, 15 or 30 min after addition of methionine used to acutely activate the uptake of Mup1-eGFP and its endosomal traffic from the plasma membrane to the vacuole. After 5 min, the images show partial colocalization of the internalized cargo (green) with Vps4-mCherry (red) containing carriers and extensive colocalization afterwards. This is the expected traffic result for endocytic cargo as it transits through the early endosome compartment mostly located in the cell periphery towards the multivesicular late endosomes or MBVs most often found next to the vacuole. Scale bar = 5 µm.
Figure 2.
Figure 2.. Correlative light microscopy and electron tomography of perivacuolar MVBs.
Yeast cells expressing Vps4-eGFP or Vps4-mNeonGreen were cryo-fixed and sections subjected to correlative light microscopy and electron tomography. (a–d) Representative images from epifluorescence microscopy of 300 nm thick sections, highlighting the presence of Vps4-eGFP perivacuolar fluorescent spots (green). TetraSpeck beads (white) were used to align the light microscopy and electron tomographic images. Scale bar = 1 µm. The highlighted Vps4-eGFP containing objects (1-5) were contained in the sections used to obtain electron tomographic images; the examples illustrate the appearance of endosomes containing ILV (gray spots) and ILV buds (arrowheads). Scale bar = 100 nm. (e) 3D model of MVBs imaged by electron tomography corresponding to panel (c) showing the MVB limiting membrane (yellow), ILVs (red) and vacuole (blue). Scale bar = 100 nm. (f) Histogram distribution indicating the content of ILV buds per MVB determined from the electron tomographic reconstructions from 35 yeast cells with 12 Vps4-eGFP and 26 Vps4-mNeonGreen fluorescent spots. See Supplementary file 1 for details.
Figure 3.
Figure 3.. 3D Visualization of ESCRT-III and Vps4 recruitment dynamics by LLSM.
(a) Schematic representation of the LLSM setup used to obtain time series of 51 s duration from the full cell volume of about 30–50 yeast cells. Image stacks, containing 28–30 sequential imaging optical planes spaced 261 nm apart, were recorded at 21 ms exposure for single or 14.8 ms exposure for alternating excitation wavelengths (b) Schematic model showing the location of fluorescent ESCRT-III or Vps4-eGFP expressed in yeast cells, showing relatively small peripheral mobile spots (class I objects), larger and relatively static perivacuolar spots (class II objects), and a diffuse cytosolic signal. (c–e) Representative orthogonal views after 3D deconvolution of WT yeast cells and the indicated mutants expressing either a mixture of Snf7 and Snf7-eGFP together with Vps4-mCherry, Vps24-eGFP together with Vps4-mCherry or Vps4-eGFP alone. Examples of class I and class II objects in panel (e) are indicated. Scale bar 3 µm. (f) Volume rendering of LLSM image from a single time point (25.5 s) obtained from cells expressing Vps4-eGFP (see also Video 2). The right-hand panel includes the orthogonal projection along the xy axis (black) and illustrates the complexity of the 3D image. Scale bar = 5 µm. The left-hand panel shows an enlarged region, overlaid with tracks of representative, diffraction-limited fluorescent objects (class I, tracks i-iii) of increasing lifetimes and a long lived non-diffraction limited perivacuolar object (class II, track iv); these were traced automatically in 3D and in time, for their content (color-coded) of fluorescent molecules. Each plot compares the number of fluorescent molecules converted from the fluorescence signal of the spot (green) with the local background (gray) and includes the 95% confidence interval of the measurements (light gray fill). Additional traces are shown in Figure 4—figure supplements 2–9. The bottom panel shows a cross sectional time montage of the deconvolved object (orange) corresponding to track ii. Scale bar = 1 µm.
Figure 3—figure supplement 1.
Figure 3—figure supplement 1.. Visualization of ESCRT-III and Vps4E233Q recruitment dynamics by LLSM.
(a–e) Representative views obtained after 3D deconvolution and volume rendering of LLSM images from a single time point (25.5 s) of yeast cells expressing a mixture of Snf7 and Snf7-eGFP orVps24-eGFP together with Vps4-mCherry or Vps4E233Q-mCherry instead of Vps4 or of cells expressing Vps4E233Q-eGFP instead of Vps4 (see also Videos 3–7). The images show only the eGFP channel. The right-hand panels illustrate the complexity of the 3D image and include the orthogonal projection along the xy axis (black). Scale bar = 5 µm. Each left-hand panel shows enlarged regions overlaid with tracks of representative diffraction-limited fluorescent cytosolic objects (class I) of increasing lifetimes and examples of non-diffraction limited perivacuolar objects (class II); these were traced automatically in 3D and in time and color-coded for their content of fluorescent molecules. The plots show the fluorescence signal (converted to the number of fluorescent molecules on the trace (green) with the local background (gray) including the 95% confidence interval of the measurements (light gray). Additional traces are shown in Figure 4—figure supplements 2–9. Scale bar = 5 µm.
Figure 4.
Figure 4.. Analysis of ESCRT-III and Vps4 recruitment to peripheral endosomes.
Quantitative analysis of time series acquired with the LLSM over the full volume of 300–1000 yeast cells expressing a mixture of Snf7 and Snf7-eGFP with either Vps4-mCherry or Vps4E233Q-mCherry mutant, Vps24-eGFP with Vps4-mCherry or Vps4E233Q-mCherry, and Vps4-eGFP or Vps4E233Q-eGFP. Snf7-eGFP and Vps4-eGFP was also analyzed in pep12Δ mutants. The data presented are from all diffraction limited mobile objects (class I) detected in the periphery of cells (a, c, d) or in both peripheral and perivacuolar regions (b). (a) Cross-correlation of the fluorescence intensity (blue) and of the fluorescence intensity first derivative (orange) from Snf7-eGFP and Vps4-mCherry or from Vps24-eGFP and Vps4-mCherry. Data are from traces with lifetimes longer than 11 s and are expressed as average ± SD. (b) Plots showing the lifetime distribution (histogram) and corresponding cumulative frequency distribution (dotted curves) of Snf7-eGFP, Vps24-eGFP and Vps4-eGFP in WT cells and in the indicated mutants. The two-sample permutation test for differences between the medians was not significant. The number of tracked traces analyzed for each experiment is indicated. The inset showing a typical trace illustrates the definition of lifetime. (c) Plots showing the maximum accumulation (histogram) and corresponding cumulative frequency (dotted curve) distributions of fluorescent molecules of Snf7-eGFP, Vps24-eGFP and Vps4-eGFP in WT cells in the indicated mutants. Mutating Vps4 had minimal effects on the modes of maximum Snf7-eGFP recruitment (35 ± 12 and 30 ± 10, amplitude ± SD of the first fitted Gaussian, for wild-type and Vps4E233Q mutant, respectively) or of Vps24-eGFP (21 ± 5 and 17 ± 6; p<0.001, Kolmogorov-Smirnov and the two-sample permutation tests). Vps4E233Q or loss of Pep12 had a marked effect on the accumulation of Vps4-eGFP itself (from 24 ± 6 to 11 ± 3 and 12 ± 3 in wild-type Vps4, Vps4E233Q, and pep12Δ mutants, respectively; p<0.001). The inset of a typical trace illustrates the definition of maximum accumulation. (d) Averaged number of eGFP molecule traces per lifetime cohort, shown as mean ± 95th percentile confidence bound (shaded areas) for all traces above the local background threshold analyzed in (c). The data is for Snf7-eGPF, Vps24-eGFP and Vps4-eGFP expressed in the indicated wild type and mutant yeast cell strains. The Vps4-eGFP data from the pep12Δ mutant corresponds to traces likely to be associated with a single endocytic carrier; they correspond to events whose maximum accumulation of Vps4-eGFP molecules were within the 99th percentile of the first Gaussian distribution (Figure 4—figure supplement 10f). The complete data set is shown in Figure 4—figure supplement 10g.
Figure 4—figure supplement 1.
Figure 4—figure supplement 1.. Analysis of ESCRT-III and Vps4 recruitment associated with perivacuolar endosomes.
Analysis of diffraction-limited perivacuolar traces in yeast cells expressing Snf7 and Snf7-eGFP together with Vps4-mCherry or Vps4E233Q-mCherry, Vps24-eGFP together with Vps4-mCherry or Vps4E233Q-mCherry, and Vps4-eGFP or Vps4E233Q-eGFP. (a) Plots show the maximum accumulation (histogram) and corresponding cumulative frequency distribution (dotted curves) of fluorescent molecules. The number of ESCRT-III and Vps4 recruited to the cluster of perivacuolar endosomes is, as expected, larger than to single peripheral endosomes (Figure 4c). (b) Plots show the difference between the averages of local maxima and minima accumulation (histogram) and corresponding cumulative frequency distribution (dotted curves) of fluorescent molecules. The magnitude of the fluctuations in the cluster of perivacuolar endosomes is similar to the maximum accumulation observed in single peripheral endosomes (Figure 4c). (c) Plots showing the average accumulation (histogram) and corresponding cumulative frequency (dotted curve) distributions of fluorescent molecules determined for all traces in the peripheral regions. (d) Transmission electron microscopy on ultrathin sections from high-pressure frozen yeast cells. In control cells expressing Vps4-eGFP or Snf7-eGFP and over-expressing Vps21 (TDH3-VPS21) to facilitate the detection of MBVs (Adell et al., 2014), MVBs were marked with gold-labeled antibodies specific for eGFP. In pep12Δmutants expressing Vps4-eGFP, small vesicles marked with gold-labeled antibodies specific for eGFP were detected. The images show typical examples and magnifications of the indicated areas. Scale bars = 200 nm. Bottom right scale bar = 50 nm.
Figure 4—figure supplement 2.
Figure 4—figure supplement 2.. Traces of Snf7-eGFP and Vps4-mCherry obtained by LLSM.
Plots showing representative examples of fluorescence traces clustered as cohorts of increasing lifetimes obtained by LLSM of cells expressing Snf7-eGFP and Vps4-mCherry. Vps4-mCherry traces are only shown when they were statistically significant above background.
Figure 4—figure supplement 3.
Figure 4—figure supplement 3.. Traces of Vps24-eGFP and Vps4-mCherry obtained by LLSM.
Plots showing representative examples of fluorescence traces clustered as cohorts of increasing lifetimes obtained using LLSM of cells expressing Vps24-eGFP and Vps4-mCherry. Vps4-mCherry traces are only shown when they were statistically significant above background.
Figure 4—figure supplement 4.
Figure 4—figure supplement 4.. Traces of Vps4-eGFP obtained by LLSM.
Plots showing random examples of fluorescence traces clustered as cohorts of increasing lifetimes obtained by LLSM of cells expressing Vps4-eGFP. Traces include the 95% confidence interval of the measurement (lighter color) and the local background (thinner lines). Open circles indicate that the track was lost for one frame.
Figure 4—figure supplement 5.
Figure 4—figure supplement 5.. Traces of Snf7-eGFP in pep12Δ mutants obtained by LLSM.
Plots showing representative examples of fluorescence traces clustered as cohorts of increasing lifetimes obtained by LLSM of cells expressing Snf7-eGFP in pep12Δ mutants.
Figure 4—figure supplement 6.
Figure 4—figure supplement 6.. Traces of Vps4-eGFP in pep12Δ mutants obtained by LLSM.
Plots showing random examples of fluorescence traces clustered as cohorts of increasing lifetimes obtained by LLSM of pep12Δ mutants expressing Vps4-eGFP. Traces include the 95% confidence interval of the measurement (lighter color) and the local background (thinner lines). Open circles indicate that the track was lost for one frame.
Figure 4—figure supplement 7.
Figure 4—figure supplement 7.. Traces of Snf7-eGFP and Vps4E233Q-mCherry obtained by LLSM.
Plots showing representative examples of fluorescence traces clustered as cohorts of increasing lifetimes obtained by LLSM of cells expressing Snf7-eGFP and Vps4E233Q-mCherry. Vps4E233Q-mCherry traces are only shown when they were statistically significant above background.
Figure 4—figure supplement 8.
Figure 4—figure supplement 8.. Traces of Vps24-eGFP and Vps4E233Q-mCherry obtained by LLSM.
Plots showing representative examples of fluorescence traces clustered as cohorts of increasing lifetimes obtained using LLSM of cells expressing Vps24-eGFP and Vps4E233Q-mCherry. Vps4E233Q-mCherry traces are only shown when they were statistically significant above background.
Figure 4—figure supplement 9.
Figure 4—figure supplement 9.. Traces of Vps4E233Q-eGFP obtained by LLSM.
Plots showing random examples of fluorescence traces clustered as cohorts of increasing lifetimes obtained by LLSM of cells expressing Vps4E233Q-eGFP. Traces include the 95% confidence interval of the measurement (lighter color) and the local background (thinner lines). Open circles indicate that the track was lost for one frame.
Figure 4—figure supplement 10.
Figure 4—figure supplement 10.. Composition of Vps4 in the cytosol of wt cells and on the endosomes in pep12Δ mutants.
(a – d) Cytosolic Vps4-eGFP is mostly a monomer. Cell lysates obtained from yeast cells expressing Vps4-eGFP were placed in contact with glass coverslips and illuminated continuously with a spinning disc confocal microscope. The snapshots and the kymograph are from a time series obtained using 2 s exposures of yeast cells exposed before lysis to DMSO (a) or DMSO together with 5 mM DSP crosslinker (b). Distribution of intensity changes for a single bleaching step determined as described (Cocucci et al., 2012) in the absence (c) or presence (d) of DSP. The single-molecule eGFP calibration shows a normal distribution for (c) and a linear combination of two normal distributions for (d). (e) Plot showing the single-molecule eGFP calibration derived from a single bleaching step of recombinant eGFP determined by LLSM (f) Distribution in the number of Vps4 molecules and the corresponding Gaussian fits to the first mode in cells expressing Vps4-E233Q-eGFP or in wild type or pep12Δ yeast strains expressing Vps4-eGFP. (g) Averaged number of eGFP molecule traces per lifetime cohort, shown as mean ± 95th percentile confidence bound (shaded areas) for all traces above the local background threshold analyzed in Figure 3c.
Figure 5.
Figure 5.. Acute cytosolic depletion of Vps4 blocks endosomal traffic to the vacuole and changes the structure of perivacuolar MVBs.
Rapid depletion of cytosolic Vps4-eGFP-FRB was achieved by its capture on the cytosolic surface of the plasma membrane induced by rapamycin-mediated heterodimerization with Pma1-FKBP12. (a) Phase contrast and live cell epifluorescence microscopy of yeast cells expressing Vps4-eGFP-FRB (green) and the cargo Mup1-mRuby2 (red) before (panel 1) or 60 min after addition of methionine (panels 2–4), used to activate endocytosis of Mup1 and its transport into the vacuole. Rapamycin was added to deplete Vps4-eGFP-FRB (panel 3, 4), and untagged Vps4 was co-expressed to rescue the anchor-away effect (panel 4). The locations of the plasma membrane (PM), vacuole (V) and class E compartment (E) are indicated. Scale bar = 5 µm. (b) SDS-PAGE and western blot analysis with the indicated antibodies of samples from equal volumes of membrane and cytosolic fractions of Vps4-eGFP cells, vps4Δ mutants and Vps4-eGFP-FRB cells in the absence and presence of rapamycin. (c) Live cell epifluorescence and phase contrast microscopy of yeast cells expressing a mixture of Snf7 and Snf7-eGFP together with Vps4-FRB before or after the addition of rapamycin. Scale bar = 5 µm. (d) 3D model (top) and 2D slices (bottom) of tomographic reconstructions obtained from 400 nm slices of yeast cells before and after addition of rapamycin. The images show typical examples of MVBs containing ILVs (red) surrounded by the limiting membrane (yellow), endosomes lacking ILVs and an example of class E-like compartment (green); arrowheads point to ILV buds. To facilitate the imaging, MBVs were clustered in one region by overexpression of Vps21 (TDH3-VPS21) (Adell et al., 2014). Scale bar = 100 nm. The outcome of the morphological analysis of all MVBs (fully or only partially present in the section) is shown.
Figure 5—figure supplement 1.
Figure 5—figure supplement 1.. Effects of the acute depletion of the cytosolic Vps4 pool.
(a) Schematic representation of the anchor away approach used to acutely deplete the amount of cytosolic Vps4-FRB (OFF). Addition of rapamycin (RAP) results in the association of Vps4-FRB with the highly abundant Pma1-FKBP12 stable located at the plasma membrane. (b) Live cell phase contrast and epifluorescence microscopy of yeast cells expressing Vps4-eGFP-FRB alone or with Vps4-mCherry before or after exposure to 1 µg/ml rapamycin for less than one minute or 30 min. It shows the rapid effect of the anchor away approach as reflected by the stable accumulation of Vps4 at the plasma membrane and its depletion from intracellular endosomal carriers. (c) Live cell confocal microscopy fluorescence recovery after photo-bleaching (FRAP) of Vps4-eGFP-FRB before and 10 min after the addition of 1 µg/ml rapamycin. The images in the top show typical examples of FRAP results for perivacuolar endosomes located next to the vacuole labeled with internalized FM4-64 dye. The images in the bottom show an overview of the selected cells and the photobleached area (arrow). Scale bar = 5 µm. The plots show the fluorescence traces and the fitted FRAP pattern for cells expressing Vps4-FRB-eGFP before (n = 21) or after rapamycin addition (n = 28), for cells expressing Vps4-eGFP (n = 34) and for cells expressing Vps4E233Q-eGFP (n = 26). Their distribution of fitted time constants is shown in the histogram. The box plot shows median, 25th, and 75th percentiles and outermost data points of the fitted time constants. The permutation test for differences between the means of the time constants was not significant. (d) The top panels (a–d) are low magnification views of MBVs highlighting the region (dotted squares) used for the tomographic reconstructions depicted in Figure 5d. Panel E corresponds to another example observed after 120 min incubation with rapamycin; it also shows the accumulation of nearly empty perivacuolar endosomes mostly lacking buds located in proximity to the class E compartment. Enlarged views of the selected regions 1–3 are shown. Limiting MVB membrane (yellow), ILVs (red) and class E-like structures (green) are indicated; arrowheads point to ILV buds. Scale bar = 100 nm (a–e) and 20 nm (1, 2, 3).
Figure 6.
Figure 6.. Proposal of a model for the mechanism of ESCRT-mediated intraluminal vesicle formation.
The figure shows a schematic representation for possible stages during the budding and scission of ILVs in MVBs. ESCRT-0-II (not shown) bind cargo proteins and nucleate rapid assembly of several ESCRT-III filaments. These ESCRT-III assemblies grow and shrink stochastically and recruit Vps4. ESCRT-III dynamics occur continuously throughout the formation of ILVs and do not require Vps4. When recruited, Vps4 hexamers, docked by MIT-MIM association on one filament, exerts ATP-dependent force on another filament by pulling the C-terminus of an ESCRT-III subunit into the hexamer pore; as the cycling process ensues, the filament movement drives crowding of the membrane-anchored cargo. The crowding forces membrane invagination, to create the surface area needed to accommodate the cargo molecules. The forces exerted by the interactions between ESCRT-III and Vps4 hexamers also generate the neck of the nascent bud, lead to membrane constriction and ultimately to vesicle fission and final release of the ESCRT machinery.

References

    1. Adell MA, Vogel GF, Pakdel M, Müller M, Lindner H, Hess MW, Teis D. Coordinated binding of Vps4 to ESCRT-III drives membrane neck constriction during MVB vesicle formation. The Journal of Cell Biology. 2014;205:33–49. doi: 10.1083/jcb.201310114. - DOI - PMC - PubMed
    1. Aguet F, Antonescu CN, Mettlen M, Schmid SL, Danuser G. Advances in analysis of low signal-to-noise images link dynamin and AP2 to the functions of an endocytic checkpoint. Developmental Cell. 2013;26:279–291. doi: 10.1016/j.devcel.2013.06.019. - DOI - PMC - PubMed
    1. Aguet F, Upadhyayula S, Gaudin R, Chou YY, Cocucci E, He K, Chen BC, Mosaliganti K, Pasham M, Skillern W, Legant WR, Liu TL, Findlay G, Marino E, Danuser G, Megason S, Betzig E, Kirchhausen T. Membrane dynamics of dividing cells imaged by lattice light-sheet microscopy. Molecular Biology of the Cell. 2016;27:3418–3435. doi: 10.1091/mbc.E16-03-0164. - DOI - PMC - PubMed
    1. Alam SL, Sun J, Payne M, Welch BD, Blake BK, Davis DR, Meyer HH, Emr SD, Sundquist WI. Ubiquitin interactions of NZF zinc fingers. The EMBO Journal. 2004;23:1411–1421. doi: 10.1038/sj.emboj.7600114. - DOI - PMC - PubMed
    1. Arlt H, Auffarth K, Kurre R, Lisse D, Piehler J, Ungermann C. Spatiotemporal dynamics of membrane remodeling and fusion proteins during endocytic transport. Molecular Biology of the Cell. 2015;26:1357–1370. doi: 10.1091/mbc.E14-08-1318. - DOI - PMC - PubMed

MeSH terms

Substances