. 2017 Oct 19;550(7676):393-397.
doi: 10.1038/nature24052. Epub 2017 Oct 11.

Establishment of mouse expanded potential stem cells

Affiliations

Establishment of mouse expanded potential stem cells

Jian Yang et al. Nature. .

Abstract

Mouse embryonic stem cells derived from the epiblast contribute to the somatic lineages and the germline but are excluded from the extra-embryonic tissues that are derived from the trophectoderm and the primitive endoderm upon reintroduction to the blastocyst. Here we report that cultures of expanded potential stem cells can be established from individual eight-cell blastomeres, and by direct conversion of mouse embryonic stem cells and induced pluripotent stem cells. Remarkably, a single expanded potential stem cell can contribute both to the embryo proper and to the trophectoderm lineages in a chimaera assay. Bona fide trophoblast stem cell lines and extra-embryonic endoderm stem cells can be directly derived from expanded potential stem cells in vitro. Molecular analyses of the epigenome and single-cell transcriptome reveal enrichment for blastomere-specific signature and a dynamic DNA methylome in expanded potential stem cells. The generation of mouse expanded potential stem cells highlights the feasibility of establishing expanded potential stem cells for other mammalian species.


Conflict of interest statement

Competing interests

The Genome Research Limited has filed a provisional patent application that covers the derivation and maintenance of expanded potential stem cells (European patent application number 15797300.9-1402). P.L., D.J.R., J.Y., W.W. and X.G. are listed as inventors.

Figures
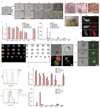
Ext Data Fig 1
Ext Data Fig 1
a, Phase images showing development of eight-cell mouse embryos in EPSCM or in M15. Note that in embryos in EPSCM, the blastocoel cavity was filled with cells and the embryos hatched at day 7 or 8. b, EPSCs derived from pre-implantation embryos express pluripotency markers. Analysis of pluripotency markers in two embryo-derived EPSC lines (DR25 and DR10), one reprogrammed iPS cell–EPSC line and two embryo-derived 2i/LIF ES cell lines (DR4 and DR9). Expression of pluripotency genes was relative to Gapdh in the RT–qPCR assay. Data are mean ± s.d. (n = 3). Overlaid dot plots indicate the distribution of the data. c, Expression of lineage-specific genes in the cells described in b. Expression of these genes was relative to Gapdh. Data are mean ± s.d. (n = 3). Overlaid dot plots indicate the distribution of the data. d, Spectral karyotyping of DR10-EPSCs (normal karyotype in eight out of ten metaphases) at passage 10. e, Mature teratomas from DR10-EPSCs. Left: ectodermal neural tube-like structures; middle: mesodermal cartilage; right: an endodermal gland structure of gastrointestinal type and mesodermal muscle fibres. The sections were stained with haematoxylin–eosin. f, A chimaera derived from DR10-EPSCs. g, The mCherry+ EPSCs show extensive contribution to the 14.5 d.p.c. gonad, similar to 2i/LIF ES cells. h, Additional images of EPSC contributions in the trophectoderm of the blastocyst. The two images on the top are merged live images (phase and mCherry), which show the contribution of mCherry (cytoplasmic)-labelled 2i/LIF ES cells or ES cell–EPSCs. The two at the bottom are immunostaining images to detect H2B–mCherry-expressing AB2.2 ES cell–EPSCs and the trophectoderm cells (Cdx2+). i, Rex1–GFP reporter ES cell colonies in M15, 2i/LIF or EPSCM on SNL feeder. j, Expression of the reporter GFP in ES cells cultured in EPSCM (passage 3). Top: Oct4–GFP ES cells (E14Tg2a) cultured in M15, 2i/LIF or EPSCM. In all conditions, Oct4–GFP expression was detected by FACS. Bottom: Rex1–GFP ES cells (AB2.2 background) have comparable levels of Rex1 expression (GFP) when cultured in EPSCM or subsequently returned to 2i/LIF. Negative control: wild-type ES cells. k, Expression of pluripotency genes or lineage-specific genes in ES cells cultured in EPSCM (ES cell–EPSCs). Expression of these genes was relative to Gapdh. Data are mean ± s.d. (n = 2). Overlaid dot plots indicate the distribution of the data.
Ext Data Fig 2
Ext Data Fig 2
a, Left: Oct4 distal and proximal enhancer luciferase reporter constructs. DE, the Oct4 distal enhancer; PE, the Oct4 proximal enhancer; MiniP, the minimum promoter. The Oct4 distal enhancer is active in ES cells cultured in EPSCM. Right: luciferase activities of the Oct4 DE and PE constructs were normalized to that of the MiniP construct in the same cell type. Data are mean ± s.d. (n = 3). b, Differentiation of ES cell–EPSCs in vitro into cells of three germ layers detected by the immunostaining of class III β-tubulin, α-smooth muscle actin (SMA) and Gata4. c, A male chimaera from ES cell–EPSCs, and germline transmission of the Rex1–GFP allele from the chimaera. d, Activation of X chromosomes in female ES cell–EPSCs. EPSCs or the cells differentiated from EPSCs were co-immunostained for H3K27me3 and Oct4. No discrete H3K27me3 foci were found in EPSCs. Once the cells differentiated, the foci appeared in almost all cells. Arrows point to H3K27me3 foci. e, f, Effects of small-molecule inhibitors on their respective targets. p-ERK, phosphorylated ERK; p-Src, phosphorylated Src; p-P38, phosphorylated P38; p-JNK, phosphorylated JNK. α-Tubulin was used as the loading control. Note the substantial increase of axin1. EPSCM contains 20% KSR so KSR-2i/LIF is the appropriate negative control. XAV939 in EPSCM stabilizes axin1 by inhibiting its ubiquitination. EPSCs had considerably elevated levels of axin1 compared with controls (arrow), which caused accumulation of phosphorylated β-catenin in both the cytoplasm and nuclei and decreased active β-catenin in the nucleus. α-Tubulin and histone H3 were used as the loading controls of cytoplasmic and nuclear proteins, respectively. The gel source data are in Supplementary Fig. 1. g, Reduced β-catenin–LEF/TCF activity in EPSCs detected by TOPflash luciferase assay. TOPflash luciferase activity was normalized to that of EPSCs grown in M15 medium. Data are mean ± s.d. (n = 8 for M15, 9 for N2B27-2i/LIF and EPSCM). Two-sided Student’s t-test was performed. ***P < 0.001. h, Western blot analysis shows increased p-STAT3 in ES cell–EPSCs with increased concentrations of LIF. The gel source data are in Supplementary Fig. 1. i, Upregulation of downstream LIF pathway genes in ES cell–EPSCs in response to LIF stimulation. Two-sided Student’s t-test was performed. Data are mean ± s.d. (n = 3). *P < 0.05; **P < 0.01; ***P < 0.001. j, Signalling pathway dependence in ES cell–EPSCs. ES cells and EPSCs (n = 100 for each cell type) cultured in M15, 2i/LIF or EPSCM with inhibitors of JAK (JAK inhibitor 1), FGFR (SU5402), TGFβR (A83-01) or ALK5 (SB505124). Alkaline phosphatase-positive (AP+) colonies were scored after 10 days. The JAK inhibitor substantially reduced the number of AP+ colonies from these cells. By contrast, ES cells cultured in EPSCM did not appear to be sensitive to FGFR or TGFβR inhibitors, similar to 2i/LIF ES cells. Data are mean ± s.d. (n = 3 for control, 4 for inhibitors). ***P < 0.001.
Ext Data Fig 3
Ext Data Fig 3
a, Whole-mount immunostaining of 6.5 d.p.c. chimaeras for H2B–mCherry and Elf5. In the chimaeras shown, the descendants of EPSCs were found both in the embryo proper and in the ExE. One of the chimaeras (number five from the top) has EPSC contribution predominantly in the Elf-5-expressing ExE. The live images at the bottom show the contribution of EPSCs predominantly in the ExE and ectoplacental cone (EPC) (mCherry in Cambridge, GFP in Tokyo). b, Whole-mount fluorescence imaging of 14.5 d.p.c. chimaeras from morulas injected with ES cells or EPSCs. Negative control: wild-type embryo or chimaeras from unlabelled EPSCs. Em, embryo; Yo, yolk sac; Pl, placenta. Inset tables show the frequency of contribution by the stem cells to the chimaeras. c, Percentages of EPSC or ES cell contributions in independent chimaeras (n = 6 for DR10-EPSC; n = 9 for AB2.2-EPSC; n = 6 for AB2.2-ES cell control). Cells from the brain (Br), liver (Li) and placenta (Pl) were collected for flow cytometric analysis. d, Detection of polyploid placenta cells by flow cytometry. A distinct population of 8N cells is present in both mCherry+ and mCherry placenta cells from an AB2.2-EPSC chimaera. Fetal brain cells were used as the control. No mCherry+ 8N cells could be detected in the placenta from 2i/LIF ES cells. e. Placenta sections of 14.5 d.p.c. chimaeras from either ES cells or EPSCs (AB2.2, mCherry+) were co-immunostained for mCherry and Tfap2c. mCherry+ cells were detected in the EPSC chimaera placenta; some of these cells were positively stained for both mCherry and Tfap2c (arrows). The areas framed in the low-magnification DAPI staining (insets) indicate the positions of the placenta section images. Abbreviations: laby, labyrinth; sp., spongiotrophoblast layer; gc, trophoblast giant cell layer.
Ext Data Fig 4
Ext Data Fig 4
a, Whole-mount fluorescence of 14.5 d.p.c. chimaeras from eight-cell embryos and a single EPSC or ES cell. Negative control: wild-type embryo. Inset table shows the frequency of contribution by the stem cells to the chimaeras. b, Flow cytometry analysis of mCherry+ placenta cells in single-EPSC-injected chimaeras. c, Expression of trophoblast genes in mCherry+ and mCherry placenta cells sorted from the single-EPSC chimaera. Expression was relative to Actb and normalized to fetal brain expression. Data are mean ± s.d. (n = 3). Overlaid dot plots indicate the distribution of the data. Sorting was performed as in Fig. 2c. d, Detection of polyploid placenta cells. A distinct population of 8N cells was found both in mCherry+ and in mCherry placenta cells in an EPSC chimaera.
Ext data Fig 5
Ext data Fig 5
a, Whole-mount fluorescence of 14.5 d.p.c. chimaeras from eight-cell embryos and a single EPSC or ES cell. Negative control: wild-type embryo. Inset table shows the frequency of contribution by the stem cells to the chimaeras. b, Flow cytometry analysis of mCherry+ placenta cells in single-EPSC-injected chimaeras. c, Expression of trophoblast genes in mCherry+ and mCherry placenta cells sorted from the single-EPSC chimaera. Expression was relative to Actb and normalized to fetal brain expression. Data are mean ± s.d. (n = 3). Overlaid dot plots indicate the distribution of the data. Sorting was performed as in Fig. 2c. d, Detection of polyploid placenta cells. A distinct population of 8N cells was found both in mCherry+ and in mCherry placenta cells in an EPSC chimaera.
Ext Data Fig 6
Ext Data Fig 6
a, Effects of individual inhibitors on trophectoderm contribution. Mouse ES cells (mCherry+ AB2.2) were cultured in various combinations of inhibitors for at least five passages before injection into eight-cell embryos and examination at the blastocyst stage. Blastocysts were scored for the donor cells’ trophectoderm contribution. A, A419259; X, XAV939; JNKi, JNK Inhibitor VIII; p38i, SB203580; CH, CHIR99021. All culture conditions contained KSR and LIF. For each culture condition, 38–58 embryos were scored. b, The effect of CHIR99021 (CH) in EPSCM on cells. One thousand EPSCs cultured in either EPSCM or EPSCM minus CH were plated for single-cell colony formation assay. AP+ colonies were scored on day 7 (n = 3). A two-sided Student’s t-test was performed. Data are mean ± s.d. (n = 3). ***P < 0.001. c, Gene expression in ES cells cultured in minimum sets of inhibitors. Expression of genes was relative to Gapdh in the RT–qPCR assay. Data are mean ± s.d. (n = 3). Overlaid dot plots indicate the distribution of the data. d, Flow cytometry analysis of mCherry+ placenta cells of 14.5 d.p.c. chimaeras from ES cells cultured in 2i+A medium. To minimize residual background cell sorting, a GFP channel was used to exclude autofluorescence. e, Expression of trophoblast-enriched genes in cells sorted from the placenta of chimaeras. The mCherry+ placenta cells were sorted as in d from chimaeras of ES cells cultured in 2i+A medium. Expression was relative to Actb. Data are mean ± s.d. (n = 3). Overlaid dot plots indicate the distribution of the data. f, Yolk sac sections of 14.5 d.p.c. chimaeras of ES cells (2i+A) or the wild-type negative control. Immunostaining and imaging were performed in the same way as in Extended Data Fig. 4c. The mCherry fluorescence signal was quenched by fixation. Donor cells were stained by a CF660C-conjugated antibody against mCherry (panels 1 and 1′). DAPI staining was used to detect the nucleus (panels 2 and 2′). Donor-cell derivatives were found in both the extra-embryonic mesoderm (endothelial and mesothelial cells) and extra-embryonic endoderm cells in the yolk sac of EPSC chimaera, but not in the yolk sac of the negative control chimaera (3 and 3'). Arrows point to extra-embryonic endoderm, extra-embryonic mesoderm.
Ext data Fig 7
Ext data Fig 7
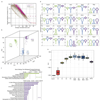
a, Scatter plot showing the relationship of EPSC gene expression variability with expression levels in scRNA-seq data. The magenta dots represent genes that showed significantly higher variability (adjusted P < 0.1) than would be expected from the external RNA spike-ins (blue dots). b, Three-dimensional scatter plot showing the separation of 2i/LIF ES cells, M15 ES cells and EPSCs in PCA of scRNA-seq data. Each dot represents a cell. c, Bar graph showing Gene Ontology terms enriched in differentially expressed genes between 2i/LIF ES cells and EPSCs in scRNA-seq data. d, Violin plots comparing expression of selected pluripotency regulators, DNA methylation regulators and two-cell embryo-associated genes in 2i/LIF ES cells, M15 ES cells and EPSCs in scRNA-seq data. The dot marks the median of the data. EPSCs (n = 84); 2i/LIF ES cells (n = 82); M15 ES cells (n = 91). e, Box plot comparing the distribution of pre-implantation embryos, 2i/LIF ES cells and EPSCs in the first principal component in PCA. The bar and the small square in the boxes mark the median and mean scores of each group. The upper and lower hinge, and the upper and lower whiskers, mark the first and third quartiles of the data, and the smallest and largest observation excluding outliers, respectively. Outliers were determined as observations less than the first quartile −1.5× interquartile range and observations larger than the third quartile +1.5× interquartile range. The PCA was performed with differentially expressed genes between EPSCs and 2i/LIF ES cells.
Ext data Fig 8
Ext data Fig 8
a, Three-dimensional scatter plot showing the separation of Hex-Venus+ 2i/LIF ES cells, MERV-TdT+ ES cells, in vivo iPS cells (iviPS cell), 2i/LIF ES cells, M15 ES cells and EPSCs in PCA of bulk RNA-seq data. b, Bar graph comparing the relative expression levels of MERV transcripts in EPSCs and MERV-TdT+ ES cells to MERV-TdT ES cells. c, Signal intensity distribution of EPSC H3K4me3 and H3K27me3 modification over gene bodies and 3 kb up- and downstream of the transcription start site (TSS) and transcription end site (TSE). Genes are classified into ‘very high’, ‘high’, ‘low’ and ‘very low’, depending on their length-corrected mean-normalized count quartiles in the single-cell RNA-seq dataset. d, Distribution of H3K27me3 (left) and H3K4me3 (right) signals at gene promoters (±3 kb from TSS). The promoters were ranked on the basis of their length-corrected mean-normalized count levels in the single-cell RNA-seq dataset. The signals were quantified as read count per million mapped reads. e, Profiles of H3K4me3 and H3K27me3 of 2i/LIF ES cells and EPSCs at selected pluripotency-associated loci. f, Bar graph showing −log(P value) of each development-related Gene Ontology term enriched in EPSC-specific bivalent genes only. g, Profiles of H3K4me3 and H3K27me3 at selected loci in pre-implantation embryos, EPSCs and 2i/LIF ES cells. Note the similar H3K27me3 profiles in EPSCs and in two-cell or eight-cell embryos. h, Profiles of H3K27ac signals of oocyte, two-cell embryos, eight-cell embryos, 2i/LIF ES cells and EPSCs in selected super-enhancer-associated genes, including the Oct4, Klf5 and Gata3 loci. Note that the super-enhancer at the Gata3 locus is present in EPSCs and in eight-cell embryos but not in 2i/LIF ES cells.
Ext data Fig 9
Ext data Fig 9
a, Immunofluorescence for GFP in EPSCs or 2i/LIF ES cells cultured in TX medium for 6 days. Small patches of Cdx2+ cells were detected only in differentiated EPSCs, but not 2i/LIF ES cells. DAPI stains the nucleus. The Cdx2+ cells account for around 1.0% of total cells in flow cytometry. b, Expression of Cdx2, Eomes and Tfap2c in established EPSC TSCs detected by immunostaining. Four EPSC TSC lines were established from Cdx2–GFP EPSCs. c, Heat map comparing the expression of transcription factors of pluripotency, embryo lineages or trophectoderm development in EPSCs, embryo-derived TSCs and multiple lines of EPSC-derived TSCs. The expression levels were calculated in log-transformed values of transcript per million (TPM). EPSC rep1 and rep2 are two biological replicates of EPSC RNA samples. d, DNA demethylation at the Elf5 locus in EPSC TSCs (n = 10). e, Phase images of EPSC TSCs in differentiation medium (RPMI 1640 plus 20% serum without FGF4 and heparin) for the indicated days. Arrows indicate polyploid trophoblasts. f, RT–qPCR analysis of EPSC TSCs or the control TSCs at different days of differentiation. Cdx2 was downregulated while expression of mature trophoblast genes was upregulated. Expression levels are relative to Gapdh. Data are mean ± s.d. (n = 3 technically independent samples). Overlaid dot plots indicate the distribution of the data. g, Immunofluorescence staining of differentiated EPSC TSCs or TSCs for placenta lactogen-1 (PL-1) (day 8). The insets show DAPI staining results. h, Representative images of haemorrhagic lesions in NSG mice 7 days after subcutaneous injection of EPSC TSCs or TSCs. i, Haematoxylin and eosin sections of haemorrhagic lesions of EPSC TSCs or TSCs. The images show that the well-defined haemorrhagic lesions are lined by large and occasionally multinucleated pleomorphic cells with abundant cytoplasm. These large cells that demarcate the blood-filled space are reminiscent of trophoblast giant cells.
Ext data fig 10
Ext data fig 10
a, Live images of Gata6H2B-Venus+ XEN cells derived directly from EPSCs in vitro. b, RT–qPCR analysis of expression of cell-type-specific genes for XEN (Gata4, Gata6, Sox7 and Sox17), TSC (Cdx2) or ES cells (Nanog). Expression levels are relative to Gapdh. Data are mean ± s.d. (n = 3 technically independent samples). Two biologically independent EPSC–XEN cell lines were analysed. Overlaid dot plots indicate the distribution of the data. c, Expression of Gata4 and Gata6 in XEN cells visualized by immunostaining. d, Contribution of Gata6H2B-Venus EPSC–XEN cells in blastocysts (n = 17) and in 6.5 d.p.c. chimaeras. The donor cells in the PrE of the hatching blastocyst or in the extra-embryonic endoderm were immunostained by the antibody to Gata6. The Oct4 antibody staining marks the embryo proper. Inset table shows the contribution. e, Contribution of ES cells overexpressing axin1 in the ExE region in 6.5 d.p.c. chimaeras. Top panels, donor ES cells in the chimaera expressed axin1 under control of the Tet/On system before injection, whereas in the bottom panels the donor cells expressed axin1 from the CAG promoter. Inset table shows the contribution. f, Western blot confirming axin1 overexpression in ES cells using either the CAG promoter or the Tet/On system. The gel source data are in Supplementary Fig. 1.
Figure 1
Figure 1
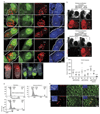
a, Derivation of EPSC lines from single blastomeres. 8C, eight-cell blastomere; D, day; P1, passage 1. Right: immunostaining for Oct4 and Cdx2 of a primary outgrowth. b, Merged live images of trophectoderm contribution of EPSCs (mCherry+) in the blastocyst and the contribution percentages. Arrows point to mCherry+ cells in the trophectoderm. c, The blastocysts (hatching) developing from morula injected with ES cells or EPSCs were stained for mCherry (in the cytoplasm) and Cdx2 (in the nucleus). DAPI stains the nucleus. The arrows indicate Cdx2+mCherry+ donor cells. n = 23 for ES cell (2i/LIF); 35 for EPSC.
Figure 2
Figure 2
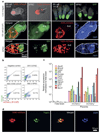
a, Whole-mount fluorescence imaging of representative 6.0–6.5 d.p.c. ES cell or EPSC chimaeric embryos produced in Cambridge, UK (AB2.2-H2B–mCherry) or at University of Tokyo (BDF1–eGFP). The top panels are four live images. The rest of the chimaeras show immunofluorescence staining for mCherry and Elf5. DAPI stains the nucleus. Chimaeras are marked by dashed lines. Arrows point to mCherry+ cells in ExE. EP, embryo proper. b, Detection of EPSC-derived mCherry+ placenta cells in 14.5 d.p.c. chimaeras in flow cytometry. c, Expression of trophoblast genes in mCherry+ and mCherry placenta cells from an EPSC 14.5 d.p.c. chimaera. Expression is relative to Actb and normalized to fetal brain expression. Data are mean ± s.d. (n = 3). Overlaid dot plots indicate the distribution of the data. Pl-1 is also known as Prl3d1; Spc4 is also known as Pcsk6. d, Detection of Tfap2c in mCherry+ cells sorted from 14.5 d.p.c. EPSC chimaera placenta. The sorted cells were stained for mCherry and Tfap2c. The experiments were repeated at least three times. Arrow points to the mCherry+Tfap2c+ cells.
Figure 3
Figure 3
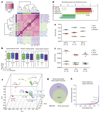
a, Unsupervised hierarchical clustering of RNA-seq data of mouse ES cell lines (AB2.2 and E14Tg2a), new ES cell lines derived in 2i/LIF media (DR4 and DR9) or EPSC lines derived in EPSCM (DR25 and DR10) from pre-implantation embryos, which were cultured in different media. Inter-sample Spearman correlation coefficient value was shown in the top left corner. b, Box plots comparing the expression variability of the global transcriptome, protein-coding genes and putative transcription factors in EPSCs and ES cells. The bar in the boxes marks the median of each group. The numbers of genes are listed in the panel. c, Three-dimensional scatter plot based on PCA of scRNA-seq data, showing the separation of pre-implantation embryos, 2i/LIF ES cells and EPSCs. d, Normalized enrichment scores of different embryonic stage-specific gene sets between EPSCs and 2i/LIF ES cells. **Nominal P < 0.01. e, f, Grouped scatter charts comparing the fractional levels of methylated (5mC) (e) and hydroxymethylated (5hmC) (f) cytosine in EPSCs and in ES cells quantified by mass spectrometry. C, cytosine. g, Venn diagram comparing the number of bivalent histone domain-associated genes. h, Super-enhancers in EPSCs. H3K27ac peak regions associated with Gata3, Oct4 or Nanog are marked. Details of informatics and statistical analyses are described in Methods.
Figure 4
Figure 4
a, Morphology and GFP expression in established Cdx2–GFP EPSC TSCs in live and immunostained images. DAPI stains the nucleus. b, Immunostaining and RT–qPCR detection of key TSC genes and of Oct4 in EPSC TSCs. Expression levels are relative to Gapdh. Data are mean ± s.d. (n = 3). Overlaid dot plots indicate the distribution of the data. c, Histology and immunostaining of sections of haemorrhagic lesions from EPSC TSCs. DAPI stains the nucleus. H&E, haematoxylin and eosin. d, Localization of TSC-derived cells in the blastocysts from injected morulas. Some donor cells expressed Cdx2. n = 28 blastocysts for TSCs; 38 for EPSC TSCs. e, Confocal microscopy images of TSCs (cytoplasmic GFP) or EPSC TSCs (H2B–mCherry) in the Elf5-expressing ExE in the 6.5 d.p.c. chimaeras. Experiments were repeated at least three times. The table lists the chimaeras versus total dissected embryos.

References

    1. Evans MJ, Kaufman MH. Establishment in culture of pluripotential cells from mouse embryos. Nature. 1981;292:154–156. - PubMed
    1. Tam PP, Rossant J. Mouse embryonic chimeras: tools for studying mammalian development. Development. 2003;130:6155–6163. - PubMed
    1. Saba-El-Leil MK, et al. An essential function of the mitogen-activated protein kinase Erk2 in mouse trophoblast development. EMBO Rep. 2003;4:964–968. - PMC - PubMed
    1. Nishioka N, et al. The Hippo signaling pathway components Lats and Yap pattern Tead4 activity to distinguish mouse trophectoderm from inner cell mass. Dev Cell. 2009;16:398–410. - PubMed
    1. Li X, et al. Calcineurin-NFAT signaling critically regulates early lineage specification in mouse embryonic stem cells and embryos. Cell Stem Cell. 2011;8:46–58. - PubMed

Publication types

MeSH terms