

doi: 10.1038/nbt.3979.
Antigen receptor repertoire profiling from RNA-seq data
Affiliations
- PMID: 29020005
- PMCID: PMC6169298
- DOI: 10.1038/nbt.3979
Item in Clipboard
Antigen receptor repertoire profiling from RNA-seq data
Nat Biotechnol.
.
No abstract available
Conflict of interest statement
Competing interests
MiLaboratory LLC develops MiXCR software and has exclusive rights for its commercial distribution.
Figures
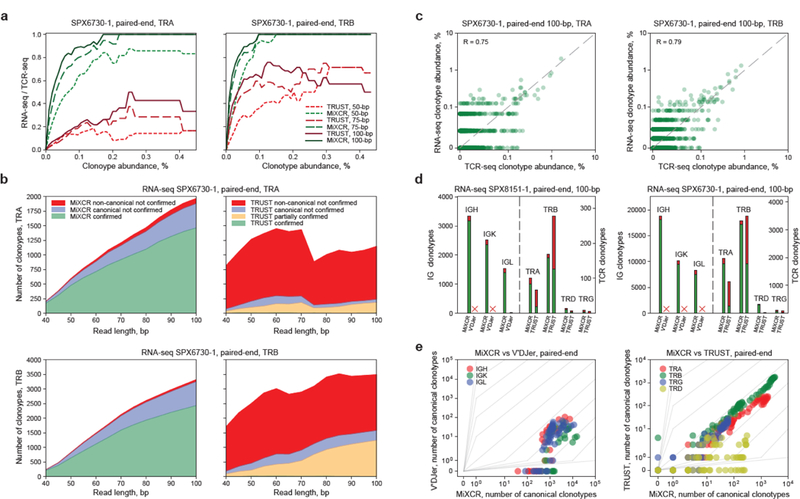
a. Dependence of the share of TCR-seq-confirmed clonotypes extracted from RNA-seq on clonotype abundance, tumor sample SPX6730. The x-axis corresponds to clonotype frequency A, as estimated from TCR-seq. The y-axis corresponds to the fraction of identified clonotypes in the total number of control clonotypes with abundance greater than A. b. Dependence of the number of TCR-seq-confirmed clonotypes (green), canonical unconfirmed clonotypes (blue), and non-canonical unconfirmed clonotypes (red) on the paired-end sequencing read length for SPX6730 sample. For TRUST data, orange denotes partially confirmed (allowing for truncation of 6 nucleotides) clonotypes. c. Correlation of TCR clonotype frequencies in MiXCR-extracted repertoires from TCR-seq and RNA-seq data from SPX6730 sample. d. Extraction of Ig and TCR CDR3 repertoires from SPX8151 and SPX6730 RNA-seq by MiXCR, TRUST and V’DJer. Cross indicates that analysis took too long (> 4 days running in 8 computing threads on Intel Xeon CPU E5–2683 v3 @ 2.00GHz with 50 GB of RAM). Canonical CDR3 clonotypes are shown in green, non-canonical clonotypes are shown in red. e. Extraction of Ig CDR3 repertoires with V’DJer and MiXCR (left) and TCR CDR3 repertoires with TRUST and MiXCR (right) from representative RNA-seq datasets. Each circle indicates the number of clonotypes extracted. Gray graduations indicate the fold-difference in the number of extracted clonotypes.
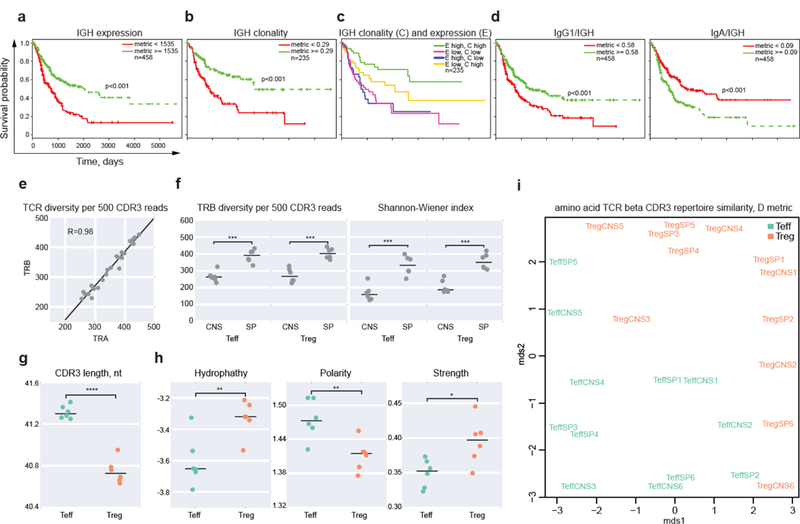
a-d. Kaplan–Meier plots depicting the survival probability over time relative to repertoire-related metrics for TCGA SKCM patient samples. Samples were divided into high (>=cutoff) and low (<cutoff) value cohorts based on the median for the relevant metric. a. IGH expression (reads per million). b. IGH clonality. Samples with at least 500 IGH CDR3 sequencing reads were included to minimize the influence of repertoire depth on clonality index. c. IGH expression and clonality. d. Kaplan-Meier plots showing survival probability relative to IgG1/IGH and IgA/IGH proportions. p values reflect log-rank test for survival difference between low and high metrics groups. n, number of patients. e-i. Comparative analysis of CD4 effector and regulatory T-cell repertoires. e. Correlation of observed TRA versus TRB CDR3 diversity per 500 unique CDR3-covering reads. f. TRB diversity observed per 500 randomly-sampled CDR3-containing reads (left), and estimated using the Shannon-Wiener index (right) for the spleen (SP) and central nervous system (CNS) samples from Foxp3yfpcre mice with induced experimental autoimmune encephalomyelitis (EAE). g. Average TRB CDR3 lengths for Teff and Treg subsets in spleen, weighted for clonotype size. h. Functional characteristics of the middle portion of CDR3 amino acid sequence for Teff and Treg TRB repertoires in the spleen. Plots show hydropathy, polarity, and strength metrics as derived from VDJtools software, weighted for clonotype size. i. Multi dimensional space analysis of TRB CDR3 amino acid repertoire overlaps, as derived with VDJtools, metric D. *P<0.05, **P<0.01, ***P<0.001, ****P<0.0001 (paired, two-tailed t test).
References
-
- Greiff V, Miho E, Menzel U & Reddy ST Trends Immunol 36, 738–749 (2015). - PubMed
Publication types
MeSH terms
Substances
Grants and funding
LinkOut - more resources
Full Text Sources
Other Literature Sources
