

Effects of socioeconomic status on esophageal adenocarcinoma stage at diagnosis, receipt of treatment, and survival: A population-based cohort study
- PMID: 29020052
- PMCID: PMC5636169
- DOI: 10.1371/journal.pone.0186350
Effects of socioeconomic status on esophageal adenocarcinoma stage at diagnosis, receipt of treatment, and survival: A population-based cohort study
Abstract
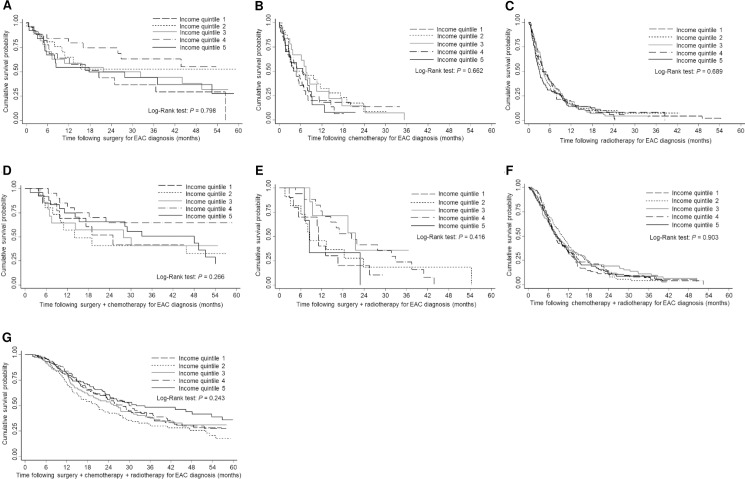
The incidence of esophageal adenocarcinoma (EAC) is increasing worldwide and has overtaken squamous histology in occurrence. We studied the impact of socioeconomic status (SES) on EAC stage at diagnosis, receipt of treatment, and survival. A population-based retrospective cohort study was conducted using Ontario Cancer Registry-linked administrative health data. Multinomial logistic regression was used to examine the association between SES (income quintile) and stage at EAC diagnosis and EAC treatment. Survival times following EAC diagnosis were estimated using Kaplan-Meier method. Cox proportional-hazards regression analysis was used to examine the association between SES and EAC survival. Between 2003-2012, 2,125 EAC cases were diagnosed. Median survival for the lowest-SES group was 10.9 months compared to 11.6 months for the highest-SES group; the 5-year survival was 9.8% vs. 15.0%. Compared to individuals in the highest-SES group, individuals in the lowest-SES category experienced no significant difference in EAC treatment (91.6% vs. 93.3%, P = 0.314) and deaths (78.9% vs. 75.6%, P = 0.727). After controlling for covariates, no significant associations were found between SES and cancer stage at diagnosis and EAC treatment. Additionally, after controlling for age, gender, urban/rural residence, birth country, health region, aggregated diagnosis groups, cancer stage, treatment, and year of diagnosis, no significant association was found between SES and EAC survival. Moreover, increased mortality risk was observed among those with older age (P = 0.001), advanced-stage of EAC at diagnosis (P < 0.001), and those receiving chemotherapy alone, radiotherapy alone, or surgery plus chemotherapy (P < 0.001). Adjusted proportional-hazards model findings suggest that there is no association between SES and EAC survival. While the unadjusted model suggests reduced survival among individuals in lower income quintiles, this is no longer significant after adjusting for any covariate. Additionally, there is an apparent association between SES and survival when considering only those individuals diagnosed with stage 0-III EAC. These analyses suggest that the observed direct relationship between SES and survival is explained by patient-level factors including receipt of treatment, something that is potentially modifiable.
Conflict of interest statement
Figures


Similar articles
-
The effect of socioeconomic status on staging and treatment decisions in esophageal cancer.J Clin Gastroenterol. 2012 Nov-Dec;46(10):833-9. doi: 10.1097/MCG.0b013e31824e8ff8. J Clin Gastroenterol. 2012. PMID: 22460163
-
Estimates and predictors of health care costs of esophageal adenocarcinoma: a population-based cohort study.BMC Cancer. 2018 Jun 27;18(1):694. doi: 10.1186/s12885-018-4620-2. BMC Cancer. 2018. PMID: 29945563 Free PMC article.
-
Surveillance endoscopy is associated with improved outcomes of oesophageal adenocarcinoma detected in patients with Barrett's oesophagus.Gut. 2016 Aug;65(8):1252-60. doi: 10.1136/gutjnl-2014-308865. Epub 2015 Aug 26. Gut. 2016. PMID: 26311716
-
Effect of socioeconomic status on hepatocellular carcinoma incidence and stage at diagnosis, a population-based cohort study.Liver Int. 2016 Jun;36(6):902-10. doi: 10.1111/liv.12982. Epub 2015 Oct 27. Liver Int. 2016. PMID: 26455359
-
Trends in esophageal cancer survival in United States adults from 1973 to 2009: A SEER database analysis.J Gastroenterol Hepatol. 2016 Jun;31(6):1141-6. doi: 10.1111/jgh.13289. J Gastroenterol Hepatol. 2016. PMID: 26749521 Free PMC article.
Cited by
-
Socioeconomic Deprivation Is Not Associated with Outcomes after Esophagectomy at a German High-Volume Center.Cancers (Basel). 2023 May 18;15(10):2827. doi: 10.3390/cancers15102827. Cancers (Basel). 2023. PMID: 37345164 Free PMC article.
-
An Urban Center Experience Exploring Barriers to Adherence to Endoscopic Surveillance for Non-Dysplastic Barrett's Esophagus.Cureus. 2021 Jan 31;13(1):e13030. doi: 10.7759/cureus.13030. Cureus. 2021. PMID: 33665052 Free PMC article.
-
Impact of socio-demographic co-variates on prognosis, tyrosine kinase-inhibitor use and outcomes in persons with newly-diagnosed chronic myeloid leukaemia.J Cancer Res Clin Oncol. 2022 Feb;148(2):449-459. doi: 10.1007/s00432-021-03624-4. Epub 2021 Apr 9. J Cancer Res Clin Oncol. 2022. PMID: 33835260 Free PMC article.
-
Risk and Status of Gastrointestinal Cancer According to the International Standard Industrial Classification in Korean Workers.Cancers (Basel). 2022 Oct 21;14(20):5164. doi: 10.3390/cancers14205164. Cancers (Basel). 2022. PMID: 36291948 Free PMC article.
-
Care of acute conditions and chronic diseases in Canada and the United States: Rapid systematic review and meta-analysis.J Public Health Res. 2019 Mar 11;8(1):1479. doi: 10.4081/jphr.2019.1479. eCollection 2019 Mar 11. J Public Health Res. 2019. PMID: 30997359 Free PMC article.
References
-
- Hur C, Miller M, Kong CY, Dowling EC, Nattinger KJ, Dunn M, et al. Trends in esophageal adenocarcinoma incidence and mortality. Cancer. 2013; 119:1149–1158. doi: 10.1002/cncr.27834 - DOI - PMC - PubMed
-
- Lepage C, Rachet B, Jooste V, Faivre J, Coleman MP. Continuing rapid increase in esophageal adenocarcinoma in England and Wales. Am J Gastroenterol. 2008; 103:2694–2699. doi: 10.1111/j.1572-0241.2008.02191.x - DOI - PubMed
-
- Pohl H, Welch HG. The role of overdiagnosis and reclassification in the marked increase of esophageal adenocarcinoma incidence. J Natl Cancer Inst. 2005; 97:142–146. doi: 10.1093/jnci/dji024 - DOI - PubMed
-
- Cancer Care Ontario. Cancer Fact: Changing patterns of esophageal cancer: adenocarcinoma on the rise. Sept. 2013. Available at: http://www.cancercare.on.ca/cancerfacts/. Accessed May 3, 2016.
MeSH terms
Supplementary concepts
LinkOut - more resources
Full Text Sources
Other Literature Sources
Medical
