

Integrated modeling and analysis of intracellular and intercellular mechanisms in shaping the interferon response to viral infection
- PMID: 29020068
- PMCID: PMC5636135
- DOI: 10.1371/journal.pone.0186105
Integrated modeling and analysis of intracellular and intercellular mechanisms in shaping the interferon response to viral infection
Abstract
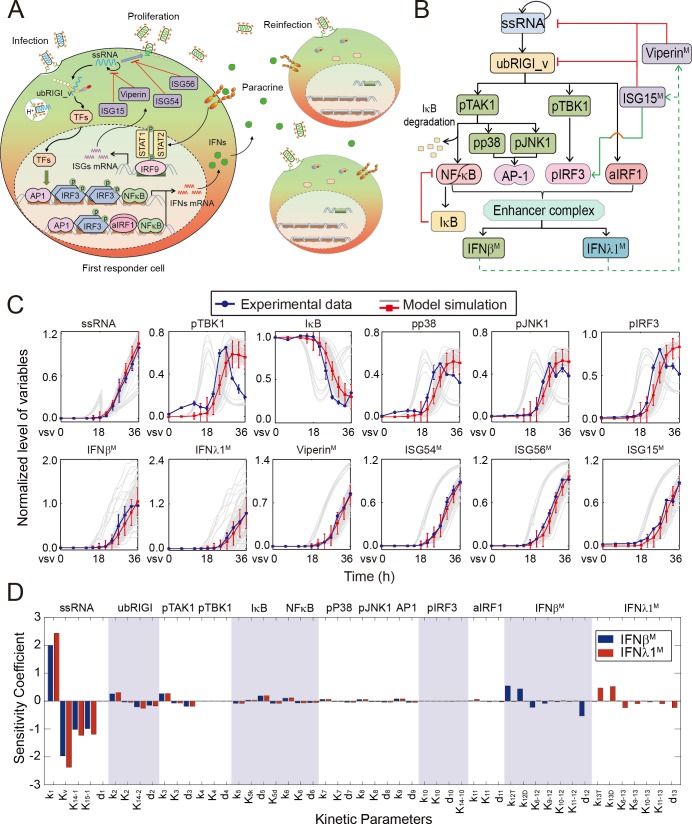
The interferons (IFNs) responses to viral infection are heterogeneous, while the underlying mechanisms for variability among cells are still not clear. In this study, we developed a hybrid model to systematically identify the sources of IFN induction heterogeneity. The experiment-integrated simulation demonstrated that the viral dose/type, the diversity in transcriptional factors activation and the intercellular paracrine signaling could strikingly shape the heterogeneity of IFN expression. We further determined that the IFNβ and IFNλ1 induced diverse dynamics of IFN-stimulated genes (ISGs) production. Collectively, our findings revealed the intracellular and intercellular mechanisms contributing to cell-to-cell variation in IFN induction, and further demonstrated the significant effects of IFN heterogeneity on antagonizing viruses.
Conflict of interest statement
Figures


Similar articles
-
Post-transcriptional regulation of antiviral gene expression by N6-methyladenosine.Cell Rep. 2021 Mar 2;34(9):108798. doi: 10.1016/j.celrep.2021.108798. Cell Rep. 2021. PMID: 33657363 Free PMC article.
-
Extracellular UDP and P2Y6 function as a danger signal to protect mice from vesicular stomatitis virus infection through an increase in IFN-β production.J Immunol. 2014 Nov 1;193(9):4515-26. doi: 10.4049/jimmunol.1301930. Epub 2014 Sep 26. J Immunol. 2014. PMID: 25261483
-
Noise propagation through extracellular signaling leads to fluctuations in gene expression.BMC Syst Biol. 2013 Sep 25;7:94. doi: 10.1186/1752-0509-7-94. BMC Syst Biol. 2013. PMID: 24067165 Free PMC article.
-
Expression of interferon and interferon-induced genes in salmonids in response to virus infection, interferon-inducing compounds and vaccination.Fish Shellfish Immunol. 2008 Oct;25(4):351-7. doi: 10.1016/j.fsi.2008.02.004. Epub 2008 Feb 10. Fish Shellfish Immunol. 2008. PMID: 18400516 Review.
-
[Molecular genetic aspects of interferon induction and antiviral action].Vestn Ross Akad Med Nauk. 1998;(3):18-24. Vestn Ross Akad Med Nauk. 1998. PMID: 9608271 Review. Russian.
Cited by
-
A Review of Using Mathematical Modeling to Improve Our Understanding of Bacteriophage, Bacteria, and Eukaryotic Interactions.Front Microbiol. 2021 Sep 21;12:724767. doi: 10.3389/fmicb.2021.724767. eCollection 2021. Front Microbiol. 2021. PMID: 34621252 Free PMC article. Review.
-
A mathematic model to reveal delicate cross-regulation between MAVS/STING, inflammasome and MyD88-dependent type I interferon signalling.J Cell Mol Med. 2020 Oct;24(19):11535-11545. doi: 10.1111/jcmm.15768. Epub 2020 Sep 3. J Cell Mol Med. 2020. PMID: 32885594 Free PMC article.
-
Investigating Functional Roles for Positive Feedback and Cellular Heterogeneity in the Type I Interferon Response to Viral Infection.Viruses. 2018 Sep 21;10(10):517. doi: 10.3390/v10100517. Viruses. 2018. PMID: 30241427 Free PMC article.
-
Dual nature of type I interferon responses and feedback regulations by SOCS1 dictate malaria mortality.J Adv Res. 2025 Jul;73:295-310. doi: 10.1016/j.jare.2024.08.027. Epub 2024 Aug 22. J Adv Res. 2025. PMID: 39181199 Free PMC article.
References
-
- Pestka S, Krause CD, Walter MR. Interferons, interferon-like cytokines, and their receptors. Immunological reviews. 2004; 202: 8–32. doi: 10.1111/j.0105-2896.2004.00204.x - DOI - PubMed
-
- Bolen CR, Ding S, Robek MD, Kleinstein SH. Dynamic expression profiling of type I and type III interferon-stimulated hepatocytes reveals a stable hierarchy of gene expression. Hepatology. 2014; 59: 1262–1272. doi: 10.1002/hep.26657 - DOI - PMC - PubMed
-
- Schneider WM, Chevillotte MD, Rice CM. Interferon-stimulated genes: a complex web of host defenses. Annual review of immunology. 2014; 32: 513–545. doi: 10.1146/annurev-immunol-032713-120231 - DOI - PMC - PubMed
-
- Kawai T, Akira S. Innate immune recognition of viral infection. Nature immunology. 2006; 7: 131–137. doi: 10.1038/ni1303 - DOI - PubMed
-
- Loo YM, Gale M Jr. Immune signaling by RIG-I-like receptors. Immunity. 2011; 34: 680–692. doi: 10.1016/j.immuni.2011.05.003 - DOI - PMC - PubMed
MeSH terms
Substances
LinkOut - more resources
Full Text Sources
Other Literature Sources
