

Understanding Causal Distributional and Subgroup Effects With the Instrumental Propensity Score
- PMID: 29020138
- PMCID: PMC5976917
- DOI: 10.1093/aje/kwx282
Understanding Causal Distributional and Subgroup Effects With the Instrumental Propensity Score
Abstract
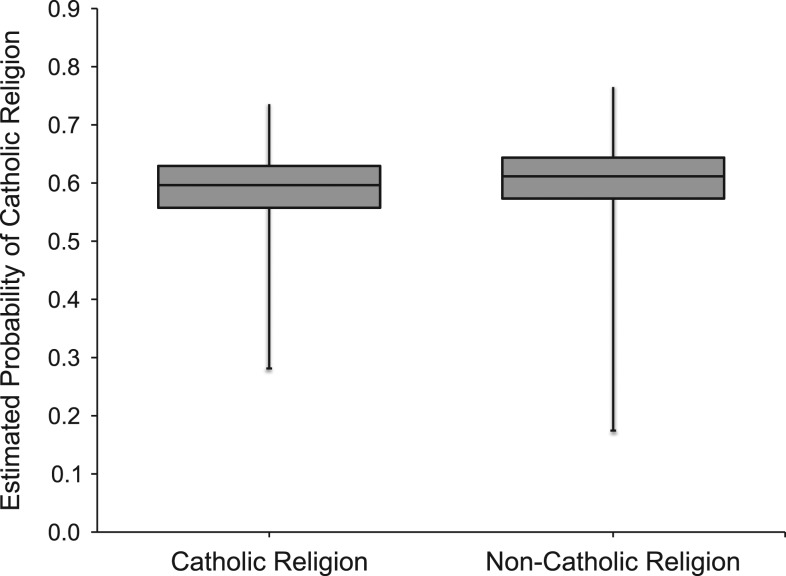
To address issues with measured and unmeasured confounding in observational studies, we developed a unified approach to using an instrumental variable in more flexible ways to evaluate treatment effects. The approach is based on an instrumental propensity score conditional on baseline variables, which can then be incorporated in matching, regression, subclassification, or weighting along with various parametric, semiparametric, or nonparametric methods for the assessment of treatment effects. Therefore, the application of the instrumental propensity score allows different methods for outcome effect evaluations in addition to standard 2-stage least square models while controlling for unmeasured confounders. Several properties of the instrumental propensity score are discussed. The approach is then illustrated using subclassification along with a semiparametric density ratio model and empirical likelihood. This method allows us to evaluate distributional and subgroup treatment effects in addition to the overall average treatment effect. Simulation studies showed that the method works well. We applied our method to a study of the effects of attending a Catholic school versus a public school and found that attending a Catholic school had significant beneficial effects on subsequent wages among a subgroup of subjects.
Figures
References
-
- Rosenbaum PR, Rubin DB. The central role of the propensity score in observational studies for causal effects. Biometrika. 1983;70(1):41–55.
-
- D’Agostino RB., Jr Propensity score methods for bias reduction in the comparison of a treatment to a non-randomized control group. Stat Med. 1998;17(19):2265–2281. - PubMed
-
- Angrist JD, Imbens GW, Rubin DB. Identification of causal effects using instrumental variables. J Am Stat Assoc. 1996;91(434):444–455.
-
- Abadie A. Bootstrap tests for distributional treatment effects in instrumental variable models. J Am Stat Assoc. 2002;97(457):284–292.
Publication types
MeSH terms
Grants and funding
LinkOut - more resources
Full Text Sources
Other Literature Sources
