

Best Practices for Gauging Evidence of Causality in Air Pollution Epidemiology
- PMID: 29020141
- PMCID: PMC5860368
- DOI: 10.1093/aje/kwx307
Best Practices for Gauging Evidence of Causality in Air Pollution Epidemiology
Abstract
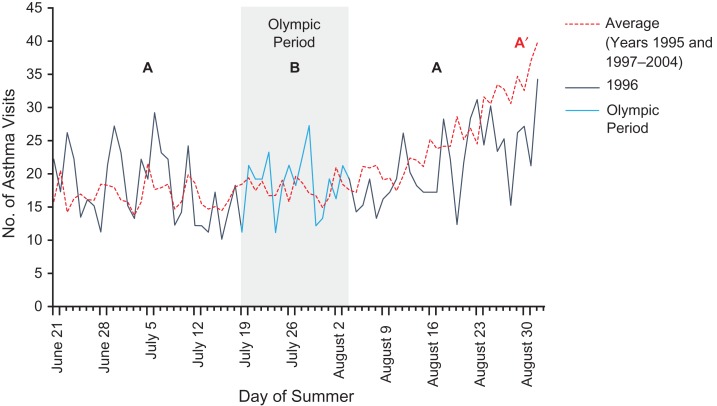
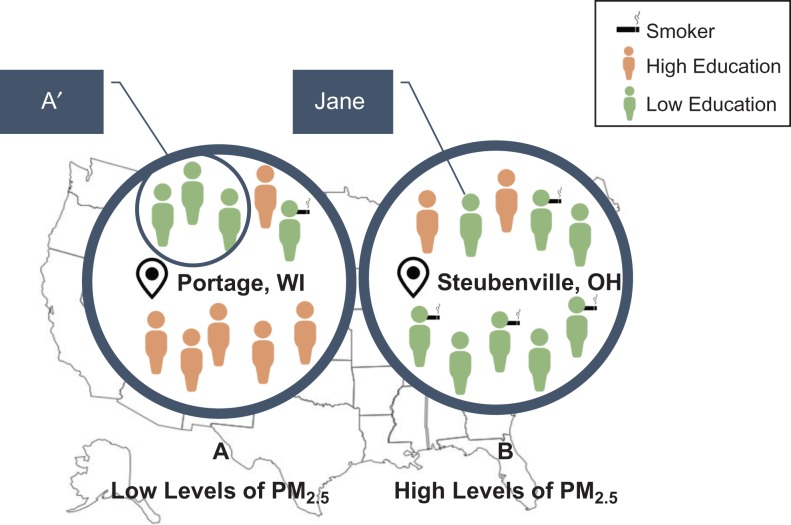
The contentious political climate surrounding air pollution regulations has brought some researchers and policy-makers to argue that evidence of causality is necessary before implementing more stringent regulations. Recently, investigators in an increasing number of air pollution studies have purported to have used "causal analysis," generating the impression that studies not explicitly labeled as such are merely "associational" and therefore less rigorous. Using 3 prominent air pollution studies as examples, we review good practices for how to critically evaluate the extent to which an air pollution study provides evidence of causality. We argue that evidence of causality should be gauged by a critical evaluation of design decisions such as 1) what actions or exposure levels are being compared, 2) whether an adequate comparison group was constructed, and 3) how closely these design decisions approximate an idealized randomized study. We argue that air pollution studies that are more scientifically rigorous in terms of the decisions made to approximate a randomized experiment are more likely to provide evidence of causality and should be prioritized among the body of evidence for regulatory review accordingly. Our considerations, although presented in the context of air pollution epidemiology, can be broadly applied to other fields of epidemiology.
Keywords: air pollution; causal inference; causality; design decisions; study design.
© The Author(s) 2017. Published by Oxford University Press on behalf of the Johns Hopkins Bloomberg School of Public Health. All rights reserved. For permissions, please e-mail: journals.permissions@oup.com.
Figures
Comment in
-
RE: "BEST PRACTICES FOR GAUGING EVIDENCE OF CAUSALITY IN AIR POLLUTION EPIDEMIOLOGY".Am J Epidemiol. 2018 Jun 1;187(6):1338-1339. doi: 10.1093/aje/kwy034. Am J Epidemiol. 2018. PMID: 29584873 No abstract available.
References
-
- Greenbaum DS, Bachmann JD, Krewski D, et al. Particulate air pollution standards and morbidity and mortality: case study. Am J Epidemiol. 2001;154(12 suppl):S78–S90. - PubMed
-
- Environmental Protection Agency Integrated Science Assessment (ISA) for Particulate Matter (Final Report, Dec 2009) Washington, DC: Environmental Protection Agency; 2009. (Publication no. EPA/600/R-08/139F).
-
- HEI Accountability Working Group Assessing Health Impact of Air Quality Regulations: Concepts and Methods for Accountability Research (Communication 11). Boston, MA: Health Effects Institute; 2003.
-
- National Research Council Air Quality Management in the United States. Washington, DC: The National Academies Press; 2004.
MeSH terms
Substances
Grants and funding
LinkOut - more resources
Full Text Sources
Other Literature Sources
Medical
