. 2017 Oct 10;21(2):316-323.
doi: 10.1016/j.celrep.2017.09.050.

Remarkable Stability of Myelinating Oligodendrocytes in Mice

Affiliations

Remarkable Stability of Myelinating Oligodendrocytes in Mice

Richa B Tripathi et al. Cell Rep. .

Abstract

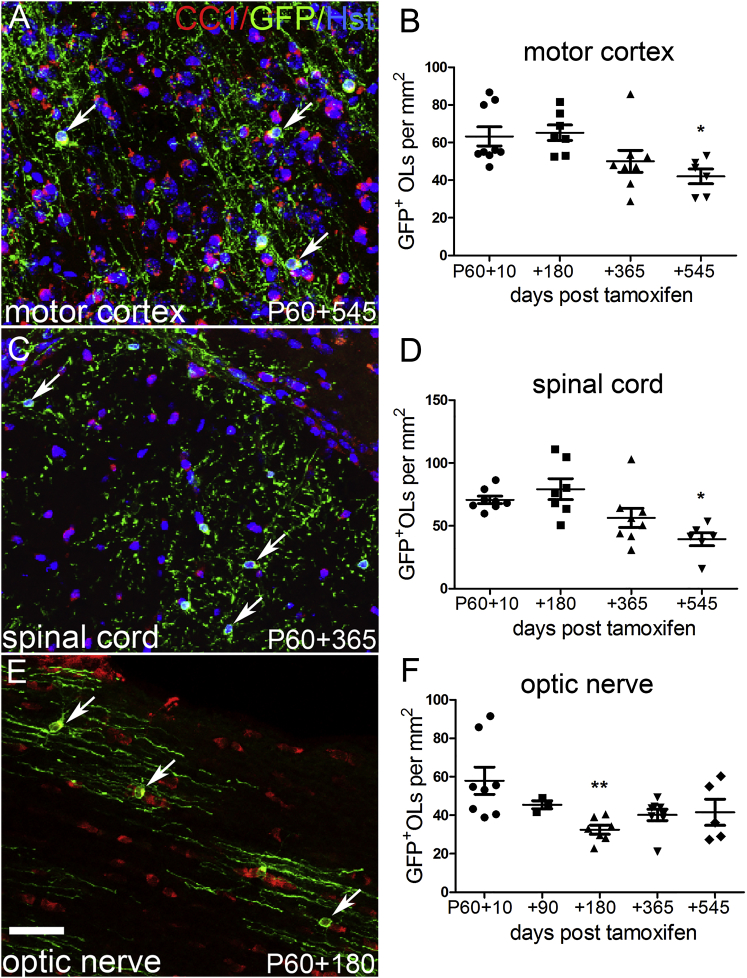
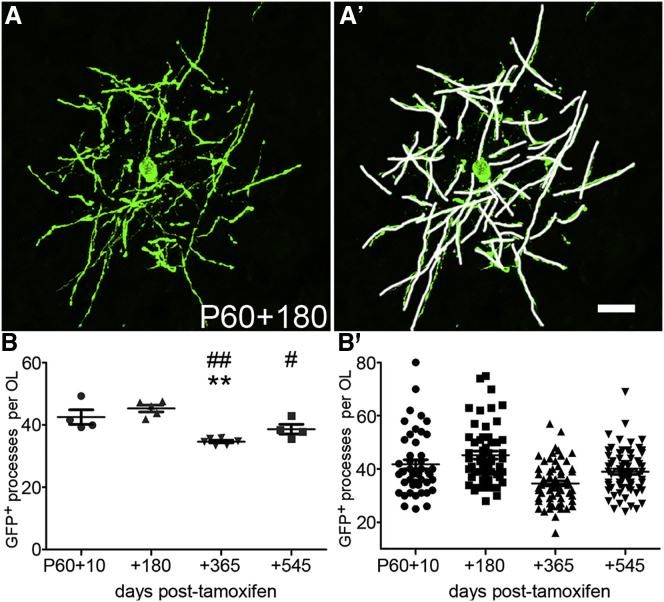
New myelin-forming oligodendrocytes (OLs) are generated in the mouse central nervous system during adulthood. These adult-born OLs might augment the existing population, contributing to neural plasticity, or else replace OLs that die in use (turnover). To distinguish between these alternatives, we induced genetic labeling of mature myelinating OLs in young adult mice and tracked their subsequent survival. OL survival rates were region dependent, being higher in corpus callosum (∼90% survival over 20 months) and motor cortex (∼70% survival) than in corticospinal tract or optic nerve (50%-60% survival). Survival rates over the first 8 months were 90%-100% in all regions except the optic nerve. In the corpus callosum, new OLs accumulate during young adulthood and are therefore likely to participate in adaptive myelination. We also found that the number of myelin internodes maintained by individual cortical OLs is stable for at least 8 months but declines ∼12% in the following year.

Keywords: Opalin-CreER; cell survival; cell turnover; cerebral cortex; corpus callosum; internode; myelin; optic nerve; spinal cord; transgenic mouse.


Figures

None
Graphical abstract
Figure 1
Figure 1
Extreme Longevity of OLs in the Corpus Callosum (A) Experimental protocol. Tamoxifen was administered to Opalin–iCreERT2: Tau–mGFP or Opalin–iCreERT2: Rosa–YFP mice starting on P60 (Experimental Procedures). Mice were killed and examined at various times post-tamoxifen as indicated. (B) Schematic of the brain showing the part of the corpus callosum (in red) within the medial limits of the lateral ventricles that was investigated in this study. (C and D) mGFP+, CC1+ OLs in Opalin-CreERT2: Tau-mGFP mice that received 55 mg/kg tamoxifen, imaged at P60+30 (C) and P60+365 (D). (E) The normalized density of mGFP+ OLs did not change detectably over this time frame. (F–H) mGFP+, CC1+ OLs in a mouse that received 120 mg/kg tamoxifen, imaged at P60+365. The mGFP (G) and CC1 (H) channels are merged with DAPI labelling in (F). (I) The normalized density of mGFP+ OLs did not change appreciably between P60+10 and P60+545. (J) Similar data were obtained using Opalin-CreERT2: Rosa-YFP mice. The normalization procedure is described in Experimental Procedures. Arrows indicate cell bodies of mGFP+, CC1+ double-positive OLs. Error bars represent SEM. Scale bar, 20 μm. See also Figures S1 and S2.
Figure 2
Figure 2
OL Survival in the Motor Cortex, Spinal Cord, and Optic Nerve Opalin-iCreERT2: Tau-mGFP mice received 120 mg/kg tamoxifen at P60 and were analyzed up to 18 months (545 days) later. (A, C, and E) mGFP+, CC1+ OLs in Opalin-CreERT2: Tau-mGFP motor cortex (A), corticospinal tract (C) or optic nerve (E), imaged at the indicated times post-tamoxifen. (B) In motor cortex, the normalized density of mGFP+ OLs did not change between P60+10 and P60+180 but decreased ∼30% in the following 6 months to one year (P60+545; 1-way ANOVA, p = 0.036). (D) In the corticospinal tract, the density of mGFP+ OLs did not change between P60+10 and P60+180, but declined during the following year (1-way ANOVA, p < 0.01). (F) In optic nerve, the density of mGFP+ OLs declined ∼40% between P60+10 and P60+180 (t-test, p < 0.01), after which OL density appeared to stabilize (1-way ANOVA over the whole time course, p = 0.014). Asterisks indicate values significantly different from P60+10 (p < 0.05, ∗∗p < 0.01, and ∗∗∗p < 0.001). Error bars represent SEM. Scale bar, 40 μm. See also Figures S1, S2.
Figure 3
Figure 3
Total Number of Myelinating OLs as a Function of Age CC1+ mature OL cell bodies were counted in Opalin–iCreERT2: Tau–mGFP mice or wild-type mice of the same ages. (A–D) Micrographs of CC1+ OLs, counterstained with DAPI, in corpus callosum (A and B), corticospinal tract (C) and optic nerve (D), at the indicated times post-tamoxifen. (E) In the corpus callosum, the normalized density of CC1+ OLs increased between P60+10 and P60+180 and then remained approximately constant until at least P60+545 (1-way ANOVA, p < 0.0001). (F) In the spinal cord, there was a gradual decrease in the density of CC1+ OLs after P60+180 (1-way ANOVA, p < 0.0001) in parallel with the loss of GFP+ OLs (Figure 2D). (G) In the optic nerve, the density of CC1+ OLs decreased between P60+10 and P60+90 (1-way ANOVA, p < 0.0001) but stabilized after that, apart from a transient increase around P60+365. Asterisks indicate values significantly different from P60+10 (p < 0.05, ∗∗p < 0.01, and ∗∗∗p < 0.001). Error bars represent mean ± SEM. CC, corpus callosum; ON, optic nerve; SC, spinal cord. Scale bar, 10 μm.
Figure 4
Figure 4
Stability of Internode Number with Age (A and A′) Individual OLs were imaged in the motor cortex of Opalin–iCreERT2: Tau–mGFP animals, and the primary cell processes/myelin internodes were marked and counted (white lines in A′). Scale bar, 20 μm. (B) There was a small but significant decrease in the number of internodes over the course of the study (1-way ANOVA, p < 0.0001). Each data point in (B) is the average from all OLs analyzed in a given mouse. Asterisks indicate values significantly different from P60+10 (∗∗p < 0.01), and number signs indicate values significantly different from P60+180 (#p < 0.05 and ##p < 0.01). (B′) The number of processes/internodes plotted separately for each individual OL (47 OLs at P60+10, 56 OLs at P60+180, and 66 OLs both at P60+365 and P60+545; n ≥ 4 mice at each age). Error bars represent mean ± SEM.

References

    1. Czopka T., Ffrench-Constant C., Lyons D.A. Individual oligodendrocytes have only a few hours in which to generate new myelin sheaths in vivo. Dev. Cell. 2013;25:599–609. - PMC - PubMed
    1. Dangata Y.Y., Kaufman M.H. Myelinogenesis in the optic nerve of (C57BL x CBA) F1 hybrid mice: a morphometric analysis. Eur. J. Morphol. 1997;35:3–17. - PubMed
    1. Dangata Y.Y., Findlater G.S., Kaufman M.H. Postnatal development of the optic nerve in (C57BL x CBA)F1 hybrid mice: general changes in morphometric parameters. J. Anat. 1996;189:117–125. - PMC - PubMed
    1. Danias J., Lee K.C., Zamora M.F., Chen B., Shen F., Filippopoulos T., Su Y., Goldblum D., Podos S.M., Mittag T. Quantitative analysis of retinal ganglion cell (RGC) loss in aging DBA/2NNia glaucomatous mice: comparison with RGC loss in aging C57/BL6 mice. Invest. Ophthalmol. Vis. Sci. 2003;44:5151–5162. - PubMed
    1. Dimou L., Simon C., Kirchhoff F., Takebayashi H., Götz M. Progeny of Olig2-expressing progenitors in the gray and white matter of the adult mouse cerebral cortex. J. Neurosci. 2008;28:10434–10442. - PMC - PubMed

LinkOut - more resources