

The sponge microbiome project
- PMID: 29020741
- PMCID: PMC5632291
- DOI: 10.1093/gigascience/gix077
The sponge microbiome project
Erratum in
-
Erratum to: The sponge microbiome project.Gigascience. 2018 Dec 1;7(12):giy145. doi: 10.1093/gigascience/giy145. Gigascience. 2018. PMID: 30521034 Free PMC article. No abstract available.
Abstract
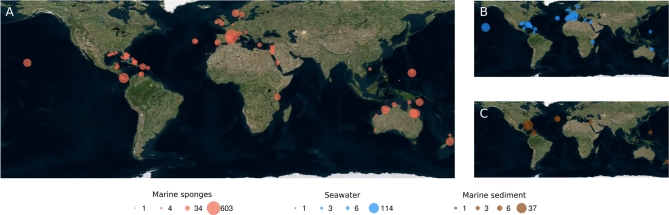
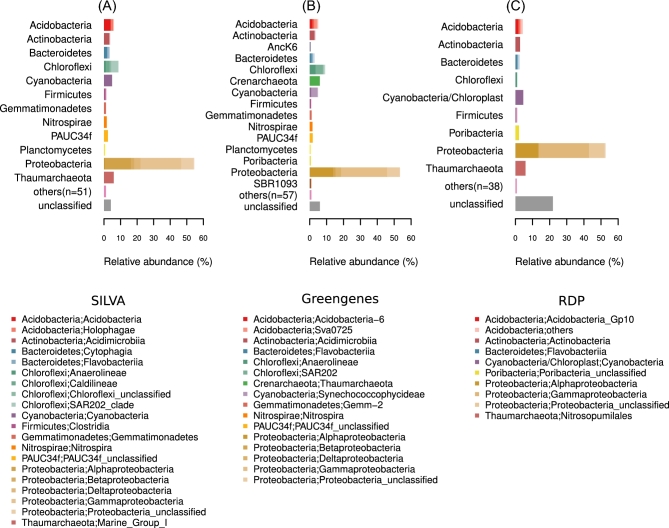
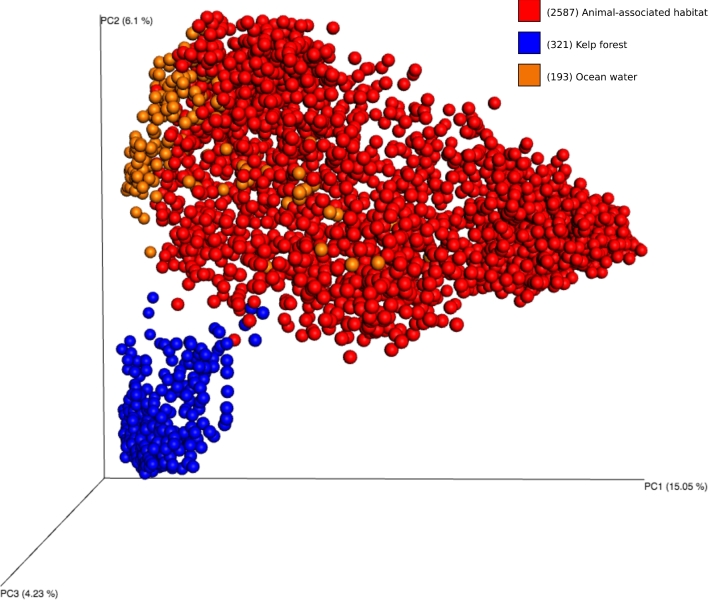
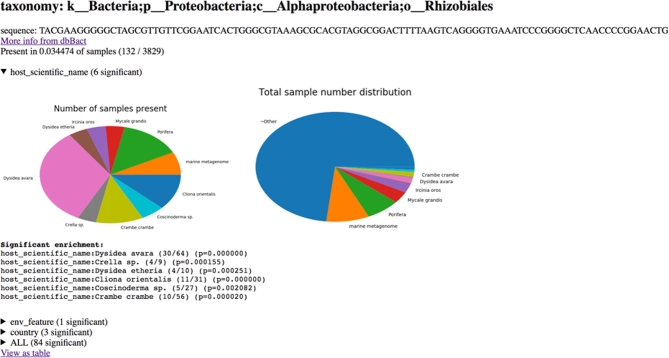
Marine sponges (phylum Porifera) are a diverse, phylogenetically deep-branching clade known for forming intimate partnerships with complex communities of microorganisms. To date, 16S rRNA gene sequencing studies have largely utilised different extraction and amplification methodologies to target the microbial communities of a limited number of sponge species, severely limiting comparative analyses of sponge microbial diversity and structure. Here, we provide an extensive and standardised dataset that will facilitate sponge microbiome comparisons across large spatial, temporal, and environmental scales. Samples from marine sponges (n = 3569 specimens), seawater (n = 370), marine sediments (n = 65) and other environments (n = 29) were collected from different locations across the globe. This dataset incorporates at least 268 different sponge species, including several yet unidentified taxa. The V4 region of the 16S rRNA gene was amplified and sequenced from extracted DNA using standardised procedures. Raw sequences (total of 1.1 billion sequences) were processed and clustered with (i) a standard protocol using QIIME closed-reference picking resulting in 39 543 operational taxonomic units (OTU) at 97% sequence identity, (ii) a de novo clustering using Mothur resulting in 518 246 OTUs, and (iii) a new high-resolution Deblur protocol resulting in 83 908 unique bacterial sequences. Abundance tables, representative sequences, taxonomic classifications, and metadata are provided. This dataset represents a comprehensive resource of sponge-associated microbial communities based on 16S rRNA gene sequences that can be used to address overarching hypotheses regarding host-associated prokaryotes, including host specificity, convergent evolution, environmental drivers of microbiome structure, and the sponge-associated rare biosphere.
Keywords: 16S rRNA gene; archaea; bacteria; marine sponges; microbial diversity; microbiome; symbiosis.
© The Authors 2017. Published by Oxford University Press.
Figures
References
-
- Li CW, Chen JY, Hua TE. Precambrian sponges with cellular structures. Science 1998;279(5352):879–82. - PubMed
-
- Bell JJ. The functional roles of marine sponges. Estuar Coast Shelf Sci 2008;79(3):341–53.
-
- De Goeij JM, Van Oevelen D, Vermeij MJA et al. Surviving in a marine desert: the sponge loop retains resources within coral reefs. Science 2013;342(6154):108–10. - PubMed
Publication types
MeSH terms
Substances
LinkOut - more resources
Full Text Sources
Other Literature Sources
