

Social disparities in the prevalence of diabetes in Australia and in the development of end stage renal disease due to diabetes for Aboriginal and Torres Strait Islanders in Australia and Maori and Pacific Islanders in New Zealand
- PMID: 29020957
- PMCID: PMC5637272
- DOI: 10.1186/s12889-017-4807-5
Social disparities in the prevalence of diabetes in Australia and in the development of end stage renal disease due to diabetes for Aboriginal and Torres Strait Islanders in Australia and Maori and Pacific Islanders in New Zealand
Abstract
Background: Disparities in health status occur between people with differing socioeconomic status and disadvantaged groups usually have the highest risk exposure and the worst health outcome. We sought to examine the social disparities in the population prevalence of diabetes and in the development of treated end stage renal disease due to type 1 diabetes which has not previously been studied in Australia and New Zealand in isolation from type 2 diabetes.
Methods: This observational study examined the population prevalence of diabetes in a sample of the Australian population (7,434,492) using data from the National Diabetes Services Scheme and of treated end stage renal disease due to diabetes using data from the Australian and New Zealand Dialysis and Transplant Registry. The data were then correlated with the Australian Bureau of Statistics Socioeconomic Indexes for Areas for an examination of socioeconomic disparities.
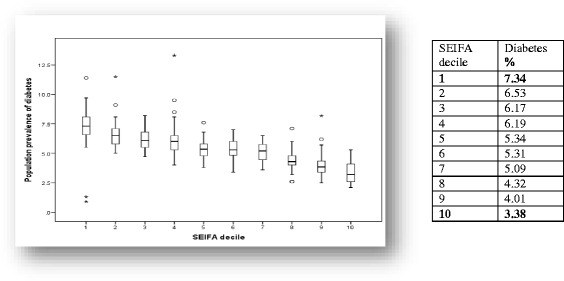
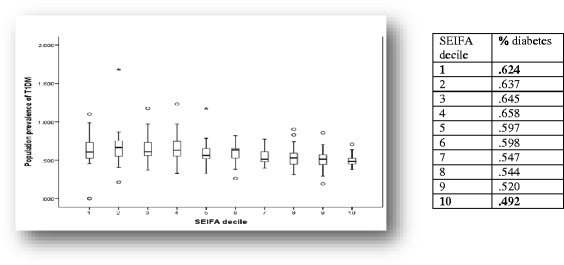
Results: There is a social gradient in the prevalence of diabetes in Australia with disease incidence decreasing incrementally with increasing affluence (Spearman's rho = .765 p < 0.001). There is a higher risk of developing end stage renal disease due to type 1 diabetes for males with low socioeconomic status (RR 1.20; CI 1.002-1.459) in comparison to females with low socioeconomic status. In Australia and New Zealand Aboriginal and Torres Strait Islanders, Maori and Pacific Islanders appear to have a low risk of end stage renal disease due to type 1 diabetes but continue to carry a vastly disproportionate burden of end stage renal disease due to type 2 diabetes (RR 6.57 CI 6.04-7.14 & 6.48 CI 6.02-6.97 respectively p < 0.001) in comparison to other Australian and New Zealanders.
Conclusion: Whilst low socioeconomic status is associated with a higher prevalence of diabetes the inverse social gradient seen in this study has not previously been reported. The social disparity seen in relation to treated end stage renal disease due to type 2 diabetes for Aboriginal and Torres Strait Islanders, Maori and Pacific Islanders has changed very little in the past 20 years. Addressing the increasing incidence of diabetes in Australia requires consideration of the underlying social determinants of health.
Keywords: Aboriginal and Torres Strait islanders; Australia; Diabetes; New Zealand; Renal disease; Socioeconomic status.
Conflict of interest statement
Ethics approval and consent to participate
Ethical approval to conduct this study was obtained from the Southern Adelaide Clinical Human Research Ethics Committee (SACHREC), reference number 564.13.
Consent for publication
Not applicable.
Competing interests
The authors declare that they have no competing interests.
Publisher’s Note
Springer Nature remains neutral with regard to jurisdictional claims in published maps and institutional affiliations.
Figures
Similar articles
-
Increases in renal replacement therapy in Australia and New Zealand: understanding trends in diabetic nephropathy.Nephrology (Carlton). 2012 Jan;17(1):76-84. doi: 10.1111/j.1440-1797.2011.01512.x. Nephrology (Carlton). 2012. PMID: 21854505
-
Closing the gap in kidney disease: validating the reporting of Aboriginal and/or Torres Strait Islander identification in a clinical quality registry using linked data.Med J Aust. 2025 Mar 17;222(5):240-248. doi: 10.5694/mja2.52613. Med J Aust. 2025. PMID: 40089918 Free PMC article.
-
The survival benefit of deceased donor kidney transplantation for Aboriginal and Torres Strait Islander people, 2006-20: a retrospective national cohort study.Med J Aust. 2024 Jul 15;221(2):111-116. doi: 10.5694/mja2.52361. Epub 2024 Jun 19. Med J Aust. 2024. PMID: 38894650
-
The burden of kidney disease in indigenous children of Australia and New Zealand, epidemiology, antecedent factors and progression to chronic kidney disease.J Paediatr Child Health. 2010 Sep;46(9):504-9. doi: 10.1111/j.1440-1754.2010.01851.x. J Paediatr Child Health. 2010. PMID: 20854321 Review.
-
Māori, Pacific, Aboriginal and Torres Strait Islander Women's Cardiovascular Health: Where Are the Opportunities to Make a Real Difference?Heart Lung Circ. 2021 Jan;30(1):52-58. doi: 10.1016/j.hlc.2020.06.029. Epub 2020 Nov 6. Heart Lung Circ. 2021. PMID: 33162366 Review.
Cited by
-
Psychological distress in Aotearoa New Zealand adults with type 1 diabetes.J Health Psychol. 2025 Apr;30(5):898-908. doi: 10.1177/13591053241289189. Epub 2024 Oct 28. J Health Psychol. 2025. PMID: 39465988 Free PMC article.
-
Effects of lifestyle interventions on weight amongst Pasifika communities: A systematic review and meta-analysis.Lancet Reg Health West Pac. 2022 May 31;25:100483. doi: 10.1016/j.lanwpc.2022.100483. eCollection 2022 Aug. Lancet Reg Health West Pac. 2022. PMID: 35669931 Free PMC article.
-
Built Environments and Cardiometabolic Morbidity and Mortality in Remote Indigenous Communities in the Northern Territory, Australia.Int J Environ Res Public Health. 2020 Jan 25;17(3):769. doi: 10.3390/ijerph17030769. Int J Environ Res Public Health. 2020. PMID: 31991842 Free PMC article.
-
Vitamin C Status in People with Types 1 and 2 Diabetes Mellitus and Varying Degrees of Renal Dysfunction: Relationship to Body Weight.Antioxidants (Basel). 2022 Jan 27;11(2):245. doi: 10.3390/antiox11020245. Antioxidants (Basel). 2022. PMID: 35204128 Free PMC article.
-
Sociodemographic determinants of chronic kidney disease in Indigenous children.Pediatr Nephrol. 2022 Mar;37(3):547-553. doi: 10.1007/s00467-021-05110-y. Epub 2021 May 25. Pediatr Nephrol. 2022. PMID: 34032921 Review.
References
-
- Diabetes Australia. 2014. https://www.diabetesaustralia.com.au/.
-
- Diabetes UK. 2017. https://www.diabetes.org.uk/.
-
- International Diabetes Federation, 2015.
Publication types
MeSH terms
LinkOut - more resources
Full Text Sources
Other Literature Sources
Medical
Miscellaneous
