. 2017 Nov 15;77(22):6190-6201.
doi: 10.1158/0008-5472.CAN-17-1388. Epub 2017 Oct 11.

Histone Acetyltransferase KAT6A Upregulates PI3K/AKT Signaling through TRIM24 Binding

Affiliations

Histone Acetyltransferase KAT6A Upregulates PI3K/AKT Signaling through TRIM24 Binding

Deguan Lv et al. Cancer Res. .

Abstract

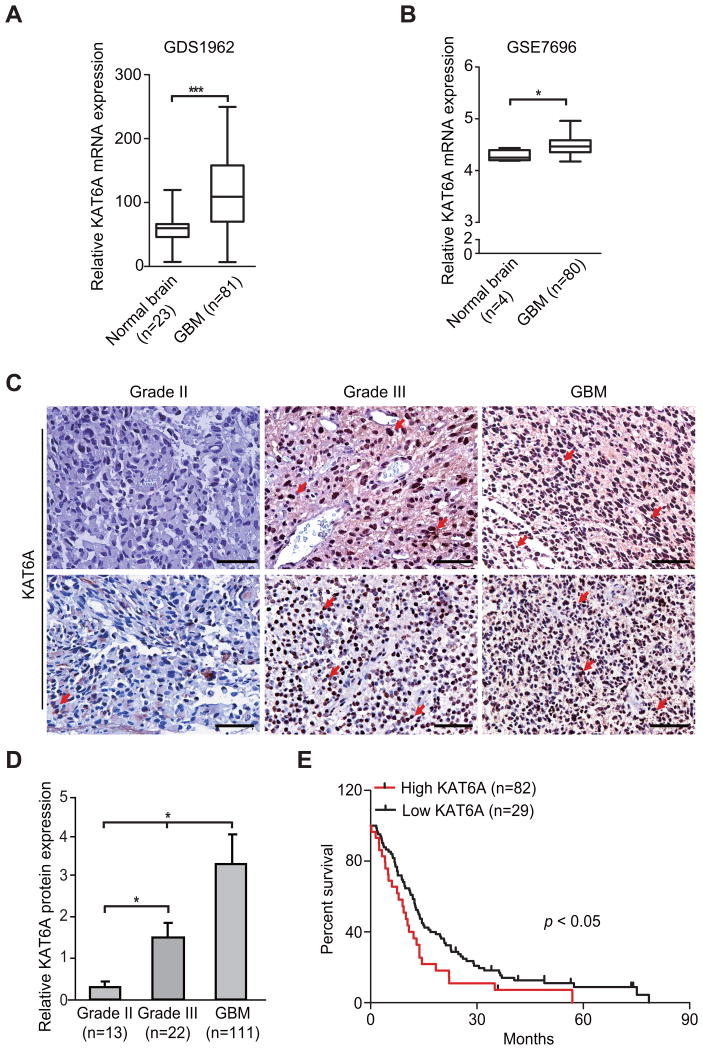
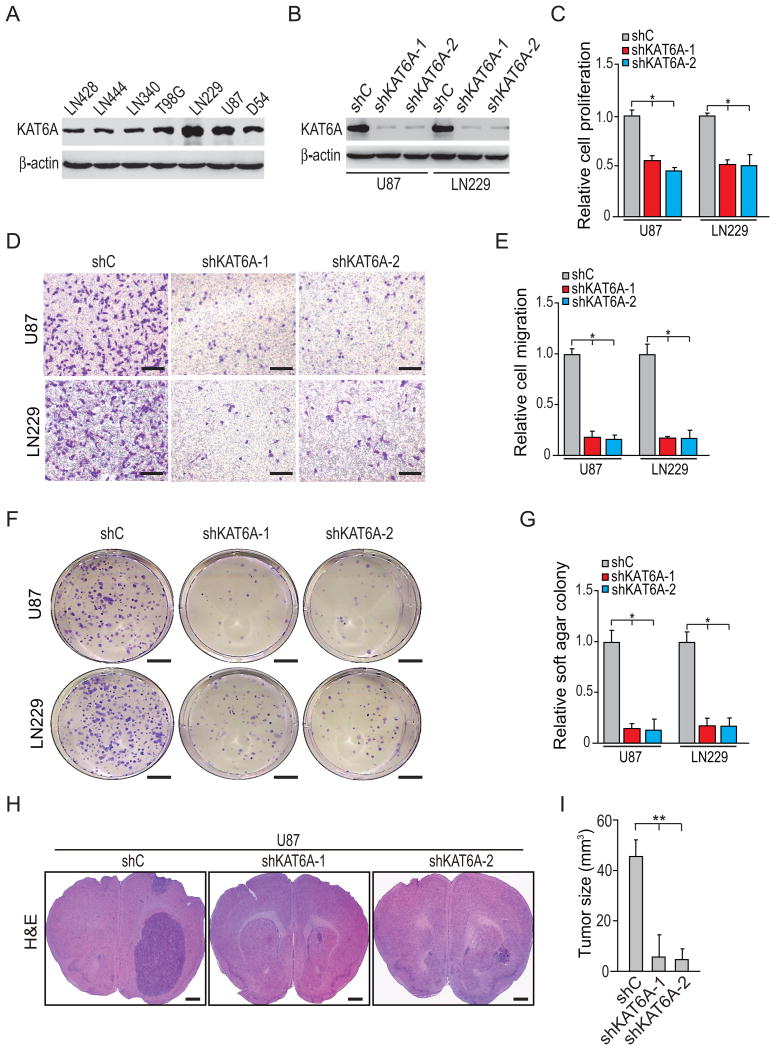
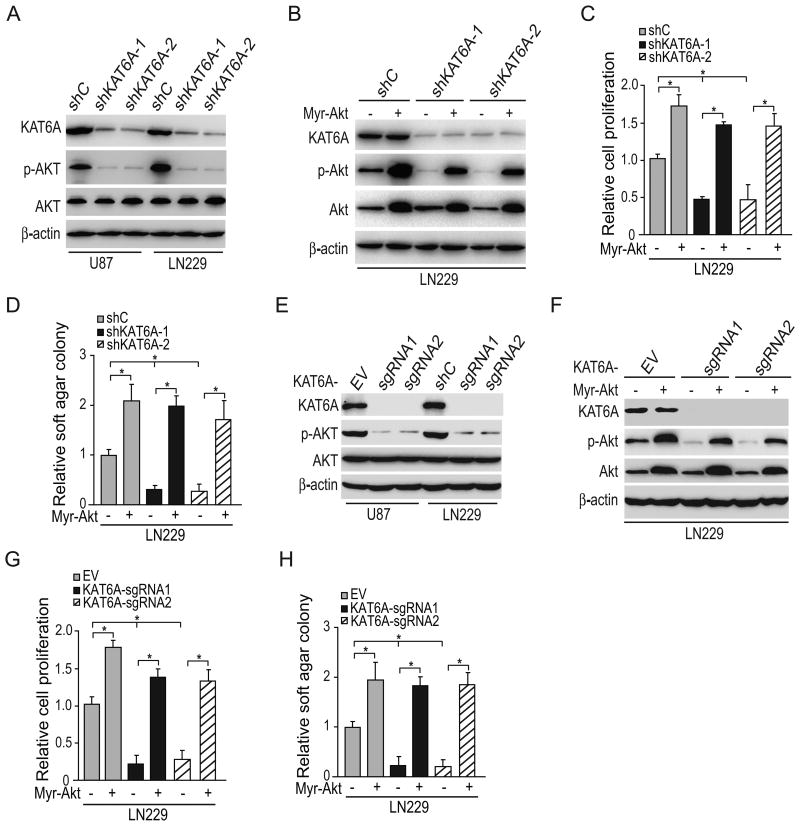
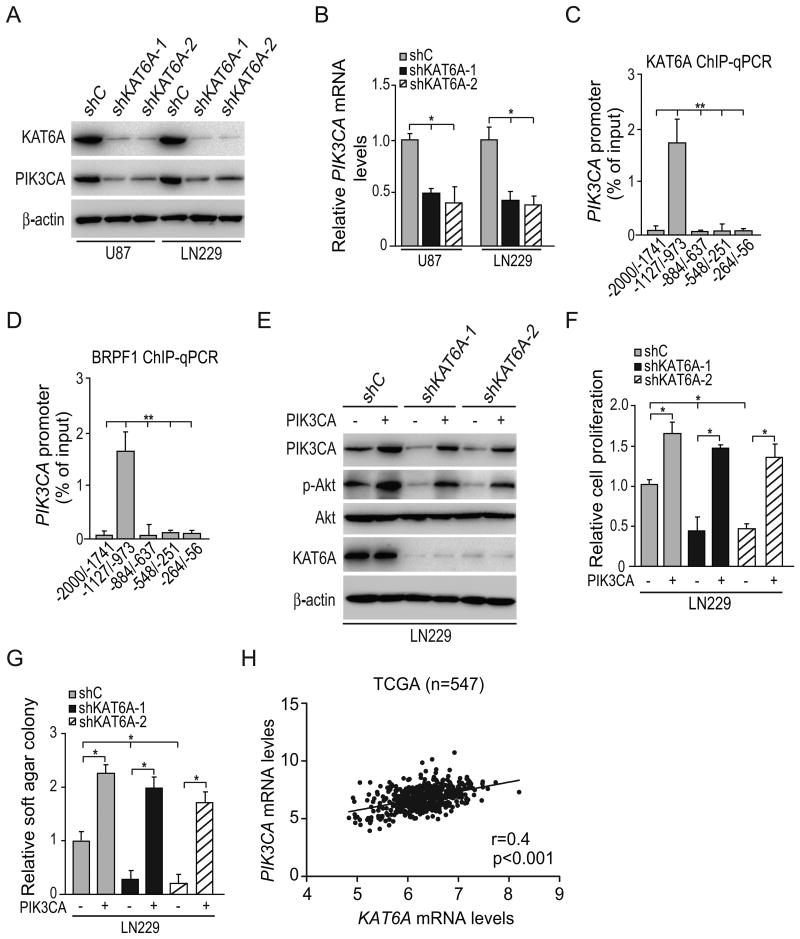
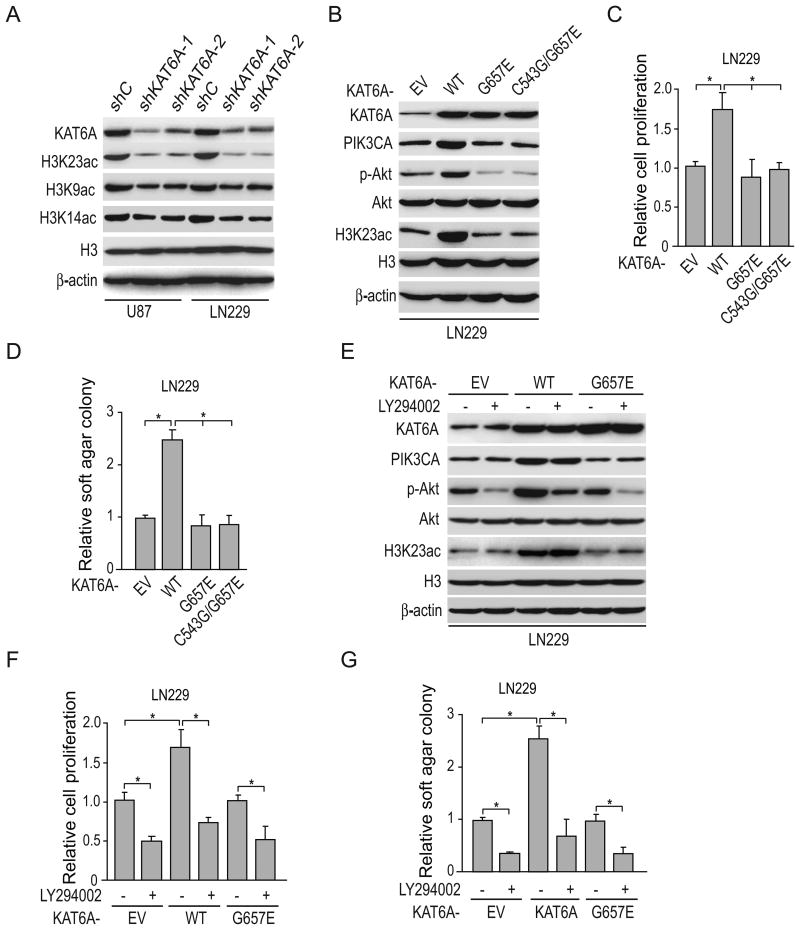
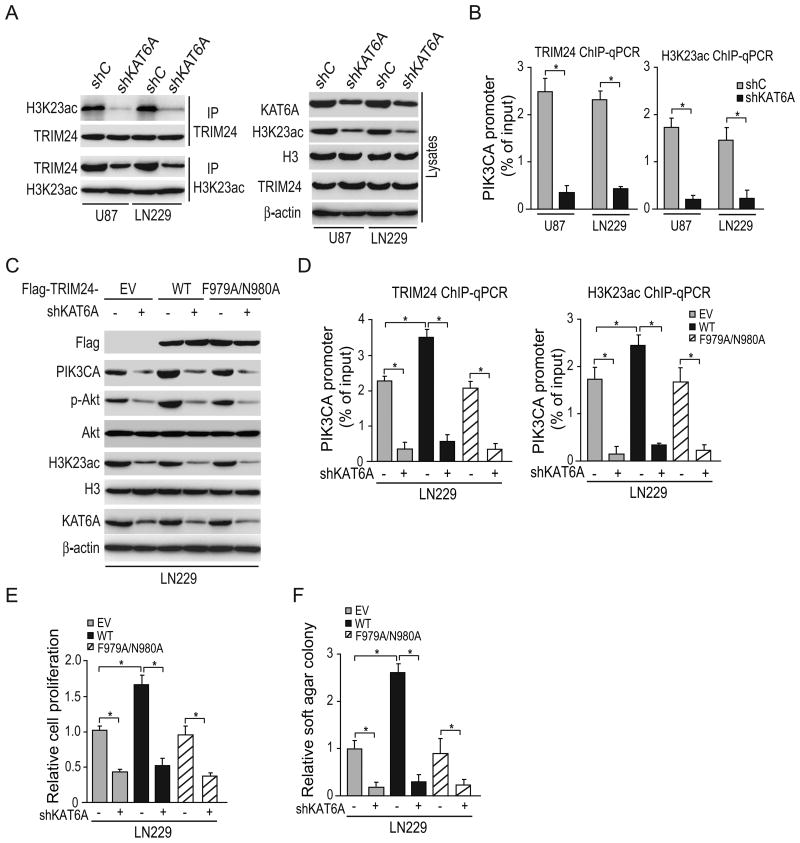
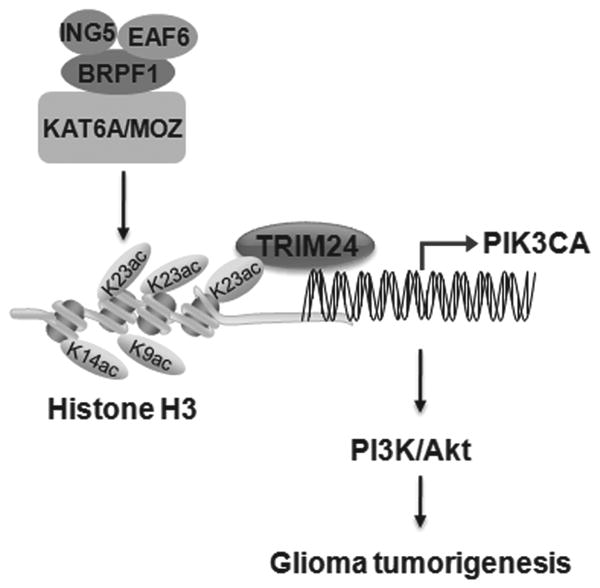
Lysine acetyltransferase KAT6A is a chromatin regulator that contributes to histone modification and cancer, but the basis of its actions are not well understood. Here, we identify a KAT6A signaling pathway that facilitates glioblastoma (GBM), where it is upregulated. KAT6A expression was associated with GBM patient survival. KAT6A silencing suppressed cell proliferation, cell migration, colony formation, and tumor development in an orthotopic mouse xenograft model system. Mechanistic investigations demonstrated that KAT6A acetylates lysine 23 of histone H3 (H3K23), which recruits the nuclear receptor binding protein TRIM24 to activate PIK3CA transcription, thereby enhancing PI3K/AKT signaling and tumorigenesis. Overexpressing activated AKT or PIK3CA rescued the growth inhibition due to KAT6A silencing. Conversely, the pan-PI3K inhibitor LY294002 abrogated the growth-promoting effect of KAT6A. Overexpression of KAT6A or TRIM24, but not KAT6A acetyltransferase activity-deficient mutants or TRIM24 mutants lacking H3K23ac-binding sites, promoted PIK3CA expression, AKT phosphorylation, and cell proliferation. Taken together, our results define an essential role of KAT6A in glioma formation, rationalizing its candidacy as a therapeutic target for GBM treatment. Cancer Res; 77(22); 6190-201. ©2017 AACR.


Conflict of interest statement

Conflict of interest: All authors declare no conflict of interest.

Figures

Figure 1
Figure 1. KAT6A expression is correlated with glioma progression
A and B, Expression levels of KAT6A mRNA are significantly higher in GBM samples compared with normal brain tissues. Expression data of KAT6A mRNA were downloaded from the GDS1962 dataset (24) and the GSE7696 dataset (25) and analyzed. C, IHC staining of KAT6A in clinical glioma specimens. Scale bars: 50 μm. Arrows, positive staining. Data are representative from two independent experiments with similar results. D, Quantitative analysis of KAT6A protein expression in C. E, Kaplan-Meier analysis of patients with high KAT6A protein-expressing GBM versus low KAT6A protein-expressing GBM. Statistical analysis was performed by log-rank test in a GraphPad Prism version 5.0 for Windows. Median survival (in months) for low KAT6A (13.53) and high KAT6A (9.97) protein expression. Black bars, censored data. Error bars ± SD. *, P <0.05. ***, P <0.05. Data are representative from two independent experiments with similar results.
Figure 2
Figure 2. Knockdown of KAT6A inhibits glioma cell proliferation, migration, colony formation in soft agar, and tumor growth
A, Western blotting (WB) analysis of KAT6A protein expression in GBM cells. β-actin was used as a control. B, WB analysis of KAT6A knockdown using two different shRNAs (shKAT6A-1 and shKAT6A-2) or a control shRNA (shC). C, Effects of KAT6A knockdown on GBM cell proliferation. D, Representative cell migration images using a Boyden chamber assay of U87 and LN229 GBM cells with shC, shKAT6A-1 or shKAT6A-2. Scale bars: 400 μm. E, Quantification of GBM cell migration in D. F, Representative soft agar colony formation images. Scale bars: 300 μm. G, Quantification of soft agar colonies in F. H, Representative hematoxylin and eosin (H&E) staining images of mouse brain sections with U87/shC, U87/shKAT6A-1 or U87/shKAT6A-2 tumors. Brains were harvested at 6-7 weeks after transplantation. Scale bars: 1 mm. Data were from two independent experiments with 5 mice per group with similar results. I, Quantification of tumor size in H. Data are representative from two independent experiments with similar results. Error bars±SD. *, P < 0.05. **, P < 0.01.
Figure 3
Figure 3. KAT6A depletion inhibits AKT activation
A, WB analysis of effects of KAT6A knockdown on AKT activation. B, Effects of overexpression of a constitutively activated (CA) Akt (Myr-AKT) mutant on KAT6A knockdown-inhibited Akt activation. C and D, Effects of overexpression of Myr-AKT on KAT6A knockdown-inhibited glioma cell proliferation (C) and soft agar colony formation (D). (E) WB analysis of effects of KAT6A knockout using two different sgRNAs on Akt phosphorylation. EV, empty vector. (F) Effects of overexpression of a CA AKT (Myr-AKT) mutant on KAT6A knockout-inhibited Akt activation. (G and H) Effects of overexpression of Myr-AKT on KAT6A depletion-inhibited glioma cell proliferation (G) and soft agar colony formation (H). Error bars±SD. *, P < 0.05. Data are representative from two independent experiments with similar results.
Figure 4
Figure 4. KAT6A upregulates PIK3CA expression in glioma cells to activate PI3K/AKT signal
A, Effects of KAT6A knockdown on PIK3CA protein expression in U87 and LN229 GBM cells. B, qRT-PCR analysis of effects of KAT6A knockdown on PIK3CA mRNA expression. C and D, ChIP-qPCR assays of the binding of KAT6A (C) and BRPF1 (D) with the PIK3CA promoter. After ChIP using antibodies against KAT6A, BRPF1, or control IgG, qPCR assays were performed using primers corresponding to five different loci of the PIK3CA promoter. E-G. Overexpression of PIK3CA rescues KAT6A knockdown-inhibited AKT activation (E), glioma cell proliferation (F), and soft agar colony formation (G). H, Correlation of expression between PIK3CA and KAT6A in 547 GBM samples from The Cancer Genome Atlas (TCGA) dataset. Data are representative from two independent experiments with similar results. Error bars±SD. *, P < 0.05. **, P < 0.01.
Figure 5
Figure 5. KAT6A acetyltransferase activity is required for activating PI3K/AKT signaling
A, WB analyses of effects of KAT6A knockdown on the acetylation of H3K23, H3K9, H3K14 and KAT6A expression. Histone H3 and β-actin were used as controls. B, Overexpression of KAT6A wild type but not acetyltransferase activity deficient mutant, G657E or C543G/G657E, restored KAT6A knockdown-inhibited activation of PI3K/AKT signaling pathway. C and D, Effects of overexpression of KAT6A wild type, acetyltransferase activity deficient mutant, G657E or C543G/G657E, on cell proliferation (C) and colony formation in soft agar in LN229 GBM cells (D). E-G, Inhibition of PI3K suppressed KAT6A-stimulated AKT phosphorylation (E), cell proliferation (F), and colony formation (G). Data are representative from two independent experiments with similar results. Error bars±SD. *, P < 0.05.
Figure 6
Figure 6. KAT6A promotes H3K23ac association with TRIM24 to mediate PI3K/AKT signaling
A, Immunoprecipitation (IP) and WB analyses of effects of KAT6A knockdown on H3K23ac association with TRIM24. B, ChIP-qPCR assays of the binding of TRIM24 and H3K23ac with the PIK3CA promoter. C, Overexpression of Flag-TRIM24 wild type but not the binding mutant of TRIM24 with H3K23ac, F979A/N980A, promoted PIK3CA expression and AKT activation. D, Effects of overexpression of Flag-TRIM24 wild type or F979A/N980A mutant on the binding of TRIM24 and H3K23ac with PIK3CA promoter. E and F, Effects of overexpression of Flag-TRIM24 wild type or F979A/N980A mutant on cell proliferation (E) and colony formation in soft agar in LN229 GBM cells (F). Data are representative from two independent experiments with similar results. Error bars ±SD. *, P < 0.05.
Figure 7
Figure 7. A working model for KAT6A-regulated glioma tumorigenesis
KAT6A/MOZ interacts with ING5, EAF6 and BRPF1, and highly promotes H3K23 acetylation, and recruits TRIM24 binding with PIK3CA promoter to upregulate its transcription, resulting in PI3K/AKT signaling pathway activation and glioma tumorigenesis.

References

    1. Stupp R, Mason WP, van den Bent MJ, Weller M, Fisher B, Taphoorn MJ, et al. Radiotherapy plus concomitant and adjuvant temozolomide for glioblastoma. N Engl J Med. 2005;352:987–96. - PubMed
    1. Maleszewska M, Kaminska B. Deregulation of histone-modifying enzymes and chromatin structure modifiers contributes to glioma development. Future oncology. 2015;11:2587–601. - PubMed
    1. Waldmann T, Schneider R. Targeting histone modifications--epigenetics in cancer. Current opinion in cell biology. 2013;25:184–9. - PubMed
    1. Schwartzentruber J, Korshunov A, Liu XY, Jones DT, Pfaff E, Jacob K, et al. Driver mutations in histone H3.3 and chromatin remodelling genes in paediatric glioblastoma. Nature. 2012;482:226–31. - PubMed
    1. Voss AK, Collin C, Dixon MP, Thomas T. Moz and retinoic acid coordinately regulate H3K9 acetylation, Hox gene expression, and segment identity. Developmental cell. 2009;17:674–86. - PubMed

Publication types

MeSH terms